TAKER vs FLOW: Which Protocol Dominates the Future of Decentralized Trading?


Introduction: Investment Comparison Between TAKER and FLOW
In the cryptocurrency market, the comparison between TAKER vs FLOW remains a topic of ongoing discussion among investors. Both assets demonstrate notable differences in market cap ranking, application scenarios, and price performance, representing distinct positioning within the crypto asset landscape.
TAKER (TAKER): Launched in 2025, TAKER has positioned itself as the first and largest Bitcoin ecosystem incentive protocol, designed to democratize Bitcoin gains for fractional Bitcoin holders. As a Bitcoin Incentive Layer, it leverages multiple reward frameworks to encourage adoption and utilization of Bitcoin and its derivatives.
FLOW (FLOW): Since its introduction in 2020, FLOW has established itself as a platform for next-generation games, applications, and digital assets. It represents one of the blockchain networks specifically designed for mainstream adoption, integrating usability improvements at the protocol layer.
This article examines the investment value comparison between TAKER vs FLOW through an analysis of historical price trends, supply mechanisms, institutional backing, technological ecosystems, and future outlook, addressing a key question for investors:
"Which represents a more suitable investment consideration at the current time?"
I. Historical Price Comparison and Current Market Status
TAKER (Coin A) and FLOW (Coin B) Historical Price Trends
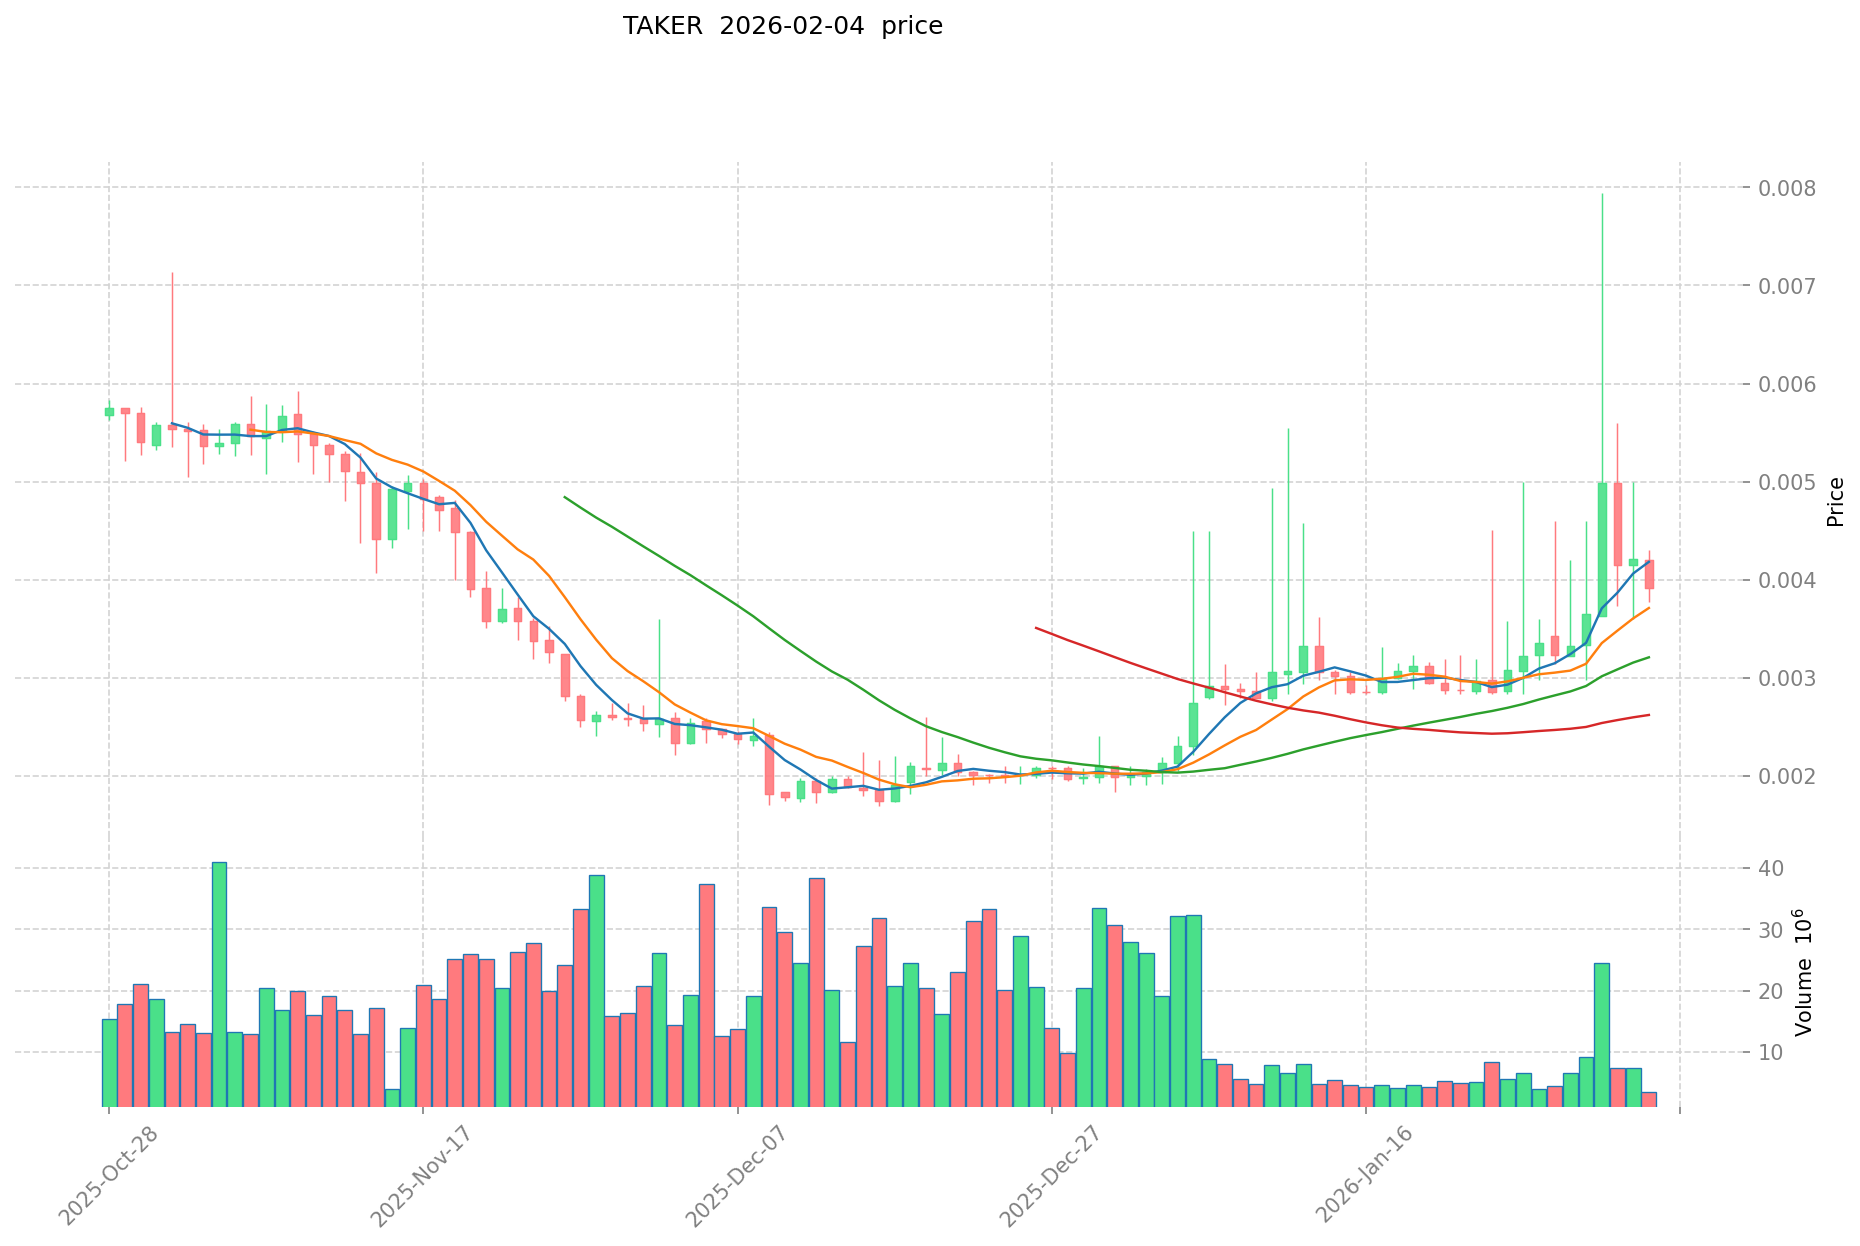
- 2025: TAKER launched on July 18, 2025, with an initial price of $0.1. The token reached an all-time high of $0.2252 on the same date, driven by initial market enthusiasm.
- 2021: FLOW achieved its all-time high of $42.4 on April 5, 2021, during the broader cryptocurrency market boom, reflecting strong demand for NFT-focused blockchain infrastructure.
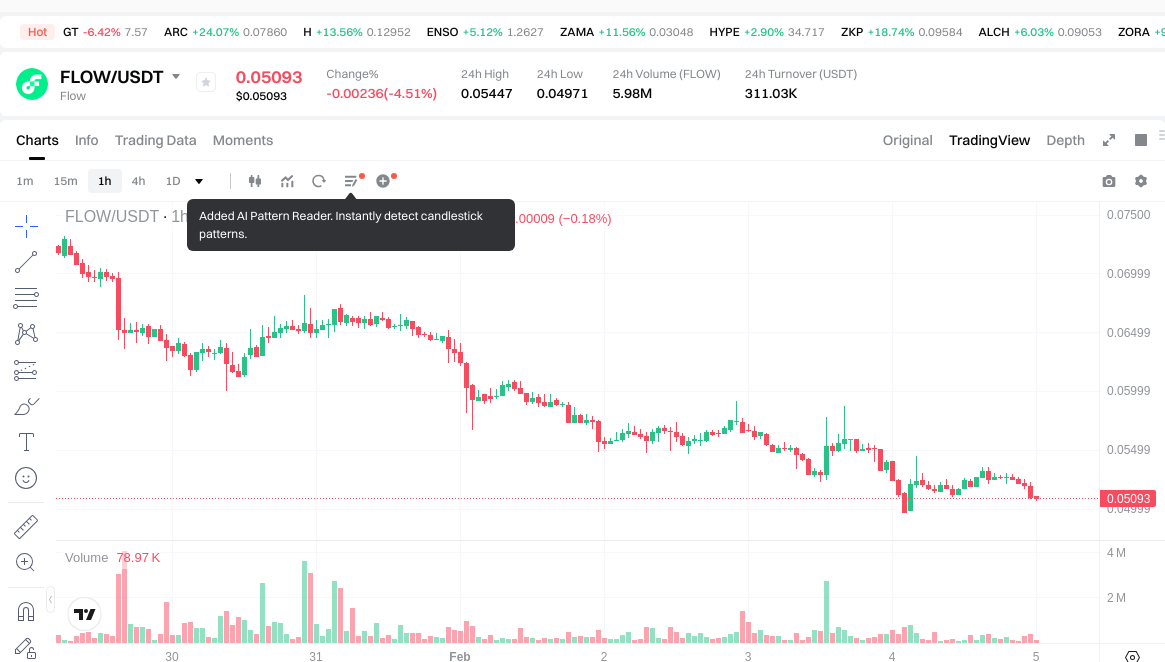
- Comparative Analysis: During recent market cycles, TAKER declined from its all-time high of $0.2252 to a record low of $0.001687 on December 16, 2025, while FLOW experienced a more extended decline from its 2021 peak of $42.4 to an all-time low of $0.04818036 on February 4, 2026.
Current Market Status (February 5, 2026)
- TAKER current price: $0.003734
- FLOW current price: $0.0507
- 24-hour trading volume: TAKER $15,214.43 vs FLOW $313,573.40
- Market Sentiment Index (Fear & Greed Index): 14 (Extreme Fear)
View real-time prices:
- Check TAKER current price Market Price
- Check FLOW current price Market Price
II. Core Factors Influencing TAKER vs FLOW Investment Value
Supply Mechanism Comparison (Tokenomics)
- TAKER: Information regarding supply mechanism is not available in the reference materials.
- FLOW: Information regarding supply mechanism is not available in the reference materials.
- 📌 Historical patterns: The relationship between supply mechanisms and price cycle dynamics has been observed in cryptocurrency markets, where different tokenomic models may influence liquidity provider and liquidity taker positions in distinct ways.
Institutional Adoption and Market Application
- Institutional Holdings: Reference materials suggest that liquidity providers and liquidity takers maintain opposing positions in market structures, though specific institutional preference data for TAKER or FLOW is not available.
- Enterprise Adoption: Specific applications of TAKER and FLOW in cross-border payments, settlements, or investment portfolios are not detailed in the available materials.
- National Policy: Regulatory attitudes toward these assets across different jurisdictions are not specified in the reference materials.
Technical Development and Ecosystem Construction
- TAKER Technical Upgrades: Specific technical development information is not available in the reference materials.
- FLOW Technical Development: Specific technical development information is not available in the reference materials.
- Ecosystem Comparison: The reference materials discuss order flow characteristics, market depth, and bid-ask spread dynamics relevant to liquidity provision, though specific DeFi, NFT, payment, or smart contract implementations for TAKER and FLOW are not detailed.
Macroeconomic Conditions and Market Cycles
- Performance Under Inflation: Comparative anti-inflation properties between TAKER and FLOW are not specified in the available materials.
- Macroeconomic Monetary Policy: The influence of interest rates and dollar index movements on these assets is not detailed in the reference materials.
- Geopolitical Factors: While cross-border transaction demands and international situations may affect cryptocurrency markets generally, specific impacts on TAKER and FLOW are not addressed in the available materials.
III. 2026-2031 Price Prediction: TAKER vs FLOW
Short-term Prediction (2026)
- TAKER: Conservative $0.00249575 - $0.003725 | Optimistic $0.003725 - $0.004172
- FLOW: Conservative $0.0360112 - $0.05072 | Optimistic $0.05072 - $0.0588352
Mid-term Prediction (2028-2029)
- TAKER may enter a gradual growth phase, with estimated price range of $0.0029313664 - $0.0057711276 in 2028, potentially reaching $0.00362298566 - $0.006055561746 by 2029
- FLOW may experience a consolidation phase, with estimated price range of $0.0409736448 - $0.0801396288 in 2028, potentially reaching $0.043522446528 - $0.074409344064 by 2029
- Key drivers: institutional capital inflows, ETF developments, ecosystem expansion
Long-term Prediction (2031)
- TAKER: Base scenario $0.004625031033842 - $0.00651412821668 | Optimistic scenario $0.00651412821668 - $0.008077518988683
- FLOW: Base scenario $0.06981979678138 - $0.07844920986672 | Optimistic scenario $0.07844920986672 - $0.085509638754724
Disclaimer
TAKER:
| Year | Predicted High Price | Predicted Average Price | Predicted Low Price | Price Change |
|---|---|---|---|---|
| 2026 | 0.004172 | 0.003725 | 0.00249575 | 0 |
| 2027 | 0.00521202 | 0.0039485 | 0.00339571 | 5 |
| 2028 | 0.0057711276 | 0.00458026 | 0.0029313664 | 22 |
| 2029 | 0.006055561746 | 0.0051756938 | 0.00362298566 | 38 |
| 2030 | 0.00741262866036 | 0.005615627773 | 0.00342553294153 | 50 |
| 2031 | 0.008077518988683 | 0.00651412821668 | 0.004625031033842 | 74 |
FLOW:
| Year | Predicted High Price | Predicted Average Price | Predicted Low Price | Price Change |
|---|---|---|---|---|
| 2026 | 0.0588352 | 0.05072 | 0.0360112 | 0 |
| 2027 | 0.06573312 | 0.0547776 | 0.053134272 | 7 |
| 2028 | 0.0801396288 | 0.06025536 | 0.0409736448 | 18 |
| 2029 | 0.074409344064 | 0.0701974944 | 0.043522446528 | 37 |
| 2030 | 0.08459500050144 | 0.072303419232 | 0.0686882482704 | 41 |
| 2031 | 0.085509638754724 | 0.07844920986672 | 0.06981979678138 | 53 |
IV. Investment Strategy Comparison: TAKER vs FLOW
Long-term vs Short-term Investment Strategies
- TAKER: May be considered by investors interested in emerging Bitcoin ecosystem protocols and early-stage participation opportunities, though the asset exhibits higher volatility and limited market depth based on current trading volume data
- FLOW: May be considered by investors seeking exposure to established blockchain infrastructure with a focus on digital asset applications, though the asset has experienced significant drawdown from previous price levels
Risk Management and Asset Allocation
- Conservative investors: TAKER 10-15% vs FLOW 85-90% (allocation based on market maturity and trading volume considerations)
- Aggressive investors: TAKER 30-40% vs FLOW 60-70% (higher allocation to emerging assets with consideration for liquidity constraints)
- Hedging instruments: stablecoin allocation, options strategies, cross-asset portfolio diversification
V. Potential Risk Comparison
Market Risk
- TAKER: Limited trading volume ($15,214.43 daily) suggests reduced liquidity and potential for increased price volatility; recent price decline of over 98% from all-time high indicates significant market uncertainty
- FLOW: Sustained decline from 2021 peak levels reflects ongoing market challenges; higher trading volume ($313,573.40 daily) provides relatively improved liquidity compared to TAKER, though still subject to broader market sentiment fluctuations
Technical Risk
- TAKER: Scalability characteristics and network stability parameters are not detailed in available materials; early-stage protocol may face developmental uncertainties
- FLOW: Network stability and security considerations are not specified in available materials; blockchain infrastructure faces ongoing technical evolution requirements
Regulatory Risk
- Global regulatory developments may affect both assets differently based on their respective use cases and jurisdictional presence, though specific regulatory exposure for TAKER and FLOW is not detailed in available materials
VI. Conclusion: Which Is the Better Buy?
📌 Investment Value Summary:
- TAKER advantages: Early-stage positioning within Bitcoin ecosystem protocols; potential for growth if adoption materializes; lower absolute price point
- FLOW advantages: Established market presence since 2020; higher trading volume indicating improved liquidity; infrastructure positioning for digital asset applications
✅ Investment Recommendations:
- Novice investors: Consider prioritizing assets with established trading history and higher liquidity; both TAKER and FLOW present significant volatility considerations requiring careful evaluation
- Experienced investors: May evaluate portfolio allocation based on risk tolerance, with consideration for liquidity differences and market maturity levels between the two assets
- Institutional investors: Consider liquidity requirements and market depth characteristics; FLOW demonstrates relatively higher trading volume that may align better with larger position management needs
⚠️ Risk Disclosure: Cryptocurrency markets exhibit extreme volatility. This content does not constitute investment advice.
VII. FAQ
Q1: What is the current price difference between TAKER and FLOW as of February 2026?
As of February 5, 2026, TAKER is trading at $0.003734 while FLOW is trading at $0.0507, representing a significant absolute price differential. This price gap reflects their different market positions, with FLOW demonstrating approximately 13.5 times higher pricing than TAKER. The substantial difference also correlates with their respective trading volumes, where FLOW records $313,573.40 in 24-hour volume compared to TAKER's $15,214.43, indicating FLOW's relatively stronger market liquidity and established presence since its 2020 launch versus TAKER's more recent 2025 introduction.
Q2: How have TAKER and FLOW performed relative to their all-time highs?
Both assets have experienced substantial declines from their respective all-time highs. TAKER declined approximately 98.3% from its all-time high of $0.2252 (achieved on its launch date of July 18, 2025) to a record low of $0.001687 on December 16, 2025. FLOW has experienced an even more extended drawdown, falling approximately 99.88% from its all-time high of $42.4 (reached on April 5, 2021) to an all-time low of $0.04818036 on February 4, 2026. These significant retracements reflect the broader cryptocurrency market volatility and the extreme fear sentiment currently indicated by the Fear & Greed Index at 14.
Q3: What are the projected price ranges for TAKER and FLOW by 2031?
According to the long-term predictions, TAKER's 2031 price range is estimated between $0.004625031033842 and $0.008077518988683, with the base scenario ranging from $0.004625031033842 to $0.00651412821668 and the optimistic scenario extending to $0.008077518988683. FLOW's 2031 projections suggest a range between $0.06981979678138 and $0.085509638754724, with the base scenario at $0.06981979678138 to $0.07844920986672 and the optimistic scenario reaching $0.085509638754724. These predictions assume a potential cumulative growth of approximately 74% for TAKER and 53% for FLOW from their 2026 baseline, though such forecasts remain subject to significant market uncertainties.
Q4: Which asset demonstrates better liquidity characteristics?
FLOW demonstrates substantially superior liquidity characteristics compared to TAKER based on current market data. FLOW's 24-hour trading volume of $313,573.40 is approximately 20.6 times higher than TAKER's $15,214.43, indicating significantly deeper market participation and easier position entry/exit capabilities. This liquidity differential has important implications for investors, particularly institutional participants managing larger positions, as FLOW's higher trading volume suggests reduced slippage potential and improved price discovery mechanisms. The limited trading volume for TAKER may result in increased price volatility and wider bid-ask spreads, presenting additional execution risk considerations.
Q5: What are the primary risk differences between investing in TAKER versus FLOW?
The primary risk differentials center on market maturity and liquidity constraints. TAKER presents higher market risk due to its limited trading volume and recent 98%+ decline from all-time highs, suggesting elevated volatility and reduced liquidity for position management. As an early-stage protocol launched in 2025, TAKER also faces developmental uncertainties and unproven adoption trajectories. FLOW, while experiencing its own significant drawdown from 2021 peaks, benefits from a longer operational history since 2020 and relatively improved liquidity, though it remains exposed to broader market sentiment fluctuations. Both assets face regulatory uncertainties and technical evolution requirements, but FLOW's established infrastructure positioning may provide moderately improved risk parameters compared to TAKER's emerging protocol status.
Q6: What portfolio allocation strategy is suggested for different investor types?
Investment allocation recommendations vary significantly by investor profile and risk tolerance. Conservative investors may consider a 10-15% TAKER allocation versus 85-90% FLOW allocation, prioritizing the more established asset with higher liquidity characteristics. Aggressive investors might adopt a 30-40% TAKER versus 60-70% FLOW split, accepting higher exposure to the emerging asset's potential upside while acknowledging associated liquidity constraints. However, these allocations assume investors have already decided to include both assets in their portfolios. Novice investors should prioritize assets with established trading history and higher liquidity, while institutional investors should carefully evaluate whether TAKER's limited market depth aligns with their position management requirements, potentially favoring FLOW's relatively higher trading volume.
Q7: How do the use cases differ between TAKER and FLOW?
TAKER positions itself as a Bitcoin ecosystem incentive protocol designed to democratize Bitcoin gains for fractional Bitcoin holders, functioning as a Bitcoin Incentive Layer that leverages multiple reward frameworks to encourage adoption and utilization of Bitcoin and its derivatives. This represents a specialized focus on Bitcoin ecosystem enhancement and holder participation mechanisms. FLOW, in contrast, establishes itself as a blockchain platform specifically designed for next-generation games, applications, and digital assets, integrating usability improvements at the protocol layer for mainstream adoption. These divergent use cases reflect different value propositions: TAKER targets Bitcoin ecosystem participants seeking yield enhancement opportunities, while FLOW addresses developers and users requiring blockchain infrastructure for digital asset applications, games, and mainstream-oriented decentralized applications.
Q8: What market sentiment factors should investors consider when evaluating TAKER versus FLOW?
Current market sentiment presents significant headwinds for both assets, as indicated by the Fear & Greed Index reading of 14 (Extreme Fear) as of February 5, 2026. This extreme fear environment typically correlates with heightened selling pressure, reduced risk appetite, and potential for continued volatility across cryptocurrency markets. Within this context, TAKER's substantially lower trading volume amplifies exposure to sentiment-driven price swings, as limited market depth can accelerate both downward and upward price movements during sentiment shifts. FLOW's higher liquidity provides moderate insulation against sentiment-driven volatility, though both assets remain vulnerable to broader market dynamics. Investors should recognize that extreme fear periods have historically preceded both extended downturns and eventual recovery phases, though timing such transitions remains highly uncertain and both assets require careful sentiment monitoring alongside fundamental evaluation.
Share
Content
Introduction: Investment Comparison Between TAKER and FLOW
I. Historical Price Comparison and Current Market Status
II. Core Factors Influencing TAKER vs FLOW Investment Value
III. 2026-2031 Price Prediction: TAKER vs FLOW
IV. Investment Strategy Comparison: TAKER vs FLOW
V. Potential Risk Comparison
VI. Conclusion: Which Is the Better Buy?
VII. FAQ
How to Buy Cryptocurrency


Trending Cryptocurrencies


2025 SUI coin: price, buying guide, and Staking rewards

How to Buy Crypto: A Step-by-Step Guide with Gate.com

HNT Price in 2025: Helium Network Token Value and Market Analysis

What is SwissCheese (SWCH) and How Does It Democratize Investment?

Cardano (ADA) Price Analysis and Outlook for 2025
How to Invest in Metaverse Crypto

Top 15 Altcoins for Investment in 2025

Bitcoin Dominance and Market Analysis: A Comprehensive Guide

What is a cryptocurrency airdrop: where to find them and how to earn

Trading Indicators: Definition and Function

What Are Take Profit and Stop Loss: How to Set TP and SL in Trading