This comprehensive analysis compares TRVL and APT as investment opportunities within the cryptocurrency market. TRVL, a decentralized travel utility token launched in 2021, contrasts sharply with APT, a Layer 1 blockchain platform utilizing Move programming language introduced in October 2022. The article examines critical differences in market capitalization ($549,922 vs $923 million), trading volume ($10,845 vs $2.09 million), price trajectories, and technological ecosystems. It provides detailed price forecasts through 2031, investment strategies tailored to different investor profiles, comprehensive risk assessments, and practical allocation recommendations. Current market conditions reflect extreme fear sentiment, presenting distinct opportunities and challenges for both assets, with APT offering superior liquidity and established infrastructure, while TRVL presents higher speculation potential within niche travel applications.
Introduction: Investment Comparison Between TRVL and APT
In the cryptocurrency market, the comparison between TRVL vs APT continues to be a relevant topic for investors. The two tokens differ significantly in market capitalization ranking, application scenarios, and price performance, representing distinct positioning within the crypto asset landscape.
TRVL (TRVL): As the utility token of Dtravel ecosystem launched in 2021, it focuses on empowering ownership in travel through decentralized solutions addressing challenges in trust, reputation, distribution, connectivity, and direct bookings in the travel industry.
APT (APT): Launched in October 2022, Aptos positions itself as a high-performance Layer 1 blockchain utilizing the Move programming language, aiming to provide secure and scalable infrastructure for decentralized applications.
This article will provide a comprehensive analysis of the TRVL vs APT investment value comparison, examining historical price trends, supply mechanisms, adoption patterns, technological ecosystems, and future outlook, while addressing investors' key question:
"Which is the better buy right now?"
I. Historical Price Comparison and Current Market Status
Historical Price Trends of TRVL and APT
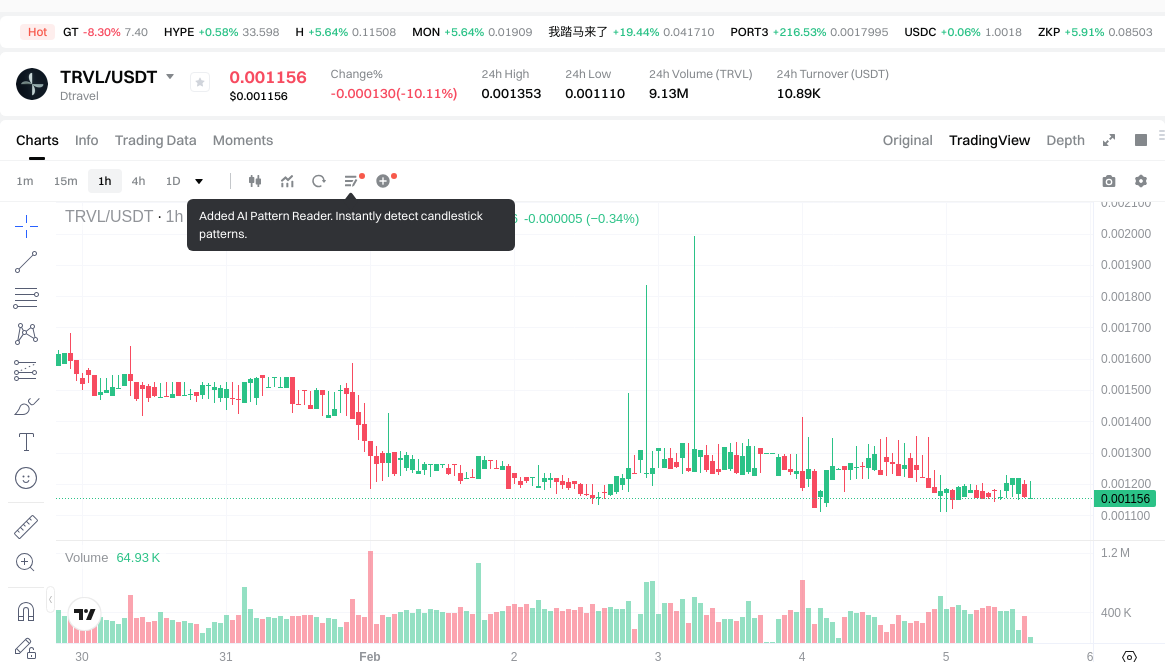
- 2021: TRVL reached its all-time high of $1.56 on November 28, 2021, during the broader cryptocurrency market rally.
- 2022: APT launched its mainnet in October 2022, with an initial listing period that attracted significant attention as a new Layer 1 blockchain project.
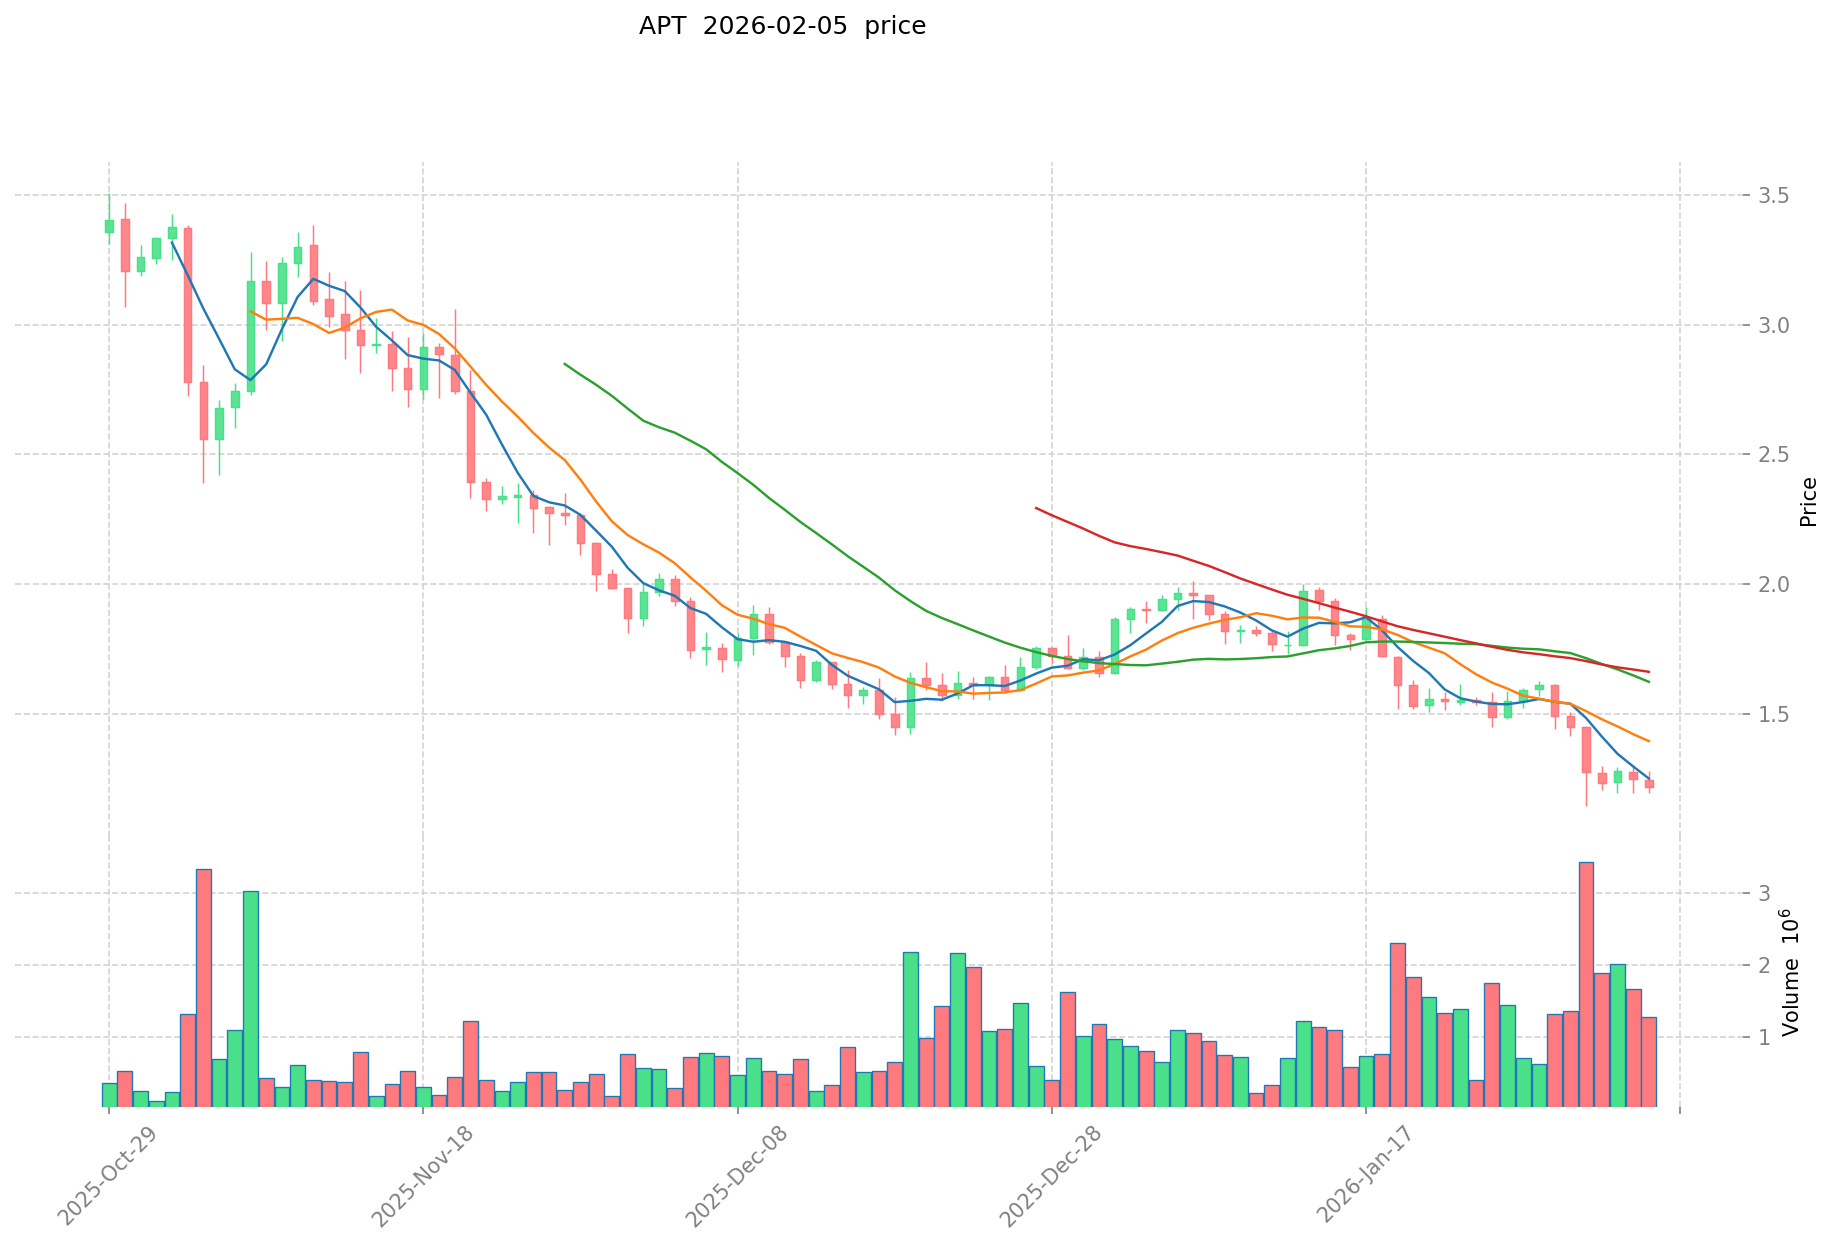
- 2023: APT achieved its historical peak of $19.92 on January 26, 2023, driven by strong initial market interest and ecosystem development momentum.
- 2026: TRVL recorded its all-time low of $0.00114548 on February 4, 2026, reflecting substantial value decline from its peak. Meanwhile, APT reached its all-time low of $1.20 on February 5, 2026.
- Comparative Analysis: During the recent market cycle, TRVL declined from its peak of $1.56 to its current level of $0.001209, representing a significant downward trend. In contrast, APT experienced a decline from $19.92 to $1.2051, showing similar bearish pressure across different magnitude scales.
Current Market Status (February 5, 2026)
- TRVL Current Price: $0.001209
- APT Current Price: $1.2051
- 24-Hour Trading Volume: TRVL recorded $10,845.55 vs APT's $2,090,550.42, indicating substantially higher liquidity for APT
- Market Capitalization: TRVL stands at $549,922.48 while APT maintains $923,246,525.02
- Market Sentiment Index (Fear & Greed Index): 12 (Extreme Fear)
View real-time prices:
II. Core Factors Affecting TRVL vs APT Investment Value
Supply Mechanism Comparison (Tokenomics)
The provided materials do not contain specific information regarding the supply mechanisms of TRVL or APT tokens. The reference material discusses Arbitrage Pricing Theory (APT) as a financial asset pricing model rather than details about specific cryptocurrency tokenomics.
Institutional Adoption and Market Applications
The available materials lack information on institutional holdings, enterprise adoption patterns, or regulatory attitudes toward TRVL and APT. Cross-border payment applications, settlement mechanisms, and investment portfolio integrations for these assets are not covered in the reference documents.
Technical Development and Ecosystem Construction
Technical upgrade information for TRVL and APT is not present in the provided materials. The reference content focuses primarily on the theoretical framework of Arbitrage Pricing Theory without addressing specific blockchain technology developments, DeFi integrations, NFT ecosystems, payment implementations, or smart contract deployments for either asset.
Macroeconomic Factors and Market Cycles
According to the reference materials on APT (Arbitrage Pricing Theory), asset returns are influenced by multiple macroeconomic variables including inflation rates and GDP growth rates. The APT model assumes a linear relationship between expected returns and various factors, operating under a no-arbitrage equilibrium assumption. The model considers that asset returns are affected not only by overall market risk but also by macroeconomic variables, industry-specific factors, and company-specific elements. However, specific performance data of TRVL or APT tokens under different inflationary environments, monetary policy impacts, or geopolitical scenarios are not available in the provided materials.
III. 2026-2031 Price Forecast: TRVL vs APT
Short-term Forecast (2026)
- TRVL: Conservative $0.00115 - $0.00121 | Optimistic $0.00121 - $0.00168
- APT: Conservative $1.09 - $1.20 | Optimistic $1.20 - $1.61
Medium-term Forecast (2028-2029)
- TRVL may enter a gradual accumulation phase, with estimated price range of $0.00116 - $0.00220
- APT may enter a recovery and expansion phase, with estimated price range of $1.19 - $2.44
- Key drivers: institutional capital flows, ETF development, ecosystem expansion
Long-term Forecast (2030-2031)
- TRVL: Base scenario $0.00136 - $0.00272 | Optimistic scenario $0.00239 - $0.00304
- APT: Base scenario $1.49 - $2.98 | Optimistic scenario $2.14 - $2.97
View detailed price predictions for TRVL and APT
Disclaimer
TRVL:
| Year |
Predicted High Price |
Predicted Average Price |
Predicted Low Price |
Price Change |
| 2026 |
0.00168051 |
0.001209 |
0.00114855 |
0 |
| 2027 |
0.00192152415 |
0.001444755 |
0.00085240545 |
19 |
| 2028 |
0.00217125005175 |
0.001683139575 |
0.00116136630675 |
38 |
| 2029 |
0.002197002087247 |
0.001927194813375 |
0.001156316888025 |
59 |
| 2030 |
0.00272196995441 |
0.002062098450311 |
0.001402226946211 |
70 |
| 2031 |
0.003037883436998 |
0.002392034202361 |
0.001363459495345 |
97 |
APT:
| Year |
Predicted High Price |
Predicted Average Price |
Predicted Low Price |
Price Change |
| 2026 |
1.611618 |
1.2027 |
1.094457 |
0 |
| 2027 |
2.08259532 |
1.407159 |
1.2664431 |
16 |
| 2028 |
1.9542624192 |
1.74487716 |
1.1865164688 |
44 |
| 2029 |
2.441432122272 |
1.8495697896 |
1.350185946408 |
52 |
| 2030 |
2.98224632875104 |
2.145500955936 |
1.80222080298624 |
77 |
| 2031 |
2.974093425118483 |
2.56387364234352 |
1.487046712559241 |
111 |
IV. Investment Strategy Comparison: TRVL vs APT
Long-term vs Short-term Investment Strategies
- TRVL: Suited for investors seeking exposure to niche travel industry applications with higher risk tolerance, focusing on potential ecosystem recovery and utility-driven value appreciation in the decentralized travel sector.
- APT: Suited for investors interested in Layer 1 blockchain infrastructure with established ecosystem foundations, seeking exposure to smart contract platforms and decentralized application development potential.
Risk Management and Asset Allocation
- Conservative Investors: TRVL 10-15% vs APT 85-90%
- Aggressive Investors: TRVL 25-30% vs APT 70-75%
- Hedging Tools: Stablecoin allocation, diversified portfolio construction across multiple asset classes
V. Potential Risk Comparison
Market Risk
- TRVL: Substantially lower market capitalization at $549,922.48 and reduced liquidity with 24-hour trading volume of $10,845.55, indicating vulnerability to significant price volatility and potential difficulty in executing large trades without market impact.
- APT: Market capitalization of $923,246,525.02 with trading volume of $2,090,550.42 provides relatively enhanced liquidity, though both assets experienced substantial decline patterns reaching respective historical lows in early 2026, reflecting broader market sentiment challenges.
Technical Risk
- TRVL: Limited information available regarding network scalability, infrastructure development status, and ongoing technical maintenance, potentially affecting long-term ecosystem viability.
- APT: As a Layer 1 blockchain platform, faces inherent challenges related to network scalability, validator decentralization, and potential security vulnerabilities common to smart contract platforms.
Regulatory Risk
- Global regulatory developments may affect both assets differently, with TRVL's travel-focused utility potentially subject to sector-specific regulations, while APT as a Layer 1 infrastructure may face broader blockchain platform regulatory scrutiny across various jurisdictions.
VI. Conclusion: Which Is the Better Buy?
📌 Investment Value Summary:
- TRVL Advantages: Specialized focus on decentralized travel industry applications, potential for niche market positioning within specific use cases.
- APT Advantages: Established Layer 1 blockchain infrastructure with relatively higher market capitalization, enhanced liquidity profile, and broader ecosystem development potential.
✅ Investment Recommendations:
- Novice Investors: Consider APT for relatively established infrastructure and higher liquidity characteristics, while approaching TRVL with caution due to significantly lower market presence and trading activity.
- Experienced Investors: May explore diversified allocation strategies incorporating both assets based on individual risk tolerance, with emphasis on thorough due diligence regarding ecosystem development trajectories and market positioning.
- Institutional Investors: Focus on comprehensive fundamental analysis, liquidity requirements, and portfolio risk management frameworks when evaluating exposure to either asset class.
⚠️ Risk Disclosure: Cryptocurrency markets exhibit substantial volatility. This analysis does not constitute investment advice. Investors should conduct independent research and consider their individual financial circumstances before making investment decisions.
VII. FAQ
Q1: What are the main differences between TRVL and APT?
TRVL is a utility token focused on decentralized travel solutions launched in 2021, while APT is a Layer 1 blockchain platform launched in October 2022 that uses the Move programming language for scalable decentralized applications. The fundamental difference lies in their use cases: TRVL addresses specific challenges in the travel industry (trust, reputation, bookings), whereas APT provides broader blockchain infrastructure for various decentralized applications. Additionally, APT demonstrates significantly higher market capitalization ($923 million vs $550,000) and trading volume ($2.09 million vs $10,845 in 24 hours), indicating vastly different market positions and liquidity profiles.
Q2: Which asset carries higher investment risk?
TRVL carries substantially higher investment risk due to its extremely low market capitalization of approximately $549,922 and minimal 24-hour trading volume of $10,845, making it highly susceptible to volatility and potential liquidity challenges. The token has declined approximately 99.92% from its all-time high of $1.56 to its current price of $0.001209. While APT also experienced significant decline from $19.92 to $1.2051 (approximately 94%), its considerably larger market presence, higher trading volume, and established Layer 1 infrastructure provide relatively better liquidity and market stability compared to TRVL's niche positioning.
Q3: What is the price forecast outlook for 2026-2031?
For TRVL, conservative estimates suggest a range of $0.00115-$0.00121 in 2026, potentially reaching $0.00239-$0.00304 by 2031 under optimistic scenarios, representing modest recovery potential. APT's conservative forecast indicates $1.09-$1.20 in 2026, with potential growth to $2.14-$2.97 by 2031 in optimistic scenarios. These forecasts suggest APT may experience more substantial absolute price appreciation, while TRVL's percentage gains could be higher but from an extremely low base. However, investors should note these projections carry significant uncertainty and depend on numerous factors including market cycles, ecosystem development, and broader cryptocurrency adoption trends.
Q4: Which allocation strategy is appropriate for different investor types?
Conservative investors should consider allocating 85-90% to APT and 10-15% to TRVL, prioritizing the more established Layer 1 infrastructure with superior liquidity characteristics. Aggressive investors with higher risk tolerance may increase TRVL allocation to 25-30% while maintaining 70-75% in APT, seeking potential outsized returns from TRVL's lower market cap position. Novice investors are recommended to focus primarily on APT due to its relatively established infrastructure, avoiding TRVL until gaining more market experience. All strategies should incorporate stablecoin allocations and diversification across multiple asset classes for effective risk management.
Q5: How does current market sentiment affect these assets?
The current Fear & Greed Index stands at 12 (Extreme Fear), indicating severely negative market sentiment that typically affects all cryptocurrency assets. Both TRVL and APT recently reached their respective all-time lows on February 4-5, 2026, reflecting this bearish environment. During extreme fear conditions, lower-liquidity assets like TRVL tend to experience more severe price pressure and recovery challenges, while higher-liquidity assets like APT may demonstrate relatively better resilience. Historically, extreme fear periods can present accumulation opportunities for long-term investors, though timing market bottoms remains highly uncertain and requires careful risk assessment.
Q6: What technical advantages does APT offer over TRVL?
APT operates as a Layer 1 blockchain utilizing the Move programming language, designed specifically for secure and scalable smart contract execution, providing foundational infrastructure for diverse decentralized applications. This positions APT within the broader blockchain infrastructure category alongside other major Layer 1 platforms. In contrast, TRVL functions as a utility token for a specific travel ecosystem addressing industry-specific challenges. The technical scope differs fundamentally: APT offers programmable blockchain infrastructure with potential applications across multiple sectors, while TRVL provides utility within a narrowly defined travel booking and ownership use case, limiting its technical versatility.
Q7: What are the primary risk factors investors should monitor?
Investors should monitor several critical risk factors: (1) Market risk - both assets experienced substantial declines reaching historical lows, indicating potential for continued volatility; (2) Liquidity risk - TRVL's extremely low trading volume presents significant challenges for position entry and exit; (3) Technical risk - limited information regarding TRVL's ongoing development and APT's network scalability challenges; (4) Regulatory risk - evolving global cryptocurrency regulations may impact both assets differently based on their use cases; (5) Ecosystem development risk - both projects' long-term viability depends on continued adoption, developer activity, and user growth within their respective ecosystems.
Q8: Should investors buy TRVL or APT in the current market conditions?
Neither asset represents a clear "must-buy" recommendation under current extreme fear market conditions. APT offers relatively better liquidity, established infrastructure, and higher market capitalization, making it more suitable for investors seeking exposure to Layer 1 blockchain platforms with risk tolerance appropriate for volatile assets. TRVL's extremely low market cap and limited liquidity make it suitable only for highly speculative positions with capital investors can afford to lose entirely. Most investors should prioritize comprehensive due diligence, consider their risk tolerance carefully, implement proper position sizing (limiting cryptocurrency exposure to a small percentage of total portfolio), and avoid making investment decisions based solely on price forecasts or market sentiment indicators.
* The information is not intended to be and does not constitute financial advice or any other recommendation of any sort offered or endorsed by Gate.