Understanding Reversal Candlestick Patterns: A Complete Guide

The Reversal Candle Pattern: What Is It and How Does It Work?
A reversal candle pattern is a type of candlestick grouping or positioning that signals the current price trend might attempt to change direction. Unlike standard candlestick structures, reversal patterns are distinguished by their specific candle groupings and formation characteristics. These patterns can indicate both bullish and bearish reversals, providing traders with valuable insights into potential trend changes.
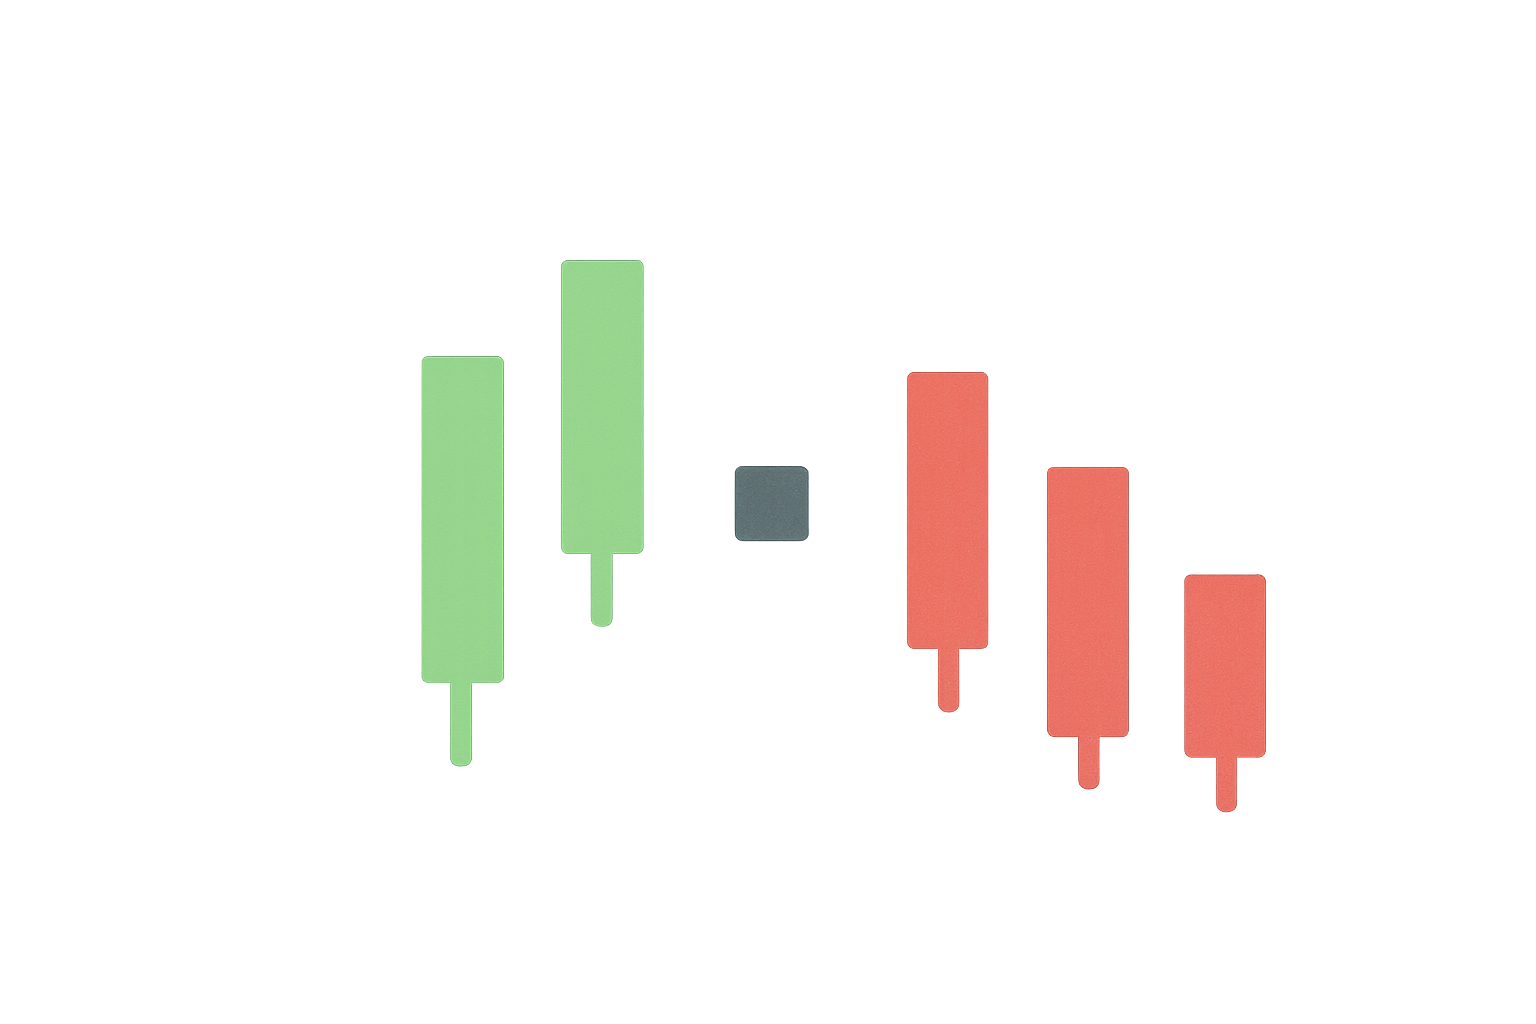
Candlesticks serve as the fundamental building blocks of price charts in technical analysis. Understanding their structure is essential for interpreting reversal patterns effectively.
In the case of a bullish candle, the lower edge of the body represents the opening price, while the upper edge indicates the closing price. The lowermost wick (if present) marks the lowest price reached during the given period, whereas the upper wick (if present) shows the highest price achieved.
For a bearish candle, the structure is inverted: the upper edge of the body is the opening price, the upper wick represents the highest price in the period, the lower wick indicates the lowest price, and the lower edge of the body marks the closing price.
Reversal candle patterns utilize these candlestick-specific insights to help traders identify key trend reversal scenarios on price charts. These patterns come in many forms but are broadly categorized as bullish and bearish candlestick reversals.
Bullish reversal patterns typically appear during downtrends, hinting at a possible recovery for beaten-down assets. Conversely, bearish reversal patterns emerge when assets are in uptrends, suggesting potential consolidation or correction phases. Recognizing these patterns enables traders to anticipate market shifts and adjust their strategies accordingly.
Key Differences Between Bullish and Bearish Reversal Candlestick Patterns
Understanding the distinctions between bullish and bearish reversal patterns is crucial for effective trading decisions. One set of patterns hints at a possible surge in prices after an extended period of declines, while the other suggests a potential dip following a steady price rise.
| Parameter | Bullish Candlestick Pattern | Bearish Candlestick Pattern |
|---|---|---|
| Market Sentiment | Sellers might be losing strength | Buyers might be losing strength |
| Appearance | Comprises candlestick formations with long lower wicks | Comprises candlestick formations with long upper wicks |
| Price Action | It might hint at an upcoming rally | It might hint at an imminent correction |
| Examples | Bullish engulfing, morning star | Shooting star, hanging man |
These differences reflect the underlying market psychology and momentum shifts that occur during trend reversals. Bullish patterns often show buyers stepping in to support prices at lower levels, while bearish patterns indicate sellers overwhelming buyers at higher price points.
Ways to Identify Reversal Candle Patterns
Check for a Weakening Trend
By now, we understand that reversal candlestick patterns are designed to trigger trend changes. A reliable method to supplement or predict their formation is to determine whether the asset is in a downtrend or uptrend. As confirming measures, you can look for lower lows in a downtrend and higher highs in an uptrend.
Once you have identified a trend, examine whether trading volumes are decreasing. If you observe volumes dropping amid an up or down trend, you should watch for reversal candlestick patterns to further support the assumption of an incoming change in price action. Declining volume often indicates weakening conviction among market participants, setting the stage for potential reversals.
Keep an Eye Out for Long Candlesticks
Most reversal candlestick patterns feature long bodies and wicks, demonstrating ongoing battles between buyers and sellers. These extended candlesticks typically surface when such formations follow an established trend, signaling that the balance of power may be shifting. The length of the candle body and wicks provides insight into the intensity of the struggle between opposing market forces.
Look for Dojis and Spinning Top Formations
Doji candles represent periods of uncertainty where there is minimal difference between an asset's opening and closing prices. These nearly body-less candles appear whenever a reversal pattern might be developing. As a Doji candle marks market indecision, it typically appears at the peak or bottom of a trend, often driving new reversal candlestick patterns.
Besides Doji formations, Spinning Top patterns at peaks, bottoms, or within respective patterns can also indicate an impending reversal. These formations suggest that neither buyers nor sellers have gained definitive control, creating conditions ripe for trend changes.
Chart Out Crucial Support and Resistance Levels
Most reversal candle patterns appear near support and resistance levels. Marking these levels on a candlestick chart beforehand is advisable if you want to identify reversal candles clearly. Support levels represent price floors where buying interest tends to emerge, while resistance levels act as price ceilings where selling pressure typically increases. Reversal patterns gain additional significance when they form at these critical price zones.
Use Momentum Indicators for Preemption
Momentum indicators like the Relative Strength Index (RSI) and Moving Average Convergence/Divergence (MACD) are excellent tools for detecting weakening trend strength. Once the trend begins weakening, you can wait for the formation of reversal candles to obtain confirmation. These indicators help identify divergences between price action and momentum, providing early warning signals of potential reversals.
Use Formations to Confirm
Even if you have identified a candlestick pattern, you may need to use sloping trendline breaches and pattern breakouts to confirm the reversal. Combining multiple confirmation signals increases the reliability of your analysis and reduces the likelihood of false signals. Pattern confirmation through additional technical tools strengthens your trading conviction.
Bullish Reversal Candlesticks: Top Ones Explained
Three White Soldiers
Definition
This bullish reversal pattern typically appears at the bottom of a downtrend. It is a three-candle formation that signals strong buying momentum and potential trend reversal.
Formation
All candles associated with Three White Soldiers should be bullish (green or white). The first candle should be long and bullish, with the second one being similar but opening at a price higher than the close of the previous candle. The third bullish candle should also be long, again opening higher than the previous candle's close.
However, you receive a more reliable signal if the third candle closes near or above the high of the second candle. This progression demonstrates sustained buying pressure and increasing confidence among market participants.
Pattern Quality
Three White Soldiers is a strong and highly reliable bullish reversal candlestick pattern, provided you encounter it during a clear downtrend or deep consolidation phase. The pattern's reliability stems from its demonstration of consistent buying pressure across three consecutive periods.
Preferred Time Frame
While the Three White Soldiers pattern can work in any timeframe, longer candlestick charts—weekly or daily—offer a more realistic foundation for traders to work with, as they filter out short-term market noise.
Three-Line Strike
Definition
The Three-Line Strike pattern is formed on the principle that one massive bullish candle can quickly erase the confidence of most sellers, leading to a price surge. It is a four-candle pattern with three bearish candles eventually overcome by a powerful bullish one.
Formation
The pattern starts with the asset forming three long bearish or red candles. You should observe that each candle closes near or lower than the low exhibited by the previous candle. Then there should be a long bullish candle that opens lower than the lows of all the previous three candles and closes above the high of the first candle.
For a bearish Three-Line Strike pattern, you should see three long green candles followed by a long bearish candle that engulfs the gains.
Pattern Quality
The Three-Line Strike can also function as a bearish pattern if the first three candles are bullish and the last, longest candle is bearish. The ability to adapt regardless of the trend makes the Three-Line Strike one of the more reliable candlestick patterns in technical analysis.
Preferred Time Frame
This pattern works effectively even for smaller timeframes—hourly or 4-hour candlestick charts—making it suitable for both day traders and swing traders.
Morning Star
Definition
The idea behind the Morning Star candlestick pattern is that a gap-down move during a downtrend can be dramatically optimistic for prices. This is a three-candle pattern, and the overall concept revolves around decreasing selling or bearish pressure.
Formation
The first candle should be a standard bearish one with relatively long shadows and a substantial body. However, the second candle should be positioned in a gap-down zone from the last candle. The second candle can be either red or green (bearish or bullish)—the color doesn't matter here. Instead, the focus shifts to the third candle, which should be bullish and may open near the high of the second candle. The close of this third candle should be above 50% of the real body of the first long bearish candle.
This formation demonstrates a shift from bearish control to bullish momentum, with the middle candle representing a period of indecision.
Pattern Quality
The Morning Star pattern is reliable, and the real body length of the last bullish candle determines the extent of its reliability. A longer third candle suggests stronger bullish conviction.
Preferred Time Frame
Most traders prefer using the Morning Star with RSI and volume-specific indicators on a daily chart to maximize its effectiveness.
Morning Doji Star
Definition
This pattern comprises three candles with a Doji candle in between. This means assets encountering the Morning Doji Star candlestick pattern might be preparing for an uptrend (a reversal from a downtrend) due to market uncertainty and subsequent resolution.
Formation
The first candle should be a long bearish one. Then should come a gap-down Doji, which represents market indecision at a critical juncture. The final confirming candle should be long and must close above the midpoint of the first red candle, demonstrating that buyers have regained control.
Pattern Quality
Even though this isn't the strongest candlestick pattern, it is quite reliable when properly contextualized within the broader market structure.
Preferred Time Frame
It is advisable to use this pattern for preparing price predictions only in a daily or weekly timeframe, where the signals carry more weight.
Engulfing Pattern
Definition
A bullish engulfing pattern emerges when a green and bullish candle completely engulfs the previous bearish one. A clear engulfing formation often results in significant trend reversals, as it demonstrates a decisive shift in market sentiment.
Formation
For an engulfing pattern, there should be a long bearish candle followed by a long bullish candle. The opening and closing prices of the second candle should be lower and higher than the closing and opening prices of the previous candle, respectively. This complete engulfment signifies that buyers have overwhelmed sellers.
Pattern Quality
If all the mentioned guidelines are followed, bullish engulfing is easily the most reliable candlestick reversal to consider. Its visual clarity and strong psychological implications make it a favorite among traders.
Preferred Time Frame
You are better off using this technical analysis pattern on a daily candlestick chart, where it provides the most actionable signals.
Three Outside Up Pattern
Definition
If you look closely, you will notice that the Three Outside Up is essentially an extension of the bullish engulfing pattern. There are three candlesticks present, and the reversal prediction is considerably more accurate due to the additional confirmation.
Formation
The first candle should be a long bearish one. Following this should be a bullish candle that completely engulfs the first candle. The third candle should also be bullish and close above the previous candle's high, providing additional confirmation of the bullish momentum.
Pattern Quality
The Three Outside Up is one of the strongest patterns that can predict candlestick reversals, offering high reliability when properly identified.
Preferred Time Frame
You can use the Three Outside Up pattern on a daily or a four-hour chart for optimal results.
Abandoned Baby (Rare Pattern)
Definition
This pattern is similar to the Morning Doji Star but with a crucial twist: the real body of the candles involved should be separate, and even the shadows or wicks shouldn't overlap. This gap requirement makes it a rare but powerful signal.
Formation
The Abandoned Baby pattern is made of three candles. The first candle should be a long bearish candle. The second one should be a gap-down Doji with zero overlaps with the first. And the third candle should be a gap-up green candle with zero overlaps with the Doji. These gaps emphasize the dramatic shift in market sentiment.
Pattern Quality
The bullish Abandoned Baby is very strong and reliable as a reversal pattern due to its rarity and clear structural requirements.
Preferred Time Frame
This candlestick pattern works best in any given timeframe owing to its strength and reliability, though it appears most frequently on daily charts.
Hammer
Definition
The bullish Hammer is a single-candlestick pattern. Also, as it relies on one candlestick, the reliability quotient requires additional confirmation from other technical indicators.
Formation
This candlestick surfaces at the bottom of a downtrend or consolidation phase. A green hammer-like candle takes shape, with a small body (containing open and closed prices) and a long lower tail (or a deep low zone from which sellers were ousted to close higher). There shouldn't be any upper shadow, meaning the close price should be at or near the candle's high.
The long lower wick demonstrates that sellers pushed prices significantly lower, but buyers stepped in forcefully to drive prices back up.
Pattern Quality
A bullish Hammer is moderately reliable. However, it has the tendency to produce false signals and therefore should be taken with a pinch of salt, ideally confirmed with other indicators.
Preferred Time Frame
While we don't mind using a bullish Hammer in any timeframe, it can offer the best results when used with a weekly chart.
Bullish Harami
Definition
This is a two-candlestick pattern with a gradual reversal psychology, suggesting a potential shift from bearish to bullish sentiment.
Formation
The first candle should be a long bearish candle. The next one should be a green (bullish) candle. However, the first candle's real body should engulf that of the second candle. This "pregnancy" pattern (harami means "pregnant" in Japanese) suggests that bearish momentum is waning.
Pattern Quality
A bullish Harami is moderately strong. As the bearish candle is expected to be the larger one in the pattern, some false indications might emerge in more regulated markets like equities.
Preferred Time Frame
The best results from using this pattern come when you rely on daily and weekly charts.
Piercing Line
Definition
A Piercing Line pattern is essentially halfway to bullish engulfing. And it works best when it appears at the lowest point of a downtrend, signaling potential buying interest.
Formation
It is a two-candle pattern. The first candle is a long bearish one, and the second is a smaller bullish candle that opens below the first candle's low. It then moves higher to finish above the red candle's midpoint, demonstrating that buyers are beginning to assert control.
Pattern Quality
Traders consider it a strong reversal pattern, particularly when it appears after an extended downtrend.
Preferred Time Frame
This pattern works best when you have a daily chart pattern or a four-hour pattern at your disposal.
Bearish Reversal Candlesticks: Top Ones Explained
Three Black Crows
Definition
Three Black Crows is one of the more reliable bearish reversal candlestick patterns, signaling strong selling pressure and potential trend reversal from bullish to bearish.
Formation
This pattern surfaces when you see three consecutive red or bearish candles. Each candle through the last closes below the previous candle's close. The opening price of each candle should fall anywhere between the real body of the previous candles, barring the first one. This progression demonstrates sustained selling pressure.
Pattern Quality
This is one of the strongest and most reliable reversal candlestick patterns, offering high confidence when properly identified.
Preferred Time Frame
You are better off using this reversal pattern with daily and weekly charts for the most reliable signals.
Identical Three Crows
Definition
The overall interpretation of this pattern is nearly the same as Three Black Crows. Plus, it is also a three-candle pattern, primarily visible at the peak of an uptrend.
Formation
The formation comprises three red candles, each opening within the body of the previous one. This specific opening requirement adds to the pattern's reliability.
Pattern Quality
This pattern predicts a trend reversal more accurately than the Three Black Crows due to its more stringent formation requirements.
Preferred Time Frame
This pattern works best when used with daily candlestick charts.
Evening Star
Definition
The Evening Star pattern is simply the bearish counterpart of the Morning Star pattern. It showcases a potential reversal from the peak. Also, it is a three-candle pattern that signals weakening bullish momentum.
Formation
The first candle should be a long green or bullish candle. The next candle is a small gap-up formation, with a small body (green or red) and an open price higher than the previous pattern's close. Finally, the last red candle covers a significant portion of the first candle's real body, showing substantial selling pressure.
Pattern Quality
The Evening Star is extremely reliable, but it is always better to have a few confirmation candles for added validation.
Preferred Time Frame
Longer timeframes work better with Evening Star formations, particularly daily and weekly charts.
Evening Doji Star
Definition
This pattern is similar to an Evening Star, but as there is a Doji in play, the accuracy is on the higher side due to the clear indication of market indecision.
Formation
The first candle remains a green, long one. The second one should now be a gapped-up Doji. Finally, the third candle that shows up should be red and extend deep towards the real body of the green candle, confirming the bearish reversal.
Pattern Quality
This is one of the more reliable reversal candlestick patterns to date, combining the strength of the Evening Star with the clarity of a Doji.
Preferred Time Frame
This pattern is best suited for weekly charts or daily timeframes.
Shooting Star
Definition
This pattern is commonly seen across asset classes, including forex, stocks, commodities, and crypto. Also, this is a single candlestick pattern, like the bullish Hammer, but only in reverse.
Formation
A green or red body might form with a long upper shadow or wick. The meaning here is that buyers did attempt to push prices higher, helping the asset reach a new high. However, sellers prevailed, pushing prices back to opening levels. This rejection of higher prices suggests bearish control.
Pattern Quality
The Shooting Star is a moderately reliable pattern, particularly when it appears after a strong uptrend.
Preferred Time Frame
You can use this chart across any timeframe. But you get the most out of it on a weekly chart.
Dark Cloud Cover
Definition
The Dark Cloud Cover is a powerful trend reversal pattern that is very much like a bearish engulfing, signaling potential downside.
Formation
There should first be a long bullish candle, following which there should be a smaller bearish candle. This should open higher than the previous candle's high and close anywhere below the previous midpoint, demonstrating that sellers are overwhelming buyers.
Pattern Quality
The sell signal displayed by the Dark Cloud Cover is moderately strong, especially when accompanied by high volume.
Preferred Time Frame
The Dark Cloud Cover is one of the better reversal candlestick patterns to be used on a daily chart.
Hanging Man Candlestick
Definition
The color of the candle can be either red or green, but red feels more appropriate and bearish as we are discussing bearish reversal candlestick patterns.
Formation
A Hanging Man is like an inverted Hammer. The body is small, and there is a long lower wick and a short or negligible upper wick. This formation suggests that despite buyers' attempts to push prices higher, sellers managed to drag prices back down.
Pattern Quality
The Hanging Man is a relatively reliable pattern, provided it is located right at the peak of an uptrend.
Preferred Time Frame
We prefer using the Hanging Man candlestick on daily and even weekly charts.
Upside Gap Three Methods
Definition
If you are interested in credible continuation patterns that can also work as reversal candlestick patterns, the Upside Gap Three Methods is the one to consider. However, more than a trend reversal, the appearance of this pattern hints at short-term consolidation.
Formation
This three-candlestick pattern starts with a long green candle, is followed by another gap-up green candle, and eventually a bearish candle that drops more than 50% compared to the first candle's real body.
Pattern Quality
The Upside Gap Three Methods pattern is relatively strong as a consolidation signal.
Preferred Time Frame
This is one of the few candlestick patterns to work best with daily and weekly timeframes.
Abandoned Baby (Bearish)
Definition
This is a standard three-candle reversal pattern, seen primarily near the peak of an uptrend.
Formation
The first candle is a standard and green one (preferably long). The second candle should be a Doji, gapped up above the closing price of the first candle. The third candle should be a long, red one, opening preferably gap-down from the Doji. The gaps emphasize the dramatic shift in sentiment.
Pattern Quality
As an Abandoned Baby is rare, it is considered very strong and highly reliable.
Preferred Time Frame
You can best use this candlestick pattern on a daily and four-hour chart.
Belt Hold
Definition
This pattern follows several bullish trades and eventually signals a reversal or consolidation.
Formation
This is a one-candlestick pattern where a long red candle shows up with an opening price that is higher than the closing price of the previous green candle. The real body of the bearish candle should extend inside the real body of the previous candle.
Pattern Quality
The Belt Hold candlestick pattern isn't the most reliable and requires several confirmation candlesticks to make sense.
Preferred Time Frame
Daily timeframes work best for the Belt Hold candlestick patterns.
Are All Reversal Candlestick Patterns Reliable?
All reversal candlestick patterns possess varying degrees of reliability depending on the type of trades you want to initiate. For instance, patterns like Three White Soldiers, Abandoned Baby, and Three Black Crows are rarer, offer more candlestick-specific confirmations, and are fairly accurate if read correctly.
Similarly, single-candlestick formations like the Hanging Man, Hammer, and Shooting Star should be paired with indicators like RSI divergence, volume data, and chart patterns to show accurate results. Therefore, the reliability of candlestick patterns is subjective and depends on several factors:
- The location on the chart where they surface (support/resistance levels)
- The prevailing market conditions (trending vs. ranging)
- The timeframe being analyzed
- Confirmation from other technical indicators
- Volume accompanying the pattern formation
Traders should never rely solely on candlestick patterns but should use them as part of a comprehensive trading strategy that includes multiple confirmation signals.
Candlestick Patterns and Indicators Are a Winning Combination
Candlestick patterns are great analytical tools. But there is a way to make them even better. Simply identify the right candlestick formation, confirm it with a chart pattern like a triangle, wedge, or head and shoulders, and then validate your trading setup with indicators like RSI, MACD, OBV, or any other relevant indicator. Doing all that will help you get the best trading-specific results.
This multi-layered approach to technical analysis significantly reduces false signals and increases the probability of successful trades. For example:
- A bullish engulfing pattern at a support level, confirmed by RSI showing oversold conditions and increasing volume, provides a much stronger buy signal than the pattern alone.
- A shooting star at a resistance level, accompanied by bearish divergence on the MACD and declining volume, offers a more reliable sell signal.
By combining candlestick patterns with other technical tools, traders can develop a robust analytical framework that accounts for multiple market dimensions: price action, momentum, volume, and trend structure. This comprehensive approach is essential for consistent trading success in dynamic markets.
FAQ
What are reversal candlestick patterns and what is their role in technical analysis?
Reversal candlestick patterns are key formations that signal potential trend reversals in price action. They typically appear after downtrends, indicating buying pressure and possible trend shifts. Common patterns include hammers and shooting stars, helping traders identify optimal entry points for trend reversal trades.
What are the common types of reversal candlestick patterns, such as hammer, inverted hammer, and engulfing patterns?
Common reversal candlestick patterns include hammer, inverted hammer, engulfing patterns, harami, morning star, and evening star. These patterns typically signal potential trend reversals when they appear at market turning points.
How to correctly identify and confirm reversal candlestick patterns?
Identify reversal candlesticks by observing long wicks, small bodies, and specific formations like hammers or shooting stars. Confirm them using volume surge and subsequent price action breaking key levels.
How high is the trading success rate of reversal candlestick patterns?
Reversal candlestick patterns typically achieve a 40-60% success rate among professional traders, varying based on strategy, market conditions, and individual trading skills. Success rates depend on proper pattern recognition and risk management execution.
How to develop trading strategies and set stop-loss points using reversal candlestick patterns?
Enter trades when strong reversal signals appear and set stop-loss below the pattern's lowest point. Confirm with subsequent candles or technical indicators. Use patterns like hammer, shooting star, and engulfing for precise entries and exits. Combine with other indicators for better decision-making.
How effective is combining reversal candlestick patterns with other technical indicators?
Combining reversal candlestick patterns with other technical indicators significantly enhances reliability. While standalone patterns have limited effectiveness, integration with indicators like moving averages, RSI, or MACD provides stronger confirmation signals and improves accuracy for trend reversal identification.
What common mistakes do beginners make when identifying reversal candlestick patterns?
Beginners often ignore the preceding trend strength, misidentify patterns without confirming volume, and overlook multiple pattern confirmations. They typically focus only on the candlestick shape without considering broader market context, leading to premature trade entries and false signals.
What are the differences in reversal candlestick patterns across different timeframes (daily, weekly, monthly)?
Daily reversal patterns form quickly and signal short-term reversals, while weekly and monthly patterns develop slowly with greater significance. Larger timeframe reversals typically carry more weight in predicting sustained trend changes. Multi-timeframe confirmation strengthens reversal validity.
Share
Content
The Reversal Candle Pattern: What Is It and How Does It Work?
Key Differences Between Bullish and Bearish Reversal Candlestick Patterns
Ways to Identify Reversal Candle Patterns
Bullish Reversal Candlesticks: Top Ones Explained
Bearish Reversal Candlesticks: Top Ones Explained
Are All Reversal Candlestick Patterns Reliable?
Candlestick Patterns and Indicators Are a Winning Combination
FAQ
How to Buy Cryptocurrency


Trending Cryptocurrencies


How to Withdraw Money from Crypto Exchanges in 2025: A Beginner's Guide

Hedera Hashgraph (HBAR): Founders, Technology, and Price Outlook to 2030
Jasmy Coin: A Japanese Crypto Tale of Ambition, Hype, and Hope

IOTA (MIOTA) – From Tangle Origins to 2025 Price Outlook

Bitcoin Price in 2025: Analysis and Market Trends

How to Trade Bitcoin in 2025: A Beginner's Guide
Is Binamon (BMON) a good investment?: A Comprehensive Analysis of the Blockchain Gaming Token's Potential and Risks
Bitcoin Dominance: A Comprehensive Guide to Using BTC.D in Trading
Crypto Signals: What Are They and How To Use Them
What is mainnet (main network) in cryptocurrency, explained simply

What is Inflation? How Does It Affect Our Lives? Understanding the Impact on Your Purchasing Power