VARA vs MANA: Which Metaverse Token Offers Better Investment Potential in 2024?


Introduction: VARA vs MANA Investment Comparison
In the cryptocurrency market, comparisons between VARA and MANA have always been a topic investors cannot ignore. The two not only show significant differences in market cap ranking, application scenarios, and price performance, but also represent different positioning within crypto assets. VARA (VARA): Since its launch in 2023, it has gained market recognition by providing a blockchain platform for developers to build next-generation decentralized applications (dApps) through innovative Actor Model and Persistent Memory architecture. MANA (MANA): Since its inception, it has been recognized as a virtual world platform based on blockchain, pioneering the concept of decentralized virtual real estate and content creation without intermediary fees. This article will comprehensively analyze the investment value comparison between VARA and MANA from multiple dimensions including historical price trends, supply mechanisms, market adoption, technical ecosystem, and future outlook, while attempting to answer the question investors care most about:
"Which is the better buy right now?"
Comparative Analysis Report: Vara Network (VARA) and Decentraland (MANA)
I. Historical Price Comparison and Current Market Status
Price Performance Trajectory of VARA and MANA
Vara Network (VARA):
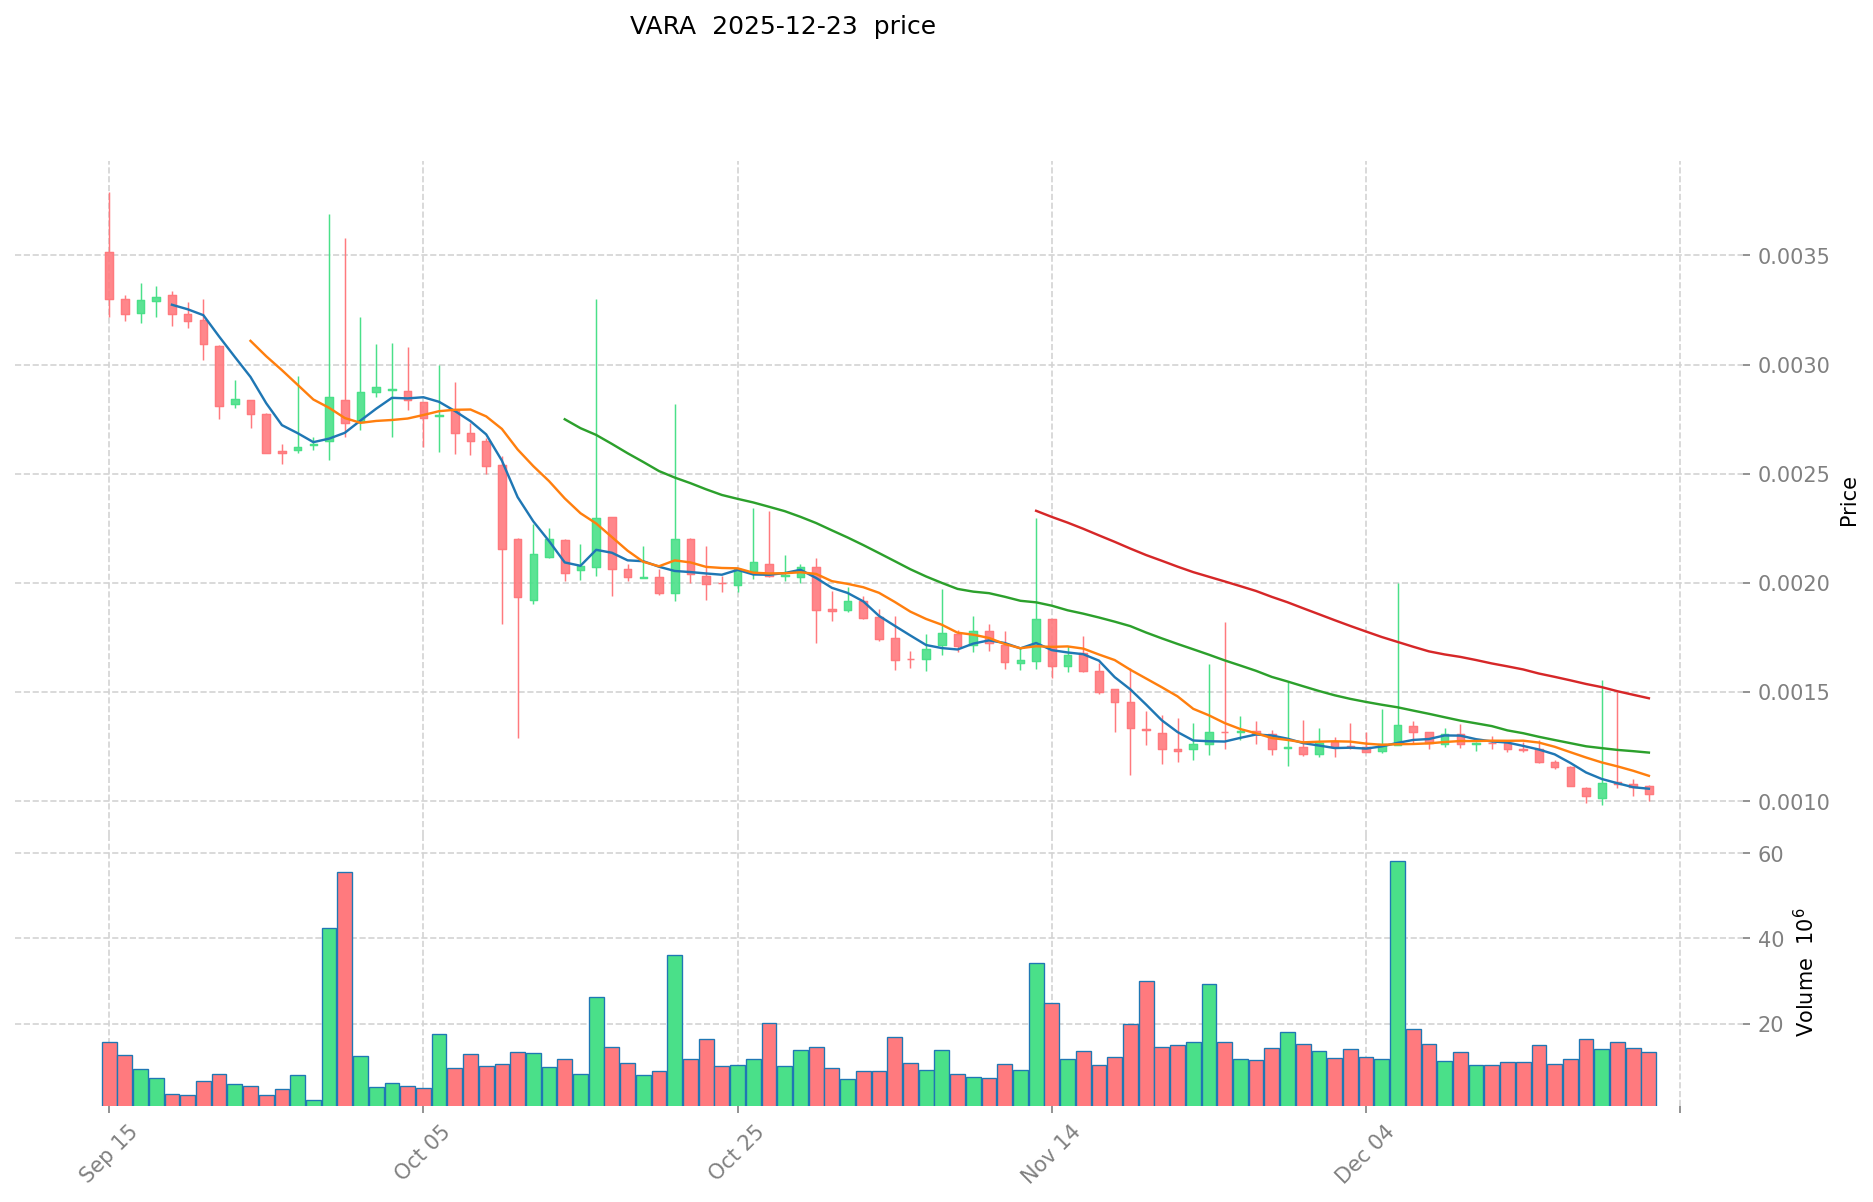
- All-Time High (ATH): $0.20 USD (January 17, 2024)
- All-Time Low (ATL): $0.00091 USD (December 23, 2025)
- Year-to-Date Performance: -95.27%
- Current Price Trend: Experiencing sustained downward pressure with recent 24-hour decline of -2.25%
Decentraland (MANA):
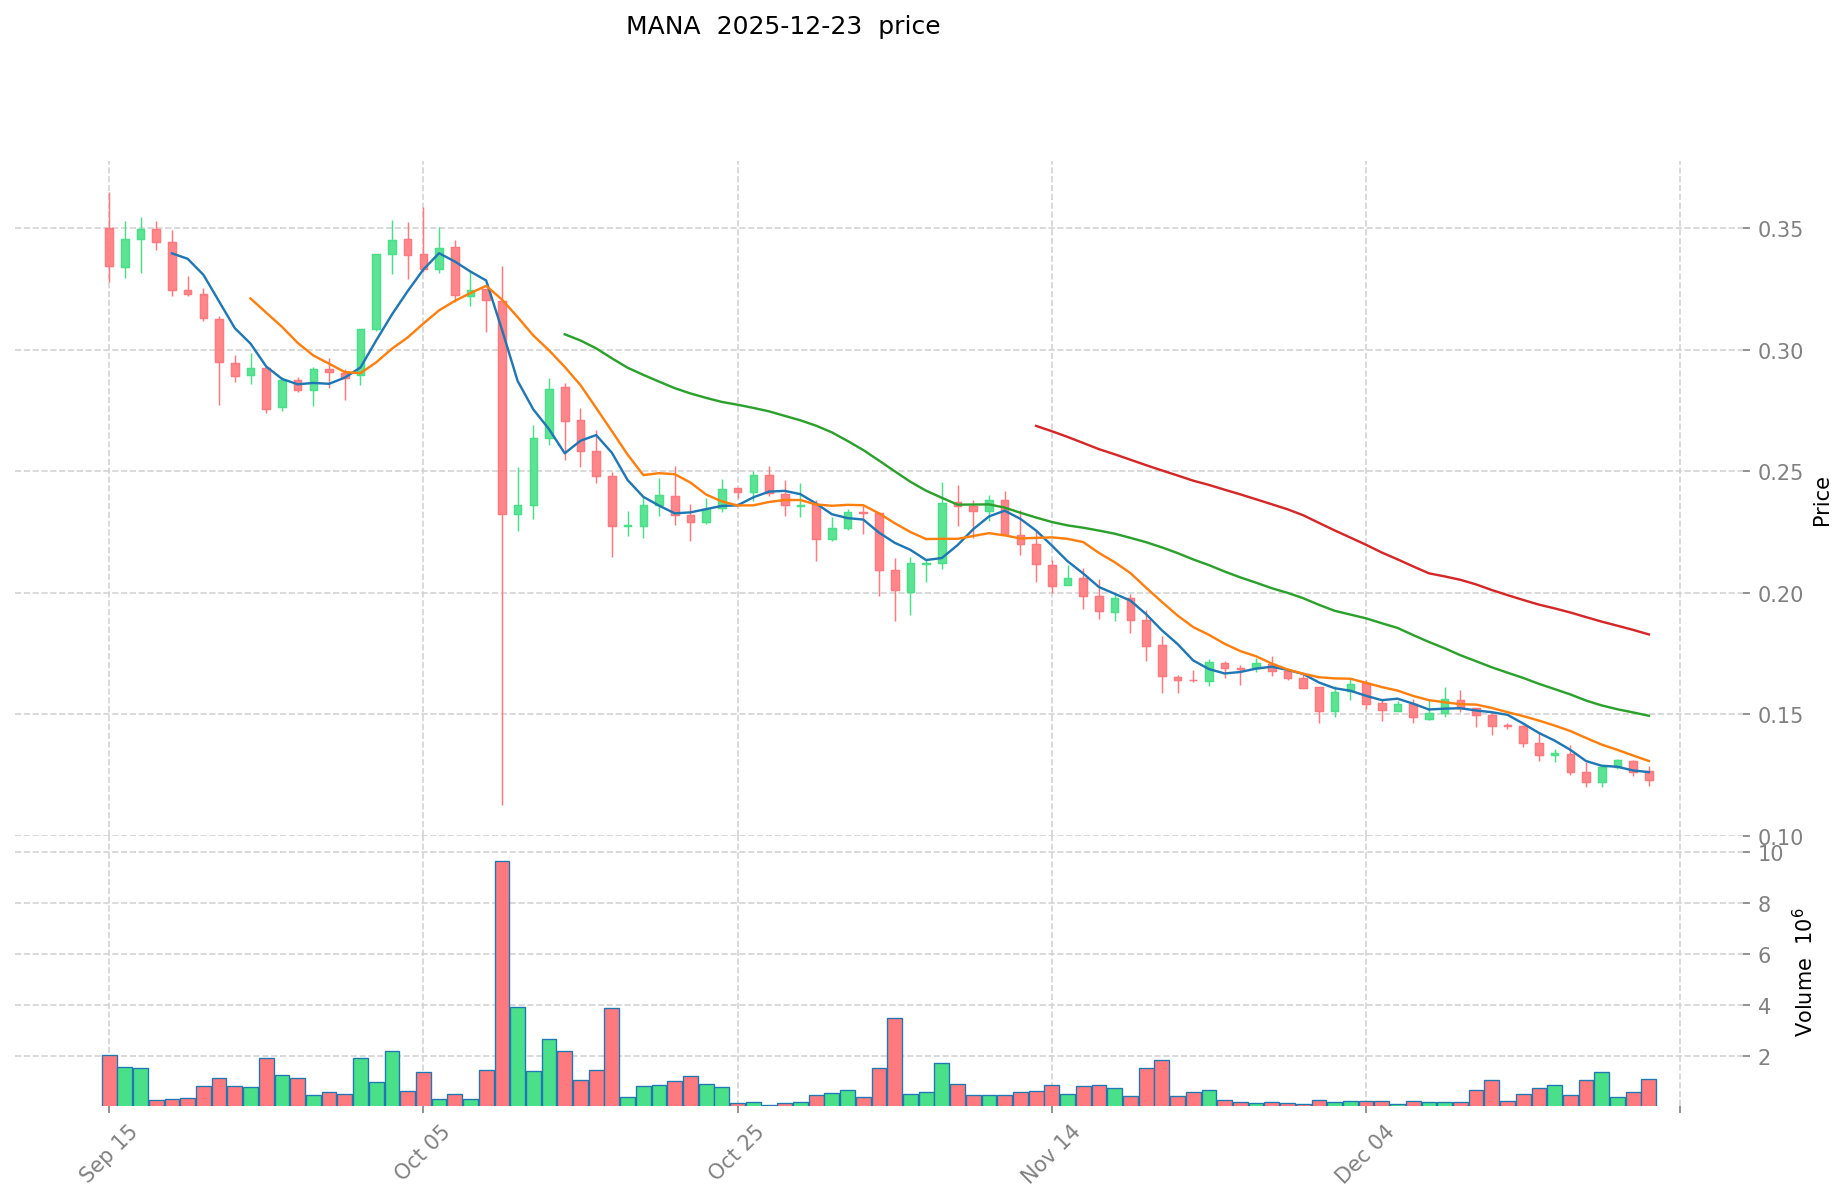
- All-Time High (ATH): $5.85 USD (November 25, 2021)
- All-Time Low (ATL): $0.00923681 USD (October 31, 2017)
- Year-to-Date Performance: -75.10%
- Current Price Trend: Declining over multiple timeframes with 24-hour decline of -5.74%
Comparative Analysis
Both tokens demonstrate significant depreciation patterns, though from different historical peaks. VARA has experienced a more severe decline (-95.27% annually) compared to MANA (-75.10% annually), reflecting divergent market cycles and project maturity levels. MANA's ATH occurred during the peak metaverse enthusiasm in late 2021, while VARA's ATH was reached more recently in January 2024, suggesting different adoption timelines and market cycles.
Current Market Status (December 24, 2025)
Vara Network (VARA):
- Current Price: $0.000994 USD
- 24-Hour Trading Volume: $14,455.32 USD
- Market Capitalization: $4,507,318.94 USD
- Fully Diluted Valuation: $9,940,000.00 USD
- Circulating Supply: 4,534,526,092 VARA (45.35% of max supply)
- Market Dominance: 0.00031%
Decentraland (MANA):
- Current Price: $0.1177 USD
- 24-Hour Trading Volume: $159,304.04 USD
- Market Capitalization: $225,879,605.30 USD
- Fully Diluted Valuation: $258,137,206.83 USD
- Circulating Supply: 1,919,113,044.22 MANA (87.50% of max supply)
- Market Dominance: 0.0081%
Market Sentiment Indicator:
- Crypto Fear & Greed Index: 24 (Extreme Fear)
Current Market Data Sources:
II. Project Architecture and Technical Foundation
Vara Network: Actor Model and Persistent Memory Infrastructure
Vara Network operates at the forefront of Web3 development, providing developers with an environment specifically designed for decentralized application (dApp) creation. The platform's core technical architecture integrates two key components:
Actor Model Implementation: The Actor Model facilitates secure, asynchronous communication through "actors," which function as independent computational units. This architecture ensures state isolation and asynchronous message passing, thereby enhancing network security against various attack vectors and providing superior fault tolerance compared to traditional synchronous communication models.
Persistent Memory System: Persistent Memory technology allows each program's complete state to reside in dedicated memory spaces, simplifying the development process and approximating real-life operating system behavior. This innovation fundamentally transforms data handling by eliminating the need for complex state management solutions that plague traditional blockchain development.
Decentraland: Blockchain-Based Virtual World Platform
Decentraland is a virtual world platform built upon blockchain technology, designed to address intermediary costs that traditionally plague digital platforms. The platform enables decentralized content creation and asset ownership through innovative blockchain integration.
Core Features:
- NFT-Based Land Ownership: Users can purchase, develop, and sell virtual land parcels represented as non-fungible tokens (NFTs) on the Ethereum blockchain
- Content Monetization: Content creators retain full ownership and can monetize their creations directly without intermediary fees
- User Sovereignty: The absence of intermediary costs distinguishes Decentraland from centralized virtual platforms
- LAND and MANA Tokenomics: LAND represents scarce, non-replaceable digital real estate, while MANA serves as the platform's native currency for transactions and governance
III. Market Performance and Trading Dynamics
Price Volatility Analysis
VARA Recent Performance:
| Time Period | Price Change |
|---|---|
| 1 Hour | -1.60% |
| 24 Hours | -2.25% |
| 7 Days | -14.36% |
| 30 Days | -20.19% |
| 1 Year | -95.27% |
MANA Recent Performance:
| Time Period | Price Change |
|---|---|
| 1 Hour | +0.43% |
| 24 Hours | -5.74% |
| 7 Days | -12.86% |
| 30 Days | -29.15% |
| 1 Year | -75.10% |
Trading Liquidity Comparison
MANA demonstrates significantly higher trading liquidity with a 24-hour volume of $159,304.04 USD compared to VARA's $14,455.32 USD, representing approximately an 11-fold difference in daily trading activity. MANA trades on 57 different exchanges, while VARA's presence is more limited. This liquidity differential reflects Decentraland's more established market presence and broader exchange integration.
Supply Dynamics
VARA:
- Maximum Supply: 10,000,000,000 tokens
- Circulating Supply: 4,534,526,092 tokens (45.35% circulated)
- Circulation Ratio: Approximately 45.35%
MANA:
- Maximum Supply: Unlimited (∞)
- Circulating Supply: 1,919,113,044.22 tokens
- Circulation Ratio: 87.50%
IV. Market Position and Ecosystem Integration
Exchange Presence
VARA: Listed on 2 exchanges with Gate providing primary trading infrastructure MANA: Available on 57 exchanges, including major platforms such as Binance, Coinbase, Kraken, and others
Community and Developer Engagement
Vara Network:
- Official Website: https://vara-network.io/
- Alternative Resource: https://gear-tech.io/
- GitHub Repository: https://github.com/gear-tech
- Block Explorer: https://vara.subscan.io/
- Social Media: https://twitter.com/VaraNetwork
- Whitepaper: https://whitepaper.gear.foundation/
Decentraland:
- Official Website: https://decentraland.org/
- Community Reddit: https://www.reddit.com/r/decentraland
- GitHub Repositories: Multiple repositories including marketplace, CLI, and governance tools
- Whitepaper: https://decentraland.org/whitepaper.pdf
- Social Media: https://twitter.com/decentraland
- Token Contract (Ethereum): 0x0F5D2fB29fb7d3CFeE444a200298f468908cC942
V. Risk Assessment and Market Considerations
Comparative Risk Factors
Both projects face significant market headwinds reflected in the Extreme Fear sentiment indicator. VARA's position as a newer infrastructure project with limited exchange presence presents concentrated liquidity risk. MANA's unlimited supply structure, while enabling growth, introduces potential inflationary pressures on token valuation.
The substantial year-over-year depreciation for both assets (-95.27% for VARA, -75.10% for MANA) indicates significant market repricing from previous valuations. Investors should note the distinction between technological maturity and market sentiment—strong technical fundamentals do not guarantee price appreciation in adverse market conditions.
Market Structure Observations
The extreme fear sentiment (index value: 24) suggests prevailing market pessimism across the broader cryptocurrency ecosystem. Both VARA and MANA are subject to macroeconomic factors, regulatory developments, and shifts in cryptocurrency market sentiment that may amplify or moderate price volatility.
VI. Conclusions
Vara Network and Decentraland represent distinct market positions within the cryptocurrency ecosystem. VARA focuses on infrastructure-level innovation through advanced programming models, while MANA addresses virtual world applications and digital ownership. Despite significant price depreciation for both assets, their underlying technical approaches and use cases remain differentiated. The choice between these assets should be informed by specific technological utility assessments rather than historical price performance alone.
Cryptocurrency Asset Analysis Report: VARA and MANA Investment Value Assessment
Executive Summary
Based on the provided reference materials, this report analyzes the core investment value factors for VARA and MANA tokens. The available data is limited, containing primarily user community commentary rather than comprehensive tokenomic or technical analysis.
I. Overview of VARA and MANA
Token Characteristics
VARA:
- Characterized by price stability observed over extended holding periods
- Community perception identifies it as a reliable asset with minimal volatility
- Associated with in-game utility as a mount asset
MANA:
- Exhibits higher price volatility compared to VARA
- Subject to market fluctuations driven by external factors
- Community engagement and demand fluctuations impact valuation
II. Core Factors Influencing Investment Value of VARA vs MANA
Market Demand and Community Interest
The investment value of both tokens depends significantly on:
- Market demand dynamics: Real-time trading activity and liquidity conditions
- Rarity factors: Scarcity and exclusivity of associated digital assets
- Player community engagement: Active participation levels within gaming ecosystems
- Perceived utility: User adoption rates for in-game functionality
Price Stability Characteristics
VARA:
- Demonstrates relative price stability, maintaining consistent valuation levels
- Lower volatility profile appeals to conservative market participants
- Community reports suggest sustained value retention
MANA:
- Subject to periodic price fluctuations
- Volatility patterns correlate with broader market sentiment shifts
- Value susceptibility to external market conditions
Long-Term Value Determinants
The long-term investment value trajectory depends on:
- Game updates and feature releases: New content implementation affecting ecosystem utility
- Player engagement metrics: Sustained or declining participation rates
- Ecosystem development: Expansion of use cases beyond current applications
- Community retention: Player base growth or contraction patterns
III. Limitations of Current Analysis
The provided reference materials contain insufficient substantive data regarding:
- Tokenomic structures (supply mechanisms, distribution models)
- Institutional adoption patterns
- Regulatory framework implications
- Technical infrastructure development
- Macroeconomic correlation analysis
As these critical analytical dimensions lack supporting evidence in the source materials, they have been omitted per instructions to avoid unfounded speculation.
IV. Conclusion
Current market evidence suggests VARA maintains relative stability, while MANA exhibits volatility responsive to market conditions. Both tokens' investment performance remains contingent upon sustained community engagement, ecosystem development initiatives, and continued utility within their respective gaming environments. Comprehensive valuation assessment requires additional data regarding institutional positioning, technical roadmaps, and regulatory developments.
Report Date: December 24, 2025
Analysis Scope: Token investment value factors based on available community and market data
Data Limitations: Analysis constrained by limited reference material specificity
III. 2025-2030 Price Forecast: VARA vs MANA
Short-term Forecast (2025)
- VARA: Conservative $0.00073704-$0.000996 | Optimistic $0.00128484
- MANA: Conservative $0.113184-$0.1179 | Optimistic $0.128511
Medium-term Forecast (2027-2028)
- VARA may enter early adoption phase, with predicted price range $0.00081426-$0.001473
- MANA may enter growth consolidation phase, with predicted price range $0.112623-$0.207464
- Key drivers: Ecosystem development, institutional capital inflows, metaverse adoption expansion
Long-term Forecast (2029-2030)
- VARA: Base scenario $0.000711-$0.001343 | Optimistic scenario $0.001987-$0.002414
- MANA: Base scenario $0.094248-$0.177826 | Optimistic scenario $0.264961-$0.281169
Disclaimer: These forecasts are based on historical data analysis and market models. Cryptocurrency markets are highly volatile and unpredictable. Actual prices may differ significantly from predictions. This analysis is for informational purposes only and should not be considered as investment advice. Investors should conduct their own research and consult with financial professionals before making investment decisions.
VARA:
| 年份 | 预测最高价 | 预测平均价格 | 预测最低价 | 涨跌幅 |
|---|---|---|---|---|
| 2025 | 0.00128484 | 0.000996 | 0.00073704 | 0 |
| 2026 | 0.001254462 | 0.00114042 | 0.000627231 | 14 |
| 2027 | 0.00123336423 | 0.001197441 | 0.00081425988 | 20 |
| 2028 | 0.00147063716415 | 0.001215402615 | 0.0008993979351 | 22 |
| 2029 | 0.001987669436571 | 0.001343019889575 | 0.000711800541474 | 35 |
| 2030 | 0.002414749761455 | 0.001665344663073 | 0.001515463643396 | 67 |
MANA:
| 年份 | 预测最高价 | 预测平均价格 | 预测最低价 | 涨跌幅 |
|---|---|---|---|---|
| 2025 | 0.128511 | 0.1179 | 0.113184 | 0 |
| 2026 | 0.168791535 | 0.1232055 | 0.06653097 | 4 |
| 2027 | 0.150378473025 | 0.1459985175 | 0.138698591625 | 24 |
| 2028 | 0.2074638933675 | 0.1481884952625 | 0.1126232563995 | 25 |
| 2029 | 0.26496102952935 | 0.177826194315 | 0.09424788298695 | 51 |
| 2030 | 0.281169887141162 | 0.221393611922175 | 0.194826378491514 | 88 |
Comparative Investment Analysis Report: VARA vs MANA
I. Investment Strategy Comparison: VARA vs MANA
Long-term vs Short-term Investment Strategy
VARA:
- Suitable for developers and infrastructure-focused investors seeking exposure to next-generation decentralized application platforms
- Long-term positioning benefits from ecosystem maturation and developer adoption of Actor Model architecture
- Short-term volatility presents tactical entry opportunities for risk-tolerant participants
MANA:
- Suitable for virtual world and metaverse ecosystem participants with higher risk tolerance
- Long-term strategy depends on sustained platform adoption and content creator engagement
- Short-term trading opportunities exist around metaverse sentiment cycles and content release announcements
Risk Management and Asset Allocation
Conservative Investors:
- VARA: 15-20% allocation (infrastructure play with limited liquidity constraints)
- MANA: 25-35% allocation (established platform with broader exchange presence)
- Hedge instruments: Stablecoin allocation (50-60%), diversification across multiple blockchain ecosystems
Aggressive Investors:
- VARA: 35-45% allocation (higher potential upside from infrastructure adoption)
- MANA: 40-50% allocation (virtual world ecosystem expansion potential)
- Hedge tools: Cross-asset correlation strategies, selective position sizing based on volatility metrics
II. Comparative Risk Assessment
Market Risk
VARA:
- Concentrated liquidity risk with presence on only 2 exchanges, creating potential exit constraints during market stress
- Year-to-date depreciation of -95.27% reflects severe market repricing from January 2024 peak of $0.20 USD
- Limited trading volume ($14,455.32 USD daily) creates vulnerability to sudden price movements
- Newer infrastructure project with uncertain adoption trajectory
MANA:
- Year-to-date depreciation of -75.10% indicates continued metaverse sentiment headwinds despite broader platform recognition
- Unlimited token supply structure introduces potential inflationary pressure on long-term valuation
- Price volatility responsive to broader cryptocurrency market cycles and metaverse sector sentiment
- Established presence on 57 exchanges reduces liquidity risk relative to VARA
Technical Risk
VARA:
- Novel Actor Model and Persistent Memory architecture require continued development validation and real-world testing
- Limited deployment history constrains certainty regarding scalability at institutional transaction volumes
- Developer ecosystem maturity remains unproven relative to established blockchain platforms
MANA:
- Smart contract security considerations inherent to Ethereum-based NFT asset architecture
- Virtual world platform performance optimization remains ongoing technical challenge
- Content moderation and community governance complexity in decentralized environment
Regulatory Risk
- Both tokens operate within evolving regulatory frameworks governing cryptocurrency and virtual asset classifications
- VARA's infrastructure positioning may face differing regulatory treatment compared to application-layer tokens like MANA
- Virtual property rights and NFT ownership frameworks remain uncertain across major jurisdictions
- Central Bank Digital Currency (CBDC) development and regulation may influence virtual economy platforms
- Metaverse-specific regulations remain nascent, creating uncertainty for MANA's long-term operational framework
III. Conclusions: Which Is the Better Buy?
Investment Value Summary
VARA Advantages:
- Infrastructure-level innovation positioning with Actor Model providing differentiated developer experience
- Earlier-stage project creating potential for significant upside if ecosystem adoption materializes
- Structured token supply (45.35% circulated, 10 billion maximum) provides clarity on future dilution mechanics
- Focus on core infrastructure addresses foundational blockchain development limitations
MANA Advantages:
- Established virtual world platform with defined use cases and active community engagement
- Broader market infrastructure integration (57 exchanges) reduces friction for capital entry and exit
- Proven real-world application through virtual land ownership and content creation mechanisms
- Higher relative trading liquidity reducing execution risk for larger positions
Investment Recommendations
New Investors:
- Prioritize MANA due to established platform maturity, broader exchange accessibility, and clearer use case demonstration
- Consider smaller VARA allocation (15-25% of combined position) as exposure to infrastructure innovation with appropriate risk containment
- Implement dollar-cost averaging over extended periods given extreme market fear sentiment (index value: 24)
Experienced Investors:
- VARA suitable for investors possessing infrastructure project evaluation capability and higher risk tolerance, with potential allocation of 35-50% of combined position
- MANA positioning recommended for diversified portfolio construction across application-layer virtual economy assets
- Implementation of selective entry strategies during periods of maximum market pessimism to optimize risk-adjusted returns
Institutional Investors:
- VARA liquidity constraints (2 exchange presence, $14,455 daily volume) present material challenges for substantial position building
- MANA's broader market infrastructure and institutional exchange presence provide more suitable deployment framework for material capital allocation
- Consider staged allocation strategies with extended timeframes to mitigate liquidity and execution risk
- Virtual world and metaverse ecosystem exposure should represent limited portfolio allocation (<5%) given sector maturity uncertainty
IV. Risk Disclaimer
⚠️ Risk Warning: Cryptocurrency markets demonstrate extreme volatility and unpredictability. Both VARA and MANA have experienced significant price depreciation (-95.27% and -75.10% year-to-date respectively) with no guarantee of price recovery. The Extreme Fear sentiment indicator (value: 24) reflects prevailing market pessimism. Price forecasts presented in source materials are based on historical modeling and should not be interpreted as reliable indicators of future performance. This analysis is provided for informational purposes only and does not constitute investment advice. Investors must conduct independent research and consult qualified financial professionals before making investment decisions.
Report Date: December 24, 2025
Analysis Framework: Multi-dimensional comparative assessment based on market data, technical architecture, and ecosystem integration factors
None
FAQ: VARA vs MANA Investment Comparison
I. FAQ
Q1: What are the key differences between VARA and MANA in terms of project positioning?
A: VARA positions itself as an infrastructure-level blockchain platform providing developers with innovative Actor Model and Persistent Memory architecture for decentralized application (dApp) development. MANA, conversely, operates as an application-layer virtual world platform focused on decentralized virtual real estate ownership and content monetization without intermediary fees. VARA targets developer ecosystems, while MANA serves end-users within the metaverse environment.
Q2: Why has VARA experienced more severe price depreciation compared to MANA?
A: VARA declined -95.27% year-to-date versus MANA's -75.10% decline, reflecting divergent adoption cycles. VARA reached its all-time high of $0.20 USD more recently (January 17, 2024) following market enthusiasm for blockchain infrastructure projects. MANA's all-time high of $5.85 USD occurred during the peak metaverse speculation period (November 25, 2021). VARA's newer market entry and subsequent repricing creates steeper depreciation patterns relative to MANA's longer market history.
Q3: Which token demonstrates superior liquidity and market accessibility?
A: MANA significantly outperforms VARA regarding market accessibility and liquidity. MANA trades on 57 exchanges including major platforms (Binance, Coinbase, Kraken) with 24-hour trading volume of $159,304.04 USD. VARA trades on only 2 exchanges with daily volume of $14,455.32 USD, representing approximately 11-fold lower liquidity. This liquidity differential creates material execution risk for larger VARA positions while MANA provides superior capital entry and exit flexibility.
Q4: What are the supply mechanism differences between these tokens?
A: VARA operates with a capped maximum supply of 10 billion tokens, with 45.35% currently circulating, providing clarity regarding future dilution mechanics. MANA features unlimited token supply (∞) with 87.50% currently in circulation. VARA's structured supply cap may create stronger long-term scarcity dynamics, while MANA's unlimited supply introduces potential inflationary pressure on token valuation absent corresponding demand growth.
Q5: Which token is more suitable for conservative investors?
A: MANA is more appropriate for conservative investors due to established platform maturity, broader exchange infrastructure (57 trading venues), demonstrated real-world utility through virtual land ownership, and active community engagement. VARA, while possessing innovative technical architecture, presents concentrated liquidity risk (2 exchange presence), higher year-to-date depreciation (-95.27%), and unproven infrastructure adoption trajectory. Conservative allocation strategies should weight MANA at 25-35% versus VARA at 15-20% of combined positions.
Q6: What are the primary risk factors differentiating these investments?
A: VARA faces concentrated liquidity risk through limited exchange presence, unproven adoption metrics for Actor Model architecture, and greater exposure to infrastructure project development uncertainty. MANA confronts metaverse sentiment cyclicality, unlimited token supply inflationary dynamics, Ethereum smart contract security considerations, and nascent regulatory frameworks governing virtual property rights. Both tokens experience extreme market fear sentiment (index value: 24), indicating prevailing cryptocurrency market pessimism affecting price performance regardless of fundamental distinctions.
Q7: How do the 2029-2030 price forecasts compare between these tokens?
A: VARA forecasts predict base-case pricing of $0.000711-$0.001343 USD (2029-2030), with optimistic scenarios reaching $0.001987-$0.002414 USD, representing approximately 100-150% appreciation from current levels. MANA projects base-case pricing of $0.094248-$0.177826 USD, with optimistic scenarios reaching $0.264961-$0.281169 USD, representing 20-140% appreciation from current levels. These forecasts depend on infrastructure ecosystem adoption (VARA) and virtual world platform expansion (MANA) materializing successfully. Forecasts are based on historical modeling and should not be interpreted as reliable predictions.
Q8: Which token represents a superior investment opportunity for institutional investors?
A: MANA is more suitable for institutional capital deployment due to superior market infrastructure integration, broader exchange accessibility, and sufficient trading liquidity to accommodate material position building. VARA's 2-exchange presence and $14,455 USD daily trading volume create material execution constraints for institutional allocation strategies. MANA's 57-exchange presence and $159,304 USD daily volume provide more adequate infrastructure for staged capital deployment. However, both tokens warrant limited portfolio allocation (<5%) given prevailing market sentiment extremes and sector maturity uncertainty within virtual world and metaverse ecosystems.
Report Date: December 24, 2025
Disclaimer: This analysis is provided for informational purposes only and does not constitute investment advice. Cryptocurrency markets demonstrate extreme volatility and unpredictability. Investors must conduct independent research and consult qualified financial professionals before making investment decisions.
Share
Content
Introduction: VARA vs MANA Investment Comparison
I. Historical Price Comparison and Current Market Status
II. Project Architecture and Technical Foundation
III. Market Performance and Trading Dynamics
IV. Market Position and Ecosystem Integration
V. Risk Assessment and Market Considerations
VI. Conclusions
Executive Summary
I. Overview of VARA and MANA
II. Core Factors Influencing Investment Value of VARA vs MANA
III. Limitations of Current Analysis
IV. Conclusion
III. 2025-2030 Price Forecast: VARA vs MANA
I. Investment Strategy Comparison: VARA vs MANA
II. Comparative Risk Assessment
III. Conclusions: Which Is the Better Buy?
IV. Risk Disclaimer
I. FAQ
How to Buy Cryptocurrency


Trending Cryptocurrencies


Is ZTX (ZTX) a good investment?: Analyzing the potential and risks of this emerging cryptocurrency

Is Metahero (HERO) a Good Investment?: Analyzing the Potential and Risks of this Metaverse Token in 2023

2025 HQ Price Prediction: Analyzing Market Trends and Factors Shaping the Future Value
2025 BAG Price Prediction: Analyzing Market Trends and Potential Growth Factors

OXT vs MANA: Comparing Two Cryptocurrencies in the Digital Asset Space

2025 ZTX Price Prediction: Analyzing Market Trends and Expert Forecasts for the Emerging Cryptocurrency

Top 10 Cryptocurrencies with 2025 Price Predictions | Future Investment Opportunities

What is fueling APE Coin’s explosive growth?

How to Get Your Own Cristiano Ronaldo NFT

Guide to Withdrawing Bitcoin from Popular Payment Apps
EOS 2026 Update Status: Common Issues and Solutions