This comprehensive guide explores Fibonacci Retracement as a powerful technical analysis tool for cryptocurrency traders. Discover the mathematical foundations behind the Fibonacci sequence, the Golden Ratio (1.618), and its natural applications in predicting support and resistance levels on Gate trading charts. Learn how to identify swing highs and swing lows, draw accurate Fibonacci lines at key levels (23.6%, 38.2%, 50%, 61.8%, 78.6%), and integrate this tool with other indicators like MACD and moving averages for enhanced trading accuracy. Master practical strategies for Bitcoin and altcoin trading while understanding critical limitations: the tool requires clear trends, larger liquid markets provide reliable signals, and proper risk management remains essential. Whether you're setting stop-loss orders or identifying profit targets, this guide equips traders with actionable techniques to improve entry and exit points across all timeframes.
What is Fibonacci?
Fibonacci, often abbreviated as Fibo, refers to a natural numerical proportion discovered in nature where, after 0 and 1, every subsequent number is the sum of the two preceding numbers in an infinite sequence. This mathematical concept has been widely adopted in modern financial analysis to predict and analyze the price movements of various assets, including cryptocurrencies.
In contemporary trading, when traders think about tools to assist in cryptocurrency trading, the Fibonacci Retracement Level inevitably comes to mind. It has become one of the most popular and effective tools that enables traders to analyze and forecast the directional movements of crypto prices with remarkable accuracy. This article will explore the origins of Fibonacci, its mathematical foundations, and how traders can leverage this powerful tool in their trading strategies.
The Fibonacci sequence represents a fundamental pattern found throughout nature, from the spiral of seashells to the arrangement of flower petals. When applied to financial markets, this natural proportion reveals hidden support and resistance levels that can help traders make more informed decisions about entry and exit points in their trades.
The Fibonacci Number Sequence
The Italian mathematician Leonardo Bigollo Pisano, commonly known as Leonardo Fibonacci, is credited with popularizing the number sequence that bears his name: the Fibonacci Sequence or Fibonacci Number. Through his observations of natural patterns and mathematical relationships, Fibonacci discovered a sequence that has profound implications for understanding proportions in both nature and financial markets.
According to the theory, the Fibonacci Number is a sequence of integers that follows this pattern:
0, 1, 1, 2, 3, 5, 8, 13, 21, 34, 55, 89, 144, 233, 377, 610, 987, 1597, 2584, …
The sequence begins with 0 and 1, and each subsequent number is the sum of the two preceding numbers. This creates an infinite progression that can be calculated as follows:
- 0 + 1 = 1 (resulting in: 0, 1, 1)
- 1 + 1 = 2 (resulting in: 0, 1, 1, 2)
- 1 + 2 = 3 (resulting in: 0, 1, 1, 2, 3)
- 2 + 3 = 5 (resulting in: 0, 1, 1, 2, 3, 5)
- 3 + 5 = 8 (resulting in: 0, 1, 1, 2, 3, 5, 8)
This pattern continues infinitely, creating an endless sequence of numbers. What makes this sequence truly remarkable is the mathematical relationships that emerge when we analyze the ratios between these numbers.
When we divide larger numbers in the sequence by their immediate predecessors, fascinating patterns emerge. For example, 21 ÷ 13 = 1.625, and as we move further along the sequence, such as 144 ÷ 89 = 1.618, we find that the ratio approaches a constant value. The further we progress in the sequence, the closer this ratio gets to 1.618, a number that mathematicians and traders know as the Golden Ratio.
The Golden Ratio equals 1.618
This Golden Ratio appears repeatedly in nature, art, architecture, and remarkably, in financial markets, making it an invaluable tool for technical analysis.
How Does Fibonacci Relate to Cryptocurrency and Trading?
After the Fibonacci Sequence gained widespread recognition, researchers began studying the mathematical relationships within these numbers and discovered the emergence of the 61.8% ratio, commonly referred to as the Golden Ratio. This proportion can be observed throughout nature, from the spiral patterns of galaxies to the structure of DNA molecules.
More significantly for traders, these proportions have been found to manifest in human financial markets as well. Market analysts observed that price movements typically experience retracements of approximately 61.8% after completing a 100% price movement. This discovery led to the development of the Fibonacci Retracement Level tool, which has become an essential component of technical analysis.
The application of Fibonacci to trading is based on the principle that markets move in waves, similar to natural phenomena. Just as ocean waves follow predictable patterns of advance and retreat, financial markets exhibit similar rhythmic movements. By identifying key Fibonacci levels, traders can anticipate where prices are likely to find support during pullbacks in uptrends or resistance during rallies in downtrends.
This connection between natural mathematical proportions and market behavior provides traders with a framework for understanding price action that transcends individual markets or time periods, making Fibonacci analysis applicable across various asset classes, including cryptocurrencies.
What is Fibonacci Retracement and How to Draw Fibo Lines?
Fibonacci Retracement is a technical analysis tool that helps identify hidden support and resistance levels where asset prices are likely to reverse direction. The primary levels used in Fibonacci Retracement are 23.6%, 38.2%, 50.00%, 61.8%, and 78.6%. These percentages represent potential areas where price corrections may pause or reverse during a trending market.
But where do these specific numbers come from? The calculation of these levels is derived from the mathematical relationships within the Fibonacci sequence:
The key levels are calculated by dividing numbers in the Fibonacci sequence by numbers that are 1, 2, or 3 positions higher in the sequence. The results are then converted into percentages:
- 0.618 = 61.8% (derived from dividing any number by the next number in the sequence)
- 0.382 = 38.2% (derived from dividing any number by the number two positions higher)
- 0.236 = 23.6% (derived from dividing any number by the number three positions higher)
The 78.6% level (0.786) is another important level, calculated as the square root of 0.618, representing a deeper retracement level that often acts as a last line of defense before a trend reversal.
The 50.00% level, while not directly derived from the Fibonacci sequence, is included because it represents a psychologically significant midpoint and often serves as a key support or resistance level according to other technical analysis theories. This level is particularly important in cryptocurrency markets, where round numbers often attract significant trading activity.
Using the Fibonacci Retracement tool is relatively straightforward, but requires practice and understanding of market structure. To apply this tool effectively, you need to identify two key points: the Swing Low (the lowest point in a price movement) and the Swing High (the highest point in a price movement).
Let's examine a practical example: In the illustration, we identify point A as the Swing Low and point B as the Swing High. To create the Fibonacci Retracement levels, we use the Fibonacci tool to draw a line from point A to point B (or to the same level as point B). This action generates the Fibonacci Retracement levels, which are displayed as horizontal lines on the chart with their corresponding values shown on the left side: 0.236, 0.382, 0.5, 0.618, 0.786, and 1.
In this Bitcoin (BTC) example, we can clearly observe that when the price declined and approached the 0.618 level, it bounced back upward. This demonstrates the theoretical principle that asset prices tend to reverse at significant Fibonacci Retracement levels.
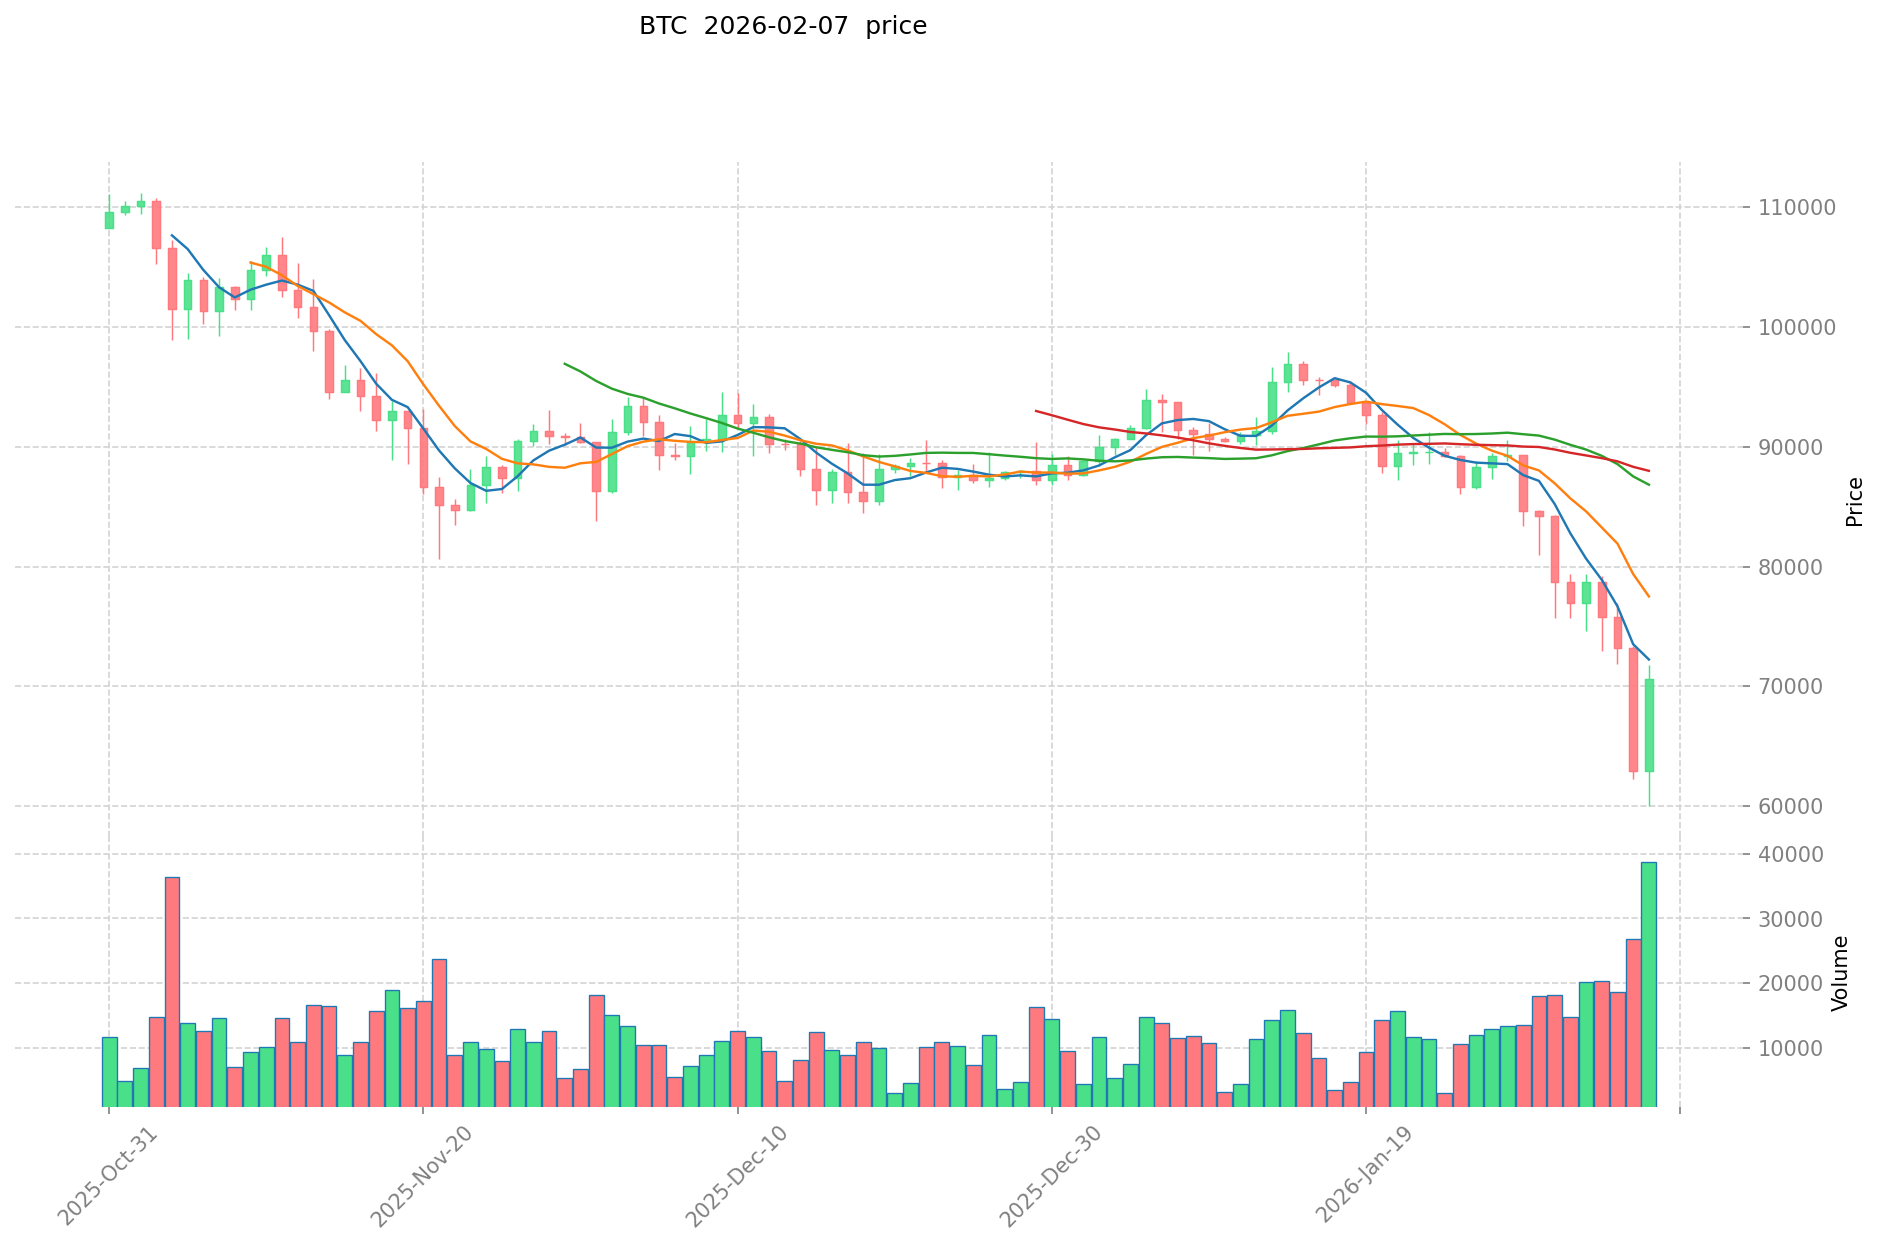 The 0.618 level, being the Golden Ratio, often acts as a strong support level in uptrends or resistance level in downtrends.
The Fibonacci Retracement tool can be applied in both bull and bear markets. In an uptrend, you draw the line from the lowest point to the highest point, identifying potential support levels where the price might bounce during a pullback. Conversely, in a downtrend, you draw the line from the highest point to the lowest point, identifying potential resistance levels where the price might face selling pressure during a rally.
Traders often use these levels to set entry points for trades, place stop-loss orders, or identify profit-taking targets. The key is to wait for price confirmation at these levels, such as candlestick patterns or volume spikes, before making trading decisions.
Techniques for Using Fibonacci Retracement Effectively
While Fibonacci Retracement is an excellent tool for forecasting price movements, there are several important considerations and limitations that traders should understand to use it effectively:
-
Clear Market Trends are Essential: To utilize the Fibonacci Retracement tool effectively, the market trend must be clearly defined as either an uptrend or downtrend. A well-established trend makes it easier to identify accurate swing highs and swing lows, which are crucial for creating reliable Fibonacci levels. In sideways or choppy markets, Fibonacci levels may produce false signals, leading to poor trading decisions. Traders should first confirm the overall trend direction using trend indicators or price action analysis before applying Fibonacci retracements.
-
Larger Markets Provide More Reliable Signals: Fibonacci signals tend to be more reliable in larger, more liquid markets compared to smaller, less liquid ones. For example, Bitcoin, being the largest cryptocurrency by market capitalization and trading volume, typically produces more dependable Fibonacci signals than smaller altcoins. This is because larger markets have more participants, reducing the impact of manipulation and creating more consistent price patterns. Smaller cryptocurrency markets may experience erratic price movements that don't respect Fibonacci levels as consistently, making the tool less reliable for trading decisions.
-
Combine with Other Technical Analysis Tools: Although Fibonacci Retracement is powerful on its own, combining it with other technical indicators significantly enhances its effectiveness and provides better confirmation of potential trading opportunities. When multiple technical tools align at the same price level, it creates a confluence zone that increases the probability of a successful trade. Popular indicators that work well with Fibonacci Retracement include Bollinger Bands (for volatility analysis), Stochastic RSI (for momentum confirmation), Ichimoku Cloud (for trend identification), Moving Averages (for dynamic support and resistance), and Volume indicators (for confirming the strength of price movements at Fibonacci levels). This multi-indicator approach helps filter out false signals and provides traders with higher-confidence trading setups.
Benefits and Risks of Using Fibonacci Retracement
The primary benefits of Fibonacci Retracement lie in its ability to help traders establish strategic stop-loss levels and define price targets for their trades. For instance, when a trader observes a cryptocurrency price declining after reaching a peak during an uptrend, they can apply Fibonacci Retracement levels to anticipate where the price might find support and resume its upward movement. By identifying these potential reversal points in advance, traders can position themselves to enter trades at favorable prices before the next leg of the trend begins, maximizing their profit potential.
Fibonacci levels also provide a framework for risk management. Traders can place stop-loss orders just beyond key Fibonacci levels to protect their capital if the price breaks through these support or resistance zones. Additionally, these levels serve as logical profit-taking targets, allowing traders to scale out of positions as the price reaches successive Fibonacci extension levels. This systematic approach to trade management helps remove emotional decision-making from the trading process.
However, despite its effectiveness, Fibonacci Retracement has several limitations and risks that traders must consider. The primary disadvantage is that it requires a certain level of knowledge and skill in chart plotting and interpretation. Beginners may struggle to correctly identify swing highs and swing lows, leading to inaccurate Fibonacci level placement. Misidentifying these key points can result in false signals and poor trading decisions.
Moreover, to achieve greater accuracy and reliability, traders often need to study and incorporate other financial tools and technical indicators alongside Fibonacci Retracement. This requirement for complementary analysis means that traders must invest time in learning multiple analytical techniques. Without sufficient knowledge and experience, users may misread signals or apply the tool incorrectly, potentially leading to trading losses. The tool is also subjective to some degree, as different traders may identify different swing points, resulting in varied Fibonacci level placements and interpretations.
Another risk is that Fibonacci levels are not always respected by the market. During periods of high volatility, strong news events, or fundamental shifts in market sentiment, prices may blow through Fibonacci levels without hesitation. Therefore, traders should always use proper risk management and never rely solely on Fibonacci Retracement for making trading decisions.
Conclusion on Fibonacci in Trading
The Fibonacci Retracement tool stands as one of the most powerful and widely used instruments in a trader's technical analysis arsenal. It provides valuable insights into hidden support and resistance levels, enabling traders to identify optimal entry and exit points for profitable trading opportunities. By understanding where prices are likely to pause, reverse, or continue their trends, traders can make more informed decisions and improve their overall trading performance.
The beauty of Fibonacci analysis lies in its foundation in natural mathematical proportions that appear throughout the universe, from the smallest organisms to the largest galaxies. When these same proportions manifest in financial markets, they provide traders with a unique perspective on price behavior that transcends individual market conditions or time periods. This universal applicability makes Fibonacci Retracement relevant across all trading timeframes and asset classes, including the dynamic cryptocurrency markets.
However, mastering the Fibonacci Retracement tool requires dedication and continuous learning. Traders should invest time in studying not only how to draw and interpret Fibonacci levels but also how to integrate this tool with other technical indicators and analytical methods. Understanding market context, trend strength, volume patterns, and momentum indicators will significantly enhance the effectiveness of Fibonacci analysis.
As with any trading tool, practice is essential. Traders should backtest their Fibonacci strategies on historical price data, use demo accounts to gain experience, and gradually develop their skills before applying the tool with real capital. By combining theoretical knowledge with practical experience and proper risk management, traders can harness the power of Fibonacci Retracement to gain a competitive edge in the markets and achieve more consistent trading results over time.
FAQ
What is the Fibonacci sequence? What is its mathematical principle?
The Fibonacci sequence starts with 0 and 1, where each term equals the sum of the two preceding terms. Its mathematical principle is the recursive formula: Fn = Fn-1 + Fn-2. This sequence appears throughout nature and finance, creating ratios used in technical analysis.
How to Draw Fibonacci Retracement Lines on Trading Charts?
Select a high and low point on the chart, then use the Fibonacci tool in your trading software to draw the retracement levels. The standard levels appear at 23.6%, 38.2%, 50%, 61.8%, and 100% to identify potential support and resistance areas.
What is the role of Fibonacci Extension Lines in trading?
Fibonacci Extension Lines predict potential price targets as trends extend beyond previous highs or lows. Key ratios like 127.2% and 161.8% serve as resistance or support zones. Traders use these levels combined with other analysis tools to identify profit targets and optimize trade management.
What is the significance of Fibonacci golden ratios (0.618, 1.618, etc.) in technical analysis?
Fibonacci ratios (0.618, 1.618) predict price retracements and support/resistance levels. These natural sequence proportions help identify market trends and are core to Elliott Wave Theory for forecasting price movements.
Fibonacci tools predict support and resistance by drawing horizontal lines at key levels: 23.6%, 38.2%, 50%, and 61.8%. Identify the trend direction, apply the tool from swing low to swing high, then confirm with other technical indicators like moving averages or RSI for accuracy.
What is the success rate of Fibonacci trading strategies? What are their limitations?
Fibonacci trading strategies typically achieve success rates above 60%, though not 100% accurate. Key limitations include poor performance in non-trending, highly volatile, or sideways markets where price action becomes unpredictable and whipsaw risk increases significantly.
How to combine Fibonacci lines with other technical indicators such as moving averages and MACD?
Combine Fibonacci retracements with MACD to confirm reversal points. When price retraces to key Fibonacci levels while MACD shows bullish crossovers, it signals strong buying opportunities. Use moving averages to validate trend direction alongside Fibonacci support and resistance levels for enhanced signal reliability.
What are the differences in using Fibonacci across different market cycles (daily, weekly, monthly)?
Fibonacci works across all timeframes, but performs best on longer cycles like daily and weekly charts with higher accuracy. Monthly charts are less precise due to broader market volatility. Longer timeframes provide more reliable support and resistance levels.
* The information is not intended to be and does not constitute financial advice or any other recommendation of any sort offered or endorsed by Gate.