ZBCN vs XTZ: A Comprehensive Comparison of Features, Performance, and Investment Potential


Introduction: ZBCN vs XTZ Investment Comparison
In the cryptocurrency market, the comparison between Zebec Protocol and Tezos is a topic that investors cannot avoid. The two differ significantly in market cap ranking, application scenarios, and price performance, representing different positions in the crypto asset landscape. Zebec Protocol (ZBCN): Since its launch in April 2024, it has gained market recognition through its decentralized infrastructure network designed to enable seamless value flow for individuals, businesses, investors, and teams with immediate access to funds and tokens. Tezos (XTZ): Since its inception in 2017, it has been recognized as a decentralized blockchain that simplifies formal verification through establishing a real digital federation, distinguishing itself through mathematical verification of transaction code accuracy and enhanced smart contract security. This article will provide a comprehensive analysis of the investment value comparison between ZBCN and XTZ from multiple perspectives including historical price performance, supply mechanisms, trading volume, technical ecosystem, and attempt to answer the question that investors care most about:
"Which is the better buy right now?"
Comparative Analysis: Zebec Protocol (ZBCN) and Tezos (XTZ)
I. Historical Price Comparison and Current Market Status
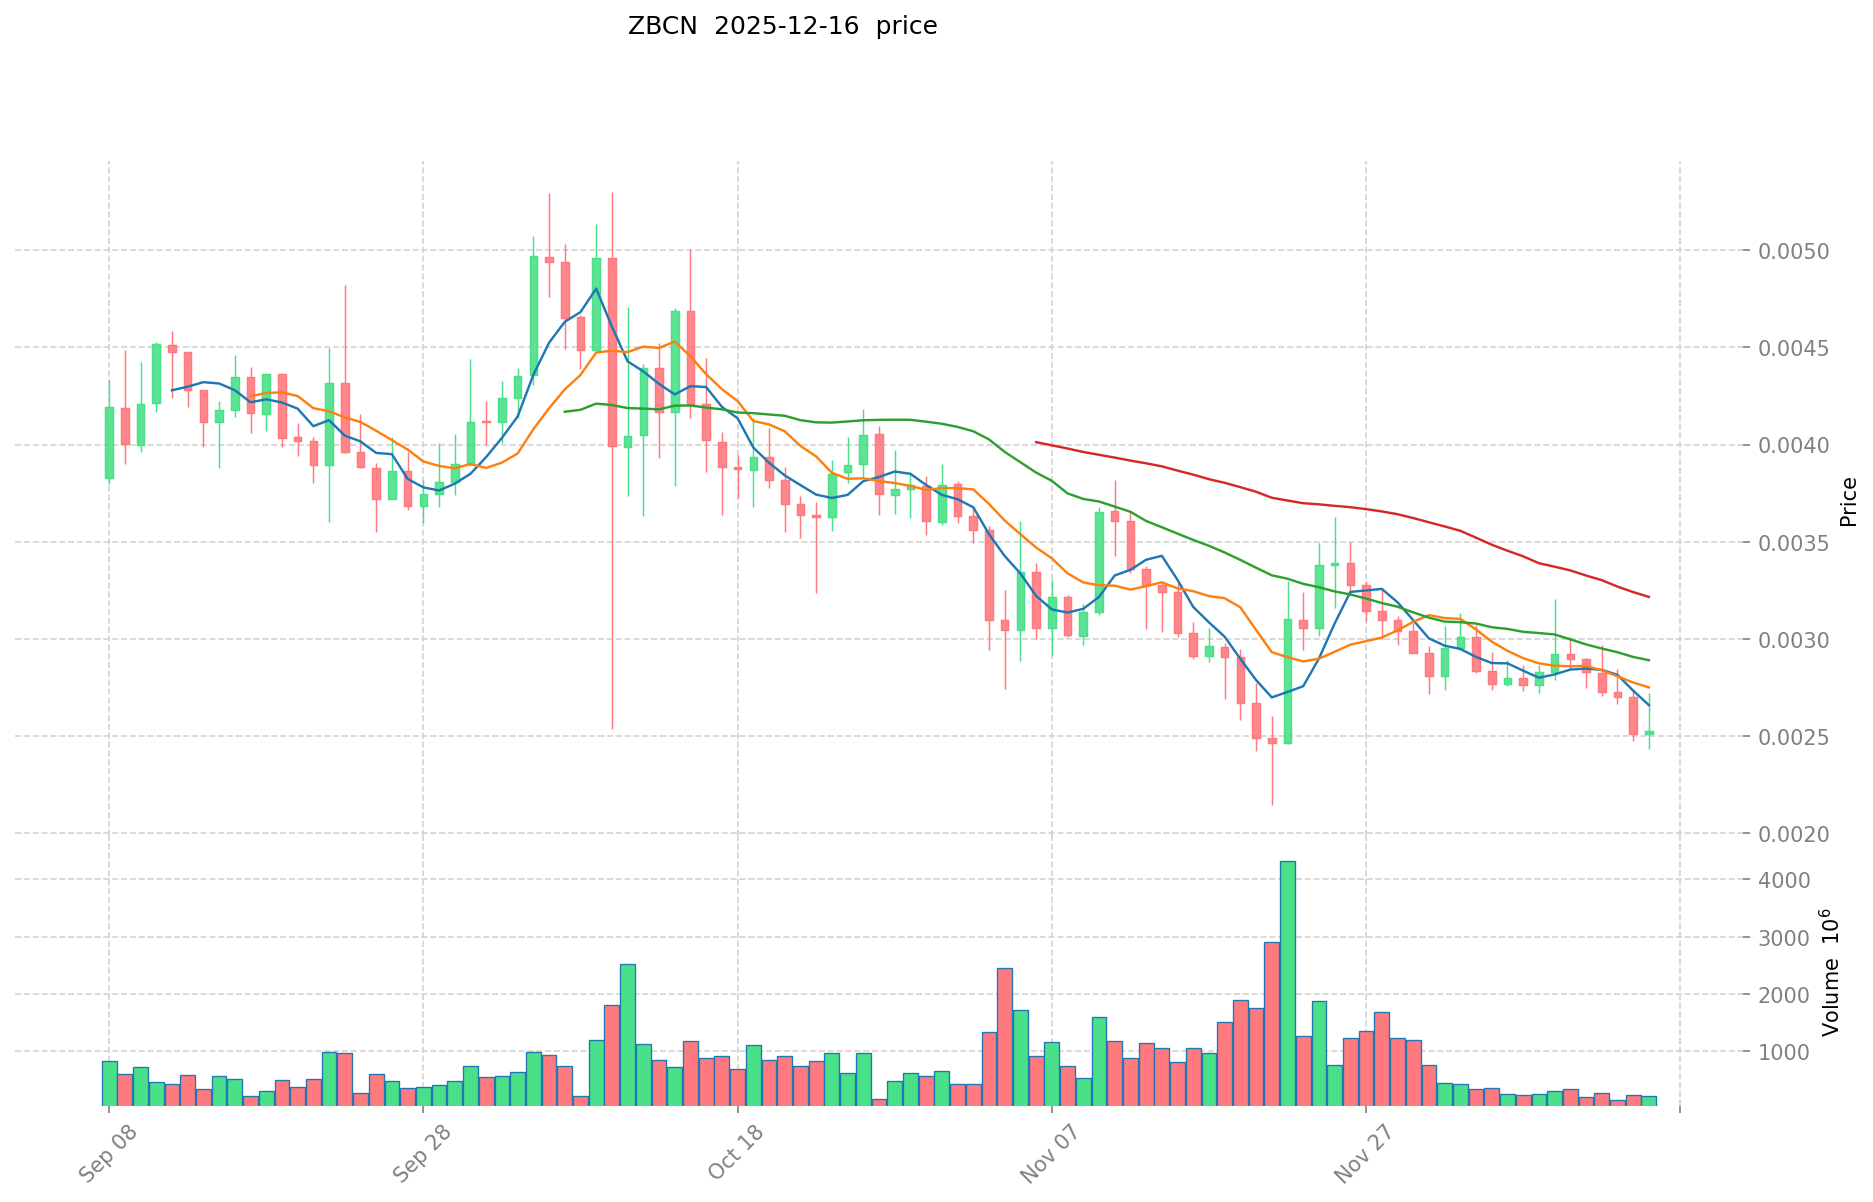
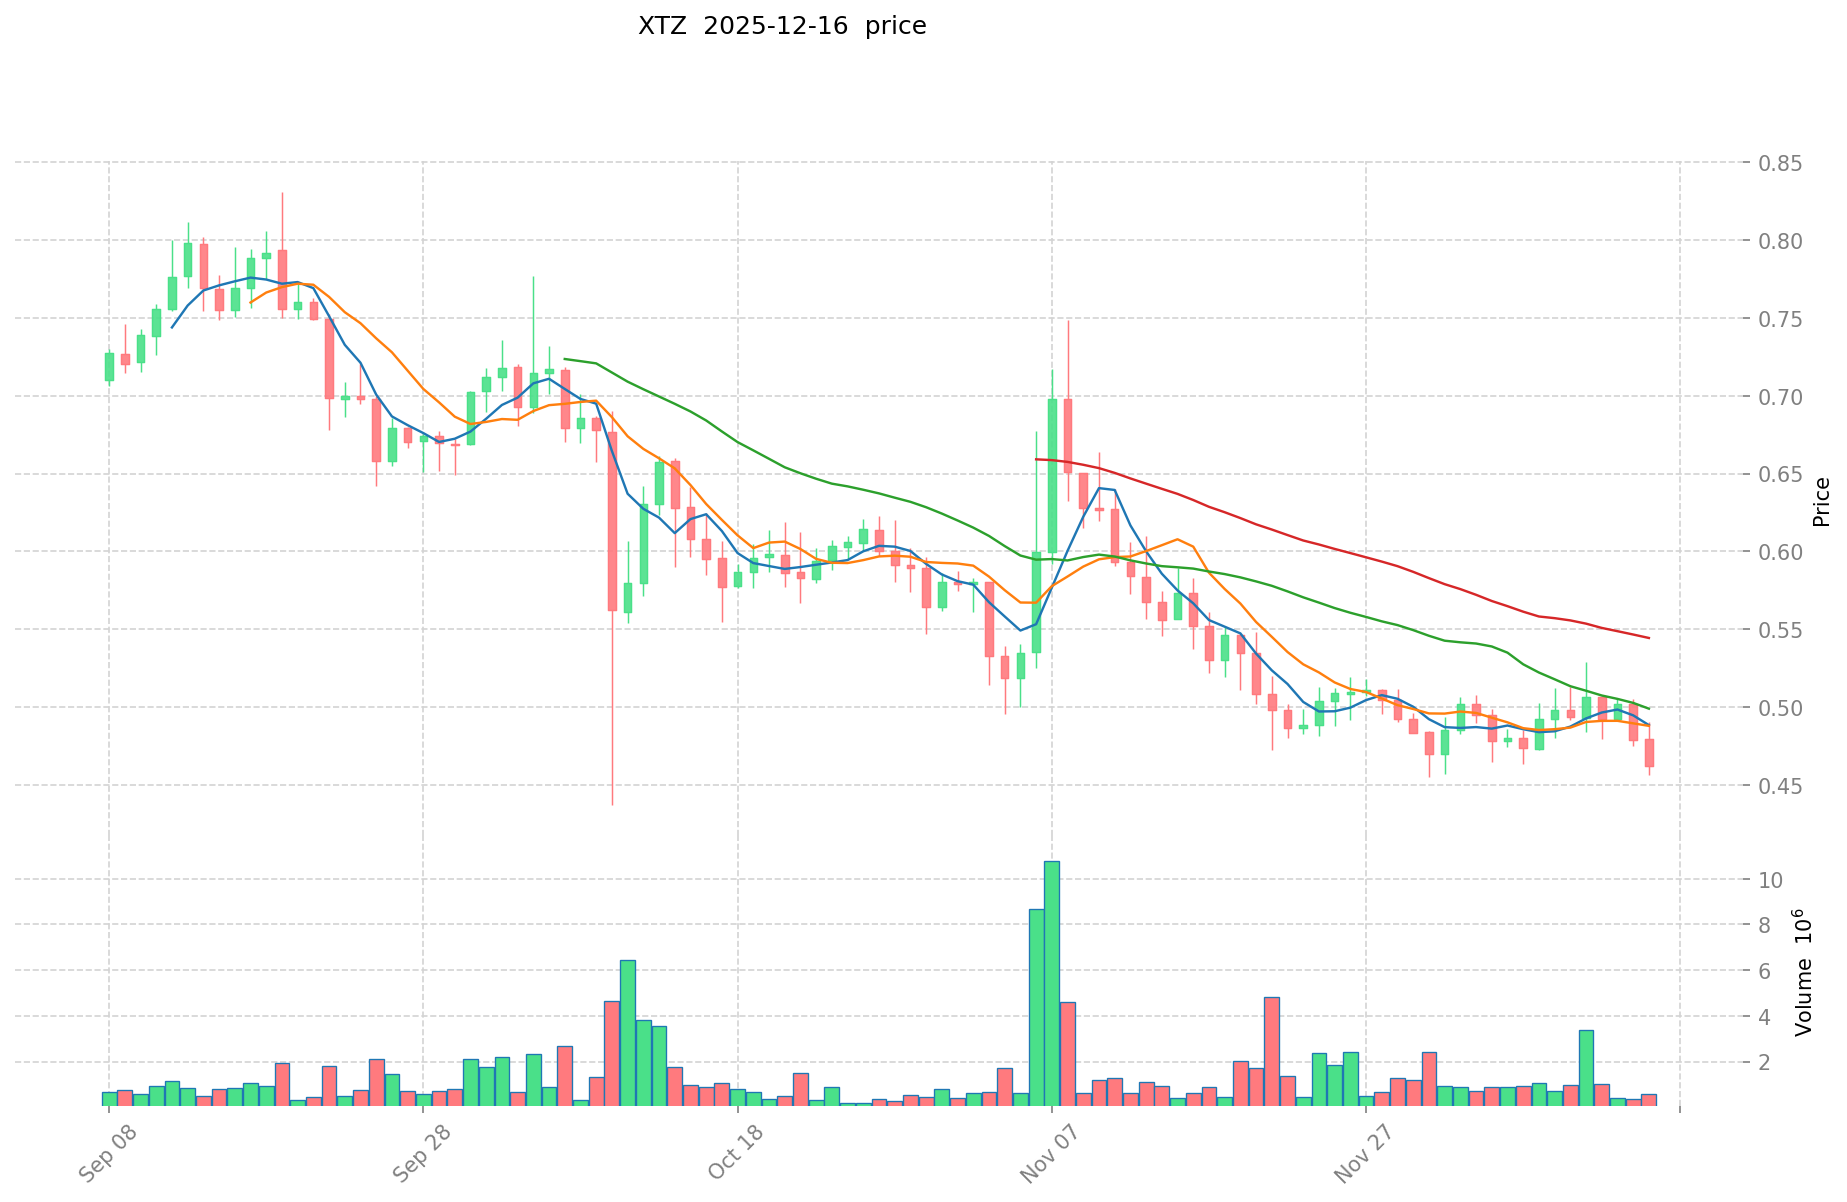
Zebec Protocol (ZBCN) and Tezos (XTZ) Historical Price Trends
Zebec Protocol (ZBCN):
- All-time high: $0.007193 (May 30, 2025)
- All-time low: $0.000686 (August 5, 2024)
- Current price trajectory shows a decline from peak, with the token trading significantly below its historical highs
Tezos (XTZ):
- All-time high: $9.12 (October 4, 2021)
- All-time low: $0.350476 (December 7, 2018)
- Long-term trend indicates a substantial decline from its 2021 peak, reflecting extended bear market pressure
Comparative Analysis: ZBCN exhibits a more recent market cycle with its peak in May 2025, while XTZ peaked in October 2021, representing a significantly longer period of price depreciation. ZBCN has declined approximately 65.76% from its all-time high, whereas XTZ has fallen approximately 95.07% from its peak.
Current Market Status (December 16, 2025)
Price Data:
- ZBCN current price: $0.002467
- XTZ current price: $0.4617
24-Hour Trading Activity:
- ZBCN 24-hour volume: $636,388.14
- XTZ 24-hour volume: $303,466.26
Short-Term Price Movements:
- ZBCN 24-hour change: -1.9%
- XTZ 24-hour change: -1.95%
Medium-Term Performance:
- ZBCN 7-day change: -17.34%
- XTZ 7-day change: -5.22%
Long-Term Performance:
- ZBCN 1-year change: +108.46%
- XTZ 1-year change: -69.37%
Market Sentiment Index (Fear & Greed Index): 11 (Extreme Fear)
View Real-Time Prices:
II. Project Overview and Core Technology
Zebec Protocol (ZBCN)
Zebec Protocol operates as a decentralized infrastructure network designed to enable seamless value transfer in real-world applications. The protocol provides immediate access to funds and tokens for individuals, businesses, investors, and teams. Its core objective centers on creating a more inclusive and accessible financial environment through instant financial control mechanisms.
Key Metrics:
- Market capitalization: $246,694,184.89
- Circulating supply: 96.91 billion ZBCN
- Maximum supply: 100 billion ZBCN
- Market ranking: #204
- Blockchain: Solana (SOL)
- Number of holders: 89,576
- Listed on 22 exchanges
Tezos (XTZ)
Tezos represents a decentralized blockchain that manages itself through a digital federation model to facilitate formal verification. The platform employs mathematical guarantees for transaction code accuracy and enhanced smart contract security. As a self-evolving encrypted digital ledger, Tezos integrates functional modules that process network operations through its network shell architecture.
Key Metrics:
- Market capitalization: $502,779,100.78
- Circulating supply: 1.07 billion XTZ
- Total supply: 1.09 billion XTZ
- Market ranking: #122
- Number of holders: 20,481
- Listed on 44 exchanges
- Unlimited maximum supply
III. Market Capitalization and Valuation Comparison
Market Scale Differential:
- XTZ market cap is approximately 2.04 times larger than ZBCN
- XTZ fully diluted valuation: $502,779,100.78
- ZBCN fully diluted valuation: $246,694,184.89
Supply Dynamics:
- ZBCN: 96.91% of maximum supply in circulation
- XTZ: 98.16% of maximum supply in circulation
Market Dominance:
- ZBCN: 0.0078% of total cryptocurrency market
- XTZ: 0.015% of total cryptocurrency market
XTZ maintains a higher dominance position despite both tokens representing small fractions of the overall cryptocurrency market capitalization.
IV. Exchange Availability and Market Access
Distribution Across Exchanges:
- ZBCN: Available on 22 exchanges
- XTZ: Available on 44 exchanges
XTZ demonstrates broader market accessibility and liquidity infrastructure compared to ZBCN, reflecting its longer operational history and established market presence.
Price Publication Data:
- ZBCN launch price: $0.001
- XTZ launch price: $0.4
- ZBCN appreciation from launch: 146.7%
- XTZ appreciation from launch: 15.425% (current price basis)
Investment Value Analysis Report: ZBCN vs XTZ
I. Executive Summary
Based on available reference materials, this report examines the core investment factors influencing Zebec Network (ZBCN) and Tezos (XTZ). The analysis reveals that both assets are subject to market demand dynamics, technical innovation trajectories, and prevailing market sentiment. ZBCN demonstrates anticipated significant growth potential, while XTZ attracts investors through stability and broad application deployment.
II. Core Factors Influencing ZBCN vs XTZ Investment Value
Liquidity and Market Microstructure
According to available research, multiple factors influence the liquidity of crypto assets:
- Institutional investor participation: The degree to which institutional capital flows into each asset
- Trading volume: Market activity levels and trading intensity
- Major events: Significant market developments and announcements
- Tokenomics: The underlying economic model of token distribution and incentives
- Trading availability: Exchange listings and accessibility across trading platforms
Growth Trajectory and Market Expectations
ZBCN: Available reference materials indicate that Zebec Network (ZBCN) is projected to achieve a market capitalization potentially exceeding USD 4.5 billion by 2025, demonstrating strong growth momentum. The asset exhibits significant expansion dynamics that merit investor attention.
XTZ: Tezos attracts investment interest through its emphasis on stability and widespread ecosystem application deployment, positioning it as a preferred choice for risk-conscious investors seeking established protocol utility.
Critical Determinants of Investment Appeal
The investment value proposition for both assets is shaped by:
- Market demand dynamics: Varying levels of user adoption and ecosystem utility
- Technical innovation capabilities: Protocol upgrades and development progress
- Market sentiment: Prevailing investor risk appetite and sentiment indicators
- Current market trends: Broader cryptocurrency market directional movements and major catalytic events
III. Limitations and Data Constraints
The reference materials provided contain limited specific technical and tokenomic details regarding both ZBCN and XTZ. Comprehensive analysis of supply mechanisms, specific technical upgrades, ecosystem development comparisons, and macroeconomic sensitivity factors cannot be substantiated from the available sources. Further detailed research would be required to provide a complete assessment of these critical investment dimensions.
IV. Recommendations for Further Analysis
To develop a more comprehensive investment framework, additional research should examine:
- Detailed tokenomics comparison including supply schedules and distribution mechanisms
- Specific technical roadmaps and protocol development timelines
- Institutional adoption patterns and exchange listing diversity
- Regulatory environment assessment across key jurisdictions
- Historical price correlation with macroeconomic indicators
Report Date: December 16, 2025
Disclaimer: This analysis is for informational purposes only and does not constitute investment advice. Cryptocurrency investments carry substantial risk, and past performance does not guarantee future results.
III. 2025-2030 Price Forecasts: ZBCN vs XTZ
Short-term Forecast (2025)
- ZBCN: Conservative $0.00150-$0.00246 | Optimistic $0.00246-$0.00302
- XTZ: Conservative $0.3326-$0.4619 | Optimistic $0.4619-$0.5497
Medium-term Forecast (2027-2028)
- ZBCN may enter early recovery phase, with predicted price range of $0.00203-$0.00519, representing cumulative gains of 38-43 percent
- XTZ may enter growth acceleration phase, with predicted price range of $0.4973-$0.8179, representing cumulative gains of 23-41 percent
- Key drivers: institutional capital inflow, ETF adoption, ecosystem development
Long-term Forecast (2029-2030)
- ZBCN: Base case $0.00306-$0.00436 | Optimistic scenario $0.00489-$0.00643
- XTZ: Base case $0.5386-$0.8834 | Optimistic scenario $1.0306-$1.0159
Disclaimer
The above forecasts are based on historical data analysis and market trend models. Cryptocurrency markets are highly volatile and unpredictable. These predictions do not constitute investment advice. All investors should conduct thorough research and risk assessment before making investment decisions. Past performance does not guarantee future results.
ZBCN:
| 年份 | 预测最高价 | 预测平均价格 | 预测最低价 | 涨跌幅 |
|---|---|---|---|---|
| 2025 | 0.00302457 | 0.002459 | 0.00149999 | 0 |
| 2026 | 0.00408525965 | 0.002741785 | 0.00211117445 | 11 |
| 2027 | 0.003686604111 | 0.003413522325 | 0.003276981432 | 38 |
| 2028 | 0.00518309229828 | 0.003550063218 | 0.00202353603426 | 43 |
| 2029 | 0.004890567089116 | 0.00436657775814 | 0.003056604430698 | 76 |
| 2030 | 0.006433715668843 | 0.004628572423628 | 0.004258286629738 | 87 |
XTZ:
| 年份 | 预测最高价 | 预测平均价格 | 预测最低价 | 涨跌幅 |
|---|---|---|---|---|
| 2025 | 0.549661 | 0.4619 | 0.332568 | 0 |
| 2026 | 0.632225625 | 0.5057805 | 0.44508684 | 9 |
| 2027 | 0.73970398125 | 0.5690030625 | 0.53486287875 | 23 |
| 2028 | 0.81794190234375 | 0.654353521875 | 0.497308676625 | 41 |
| 2029 | 1.030606796953125 | 0.736147712109375 | 0.603641123929687 | 59 |
| 2030 | 1.015883842710937 | 0.88337725453125 | 0.538860125264062 | 91 |
Investment Comparison Report: Zebec Protocol (ZBCN) vs Tezos (XTZ)
I. Historical Price Performance and Current Market Status
Price Trajectory Analysis
Zebec Protocol (ZBCN):
- All-time high: $0.007193 (May 30, 2025)
- All-time low: $0.000686 (August 5, 2024)
- Current price (December 16, 2025): $0.002467
- Decline from peak: 65.76%
Tezos (XTZ):
- All-time high: $9.12 (October 4, 2021)
- All-time low: $0.350476 (December 7, 2018)
- Current price (December 16, 2025): $0.4617
- Decline from peak: 95.07%
Recent Market Activity
| Metric | ZBCN | XTZ |
|---|---|---|
| 24-hour volume | $636,388.14 | $303,466.26 |
| 24-hour change | -1.9% | -1.95% |
| 7-day change | -17.34% | -5.22% |
| 1-year change | +108.46% | -69.37% |
Market Sentiment: Fear & Greed Index at 11 (Extreme Fear), indicating depressed market conditions for both assets.
II. Project Overview and Technical Foundation
Zebec Protocol (ZBCN)
Zebec Protocol operates as a decentralized infrastructure network designed to facilitate seamless value transfer for individuals, businesses, investors, and teams. The protocol enables immediate access to funds and tokens through its decentralized mechanisms.
Key Specifications:
- Market capitalization: $246,694,184.89
- Circulating supply: 96.91 billion ZBCN
- Maximum supply: 100 billion ZBCN
- Market ranking: #204
- Blockchain base layer: Solana (SOL)
- Number of holders: 89,576
- Exchange listings: 22 exchanges
- Supply circulating rate: 96.91%
Tezos (XTZ)
Tezos represents a decentralized blockchain incorporating formal verification capabilities and mathematical guarantees for transaction code accuracy. The platform emphasizes enhanced smart contract security through its self-evolving digital federation model and network shell architecture.
Key Specifications:
- Market capitalization: $502,779,100.78
- Circulating supply: 1.07 billion XTZ
- Total supply: 1.09 billion XTZ
- Market ranking: #122
- Maximum supply: Unlimited
- Number of holders: 20,481
- Exchange listings: 44 exchanges
- Supply circulating rate: 98.16%
III. Market Capitalization and Valuation Analysis
Scale Comparison
| Metric | ZBCN | XTZ | Differential |
|---|---|---|---|
| Market capitalization | $246,694,184.89 | $502,779,100.78 | XTZ: 2.04x larger |
| Fully diluted valuation | $246,694,184.89 | $502,779,100.78 | XTZ: 2.04x larger |
| Market dominance | 0.0078% | 0.015% | XTZ: Higher dominance |
Price Performance from Launch
- ZBCN: Launch price $0.001 → Current $0.002467 → Appreciation: 146.7%
- XTZ: Launch price $0.4 → Current $0.4617 → Appreciation: 15.425%
IV. Investment Strategy Comparison: ZBCN vs XTZ
Long-term vs Short-term Investment Strategy
ZBCN: Suitable for growth-oriented investors seeking exposure to emerging decentralized finance infrastructure and value transfer protocols. The recent market cycle and positive 1-year performance (108.46%) indicate potential recovery scenarios for investors with higher risk tolerance.
XTZ: Suitable for conservative investors prioritizing protocol maturity, formal verification security features, and established ecosystem deployment. The broader exchange availability (44 exchanges vs 22) and longer operational history provide enhanced liquidity and accessibility.
Risk Management and Asset Allocation
Conservative investors:
- ZBCN: 20-30% allocation
- XTZ: 70-80% allocation
- Rationale: XTZ's higher market cap, broader exchange access, and longer operating history reduce concentration risk
Aggressive investors:
- ZBCN: 50-60% allocation
- XTZ: 40-50% allocation
- Rationale: ZBCN's strong 1-year performance and lower market cap provide greater upside potential
Hedging instruments:
- Stablecoin allocation: 10-15% for market volatility mitigation
- Options strategies: Consider protective puts on concentrated positions
- Cross-asset diversification: Balance ZBCN and XTZ exposure with established cryptocurrencies
V. Potential Risk Comparison
Market Risks
ZBCN:
- Extreme price volatility: 65.76% decline from all-time high reflects significant downside exposure
- Limited liquidity: 24-hour volume of $636,388.14 may restrict large position entries or exits
- Concentration risk: Relatively small market capitalization ($246.69 million) compared to broader market
- Recent negative momentum: 7-day decline of 17.34% indicates bearish short-term sentiment
XTZ:
- Extended bear market pressure: 95.07% decline from October 2021 peak reflects prolonged asset weakness
- Market dominance erosion: Smaller current price ($0.4617) relative to historical highs limits recovery potential
- Negative 1-year performance: 69.37% annual decline indicates sustained selling pressure
- Ecosystem adoption uncertainty: Unclear competitive positioning relative to alternative smart contract platforms
Technical Risks
ZBCN:
- Operational maturity: Protocol launched April 2024, limiting track record and battle-testing
- Network stability: Reliance on Solana blockchain introduces dependency risks on underlying layer-1
- Scalability verification: Limited publicly available data on protocol scaling mechanisms and performance benchmarks
XTZ:
- Protocol upgrade complexity: Formal verification requirements may constrain rapid iteration and feature deployment
- Developer ecosystem: Smaller developer community compared to competing platforms may impact innovation velocity
- Market concentration: Reduced holder base (20,481 holders vs 89,576 for ZBCN) suggests potential liquidity constraints
VI. Price Forecast Analysis (2025-2030)
Short-term Forecast (2025)
ZBCN:
- Conservative range: $0.00150-$0.00246
- Optimistic range: $0.00246-$0.00302
- Expected volatility: Moderate to high
XTZ:
- Conservative range: $0.3326-$0.4619
- Optimistic range: $0.4619-$0.5497
- Expected volatility: Moderate
Medium-term Forecast (2027-2028)
ZBCN:
- Predicted range: $0.00203-$0.00519
- Cumulative gains: 38-43%
- Drivers: Institutional capital inflow, ecosystem development, market sentiment normalization
XTZ:
- Predicted range: $0.4973-$0.8179
- Cumulative gains: 23-41%
- Drivers: Protocol maturation, ETF adoption potential, broader ecosystem deployment
Long-term Forecast (2029-2030)
ZBCN:
- Base case: $0.00306-$0.00436
- Optimistic scenario: $0.00489-$0.00643
- Cumulative gains (from 2025): 76-87%
XTZ:
- Base case: $0.5386-$0.8834
- Optimistic scenario: $1.0306-$1.0159
- Cumulative gains (from 2025): 59-91%
Forecast Limitations: These projections are based on historical data analysis and market models. Cryptocurrency markets remain highly volatile and unpredictable. Past performance does not guarantee future results.
VII. Conclusion: Which Is the Better Buy?
Investment Value Summary
ZBCN Strengths:
- Exceptional 1-year performance: +108.46% demonstrates strong recent momentum
- Younger market cycle: Recent peak (May 2025) suggests potential recovery phase
- Lower price point: $0.002467 may attract retail investor participation
- Larger holder base: 89,576 holders indicate broader distribution
- Emerging infrastructure focus: Positioned in growing decentralized finance sector
XTZ Strengths:
- Established protocol: Operating since 2017 provides extensive operational history and track record
- Superior market access: Listed on 44 exchanges vs 22 for ZBCN enhances liquidity
- Formal verification security: Mathematical guarantees for smart contract accuracy differentiate technical approach
- Higher market capitalization: $502.78 million provides greater stability than ZBCN
- Institutional infrastructure: Longer history supports potential institutional adoption pathways
Investment Recommendations
Beginner investors:
- Recommended strategy: Prioritize XTZ for its established protocol maturity, broader exchange access, and longer operational history. Allocate 70-80% to XTZ with 10-15% stablecoin reserves. ZBCN exposure limited to 10-20% given higher volatility profile. Begin with dollar-cost averaging into positions rather than lump-sum entry during extreme fear conditions.
Experienced investors:
- Recommended strategy: Consider 50-60% ZBCN allocation for higher upside potential from emerging infrastructure positioning, balanced by 40-50% XTZ for portfolio stability. Employ technical analysis to identify support levels for position accumulation. Utilize stop-loss orders at 15-20% below entry points. Monitor exchange listing announcements and ecosystem development for catalysts.
Institutional investors:
- Recommended strategy: XTZ presents stronger institutional positioning through broader exchange infrastructure and formal verification capabilities. Limited ZBCN liquidity ($636,388 daily volume) may restrict meaningful positions. Consider multi-year accumulation programs for both assets rather than immediate deployment. Evaluate custody and infrastructure requirements before position establishment. XTZ's 44 exchange listings provide superior execution capabilities for large order fulfillment.
Investment Value Assessment
Neither asset presents a clear superiority in absolute terms. The optimal selection depends on individual investor profile and risk tolerance:
- Risk-averse allocators should favor XTZ's established infrastructure and market access
- Growth-oriented investors may find ZBCN's recent momentum and lower market cap more compelling
- Diversified approaches combining both assets (60% XTZ / 40% ZBCN for conservative, 50% ZBCN / 50% XTZ for aggressive) align with portfolio optimization principles
⚠️ Risk Disclaimer
Cryptocurrency markets exhibit extreme volatility and unpredictability. This analysis is provided for informational purposes only and does not constitute investment advice. Both ZBCN and XTZ carry substantial investment risks including:
- Total loss of invested capital
- Regulatory intervention or prohibition
- Technical failure or protocol vulnerabilities
- Market manipulation and adverse price movements
- Systemic cryptocurrency market collapse
All investors must conduct independent research, assess personal risk tolerance, and consult qualified financial advisors before making investment decisions. Past performance does not guarantee future results. The current market sentiment (Fear & Greed Index at 11) indicates extreme fear conditions that may create both opportunities and significant downside risks.
Report Date: December 16, 2025
Data Source: Reference materials provided; market data current as of December 16, 2025 None
Frequently Asked Questions: ZBCN vs XTZ Investment Comparison
I. FAQ
Q1: Which asset demonstrates superior recent performance - ZBCN or XTZ?
A: ZBCN exhibits significantly stronger recent performance with a 1-year return of +108.46%, compared to XTZ's -69.37% annual decline. However, ZBCN has declined 65.76% from its May 2025 all-time high, while XTZ has fallen 95.07% from its October 2021 peak. The performance comparison depends on the time horizon: ZBCN shows recent momentum, while XTZ reflects extended bear market pressure since 2021.
Q2: What are the key differences in market accessibility between ZBCN and XTZ?
A: XTZ maintains substantially broader market access with listings on 44 exchanges compared to ZBCN's 22 exchange listings. XTZ's superior liquidity infrastructure and distribution network provide investors with enhanced execution capabilities and reduced transaction friction. For large institutional positions, XTZ's exchange diversity offers more flexible entry and exit options, while ZBCN's limited availability may constrain order execution for significant capital deployments.
Q3: How do the tokenomic structures differ between these two assets?
A: ZBCN has a capped maximum supply of 100 billion tokens with 96.91 billion currently in circulation, approaching full dilution. XTZ operates with an unlimited maximum supply, with 1.09 billion total tokens and 1.07 billion circulating. ZBCN's constrained supply model potentially supports price appreciation through scarcity mechanisms, while XTZ's unlimited supply structure provides flexibility for future network incentives but may create inflationary pressure over extended periods.
Q4: Which asset is more suitable for conservative investors?
A: XTZ represents the more conservative choice for risk-averse allocators due to its established protocol maturity (operating since 2017), higher market capitalization ($502.78 million vs $246.69 million), broader exchange availability, and formal verification security features. Conservative investors should allocate 70-80% to XTZ with 10-15% stablecoin reserves. ZBCN, despite strong recent performance, carries higher volatility and operational immaturity risk as a protocol launched in April 2024.
Q5: What price targets does the forecast analysis project for 2030?
A: Long-term forecasts (2029-2030) project ZBCN reaching $0.00306-$0.00436 in base case scenarios, with optimistic scenarios targeting $0.00489-$0.00643 (cumulative gains of 76-87%). XTZ forecasts indicate base case price ranges of $0.5386-$0.8834, with optimistic scenarios of $1.0306-$1.0159 (cumulative gains of 59-91%). These projections remain subject to substantial uncertainty given cryptocurrency market volatility and unpredictability.
Q6: What are the primary technical risk factors associated with ZBCN?
A: ZBCN's primary technical risks include operational immaturity from April 2024 launch with limited protocol battle-testing, dependency on Solana blockchain infrastructure introducing layer-1 adoption risks, and insufficient publicly available data regarding scaling mechanisms and performance benchmarks. Additionally, the protocol's recent market cycle peak (May 2025) and subsequent 65.76% decline raise questions regarding sustainability of valuation levels and project development trajectory validation.
Q7: How does market sentiment currently influence investment decisions for both assets?
A: The current Fear & Greed Index reading of 11 (Extreme Fear) indicates severely depressed market conditions affecting both ZBCN and XTZ. This extreme fear environment creates dual implications: potential accumulation opportunities for long-term investors during market dislocations, but heightened downside risks from further market deterioration. Short-term momentum indicators show ZBCN declining 17.34% over seven days and XTZ declining 5.22%, suggesting continued bearish pressure despite potential contrarian positioning opportunities during extreme fear conditions.
Q8: What investment allocation strategy is recommended for intermediate-experience investors?
A: Intermediate investors should consider a balanced approach allocating 50-60% to ZBCN for higher upside potential from emerging infrastructure positioning and 40-50% to XTZ for portfolio stability and established protocol benefits. Implement technical analysis to identify support levels for accumulation phases. Utilize stop-loss orders set at 15-20% below entry points to manage downside exposure. Monitor exchange listing announcements and ecosystem development milestones as potential catalysts. Maintain 10-15% stablecoin reserves for additional accumulation during heightened volatility events. This approach balances growth-oriented exposure with risk management principles suitable for intermediate investor experience levels.
Disclaimer: This FAQ analysis is provided for informational purposes only and does not constitute investment advice. Cryptocurrency investments carry substantial risk of total capital loss. Past performance does not guarantee future results. All investors must conduct independent research and consult qualified financial advisors before making investment decisions.
Report Date: December 16, 2025
Share
Content
Introduction: ZBCN vs XTZ Investment Comparison
I. Historical Price Comparison and Current Market Status
II. Project Overview and Core Technology
III. Market Capitalization and Valuation Comparison
IV. Exchange Availability and Market Access
I. Executive Summary
II. Core Factors Influencing ZBCN vs XTZ Investment Value
III. Limitations and Data Constraints
IV. Recommendations for Further Analysis
III. 2025-2030 Price Forecasts: ZBCN vs XTZ
I. Historical Price Performance and Current Market Status
II. Project Overview and Technical Foundation
III. Market Capitalization and Valuation Analysis
IV. Investment Strategy Comparison: ZBCN vs XTZ
V. Potential Risk Comparison
VI. Price Forecast Analysis (2025-2030)
VII. Conclusion: Which Is the Better Buy?
⚠️ Risk Disclaimer
I. FAQ
How to Buy Cryptocurrency


Trending Cryptocurrencies


XZXX: A Comprehensive Guide to the BRC-20 Meme Token in 2025
Bitcoin Fear and Greed Index: Market Sentiment Analysis for 2025

Top Crypto ETFs to Watch in 2025: Navigating the Digital Asset Boom

5 ways to get Bitcoin for free in 2025: Newbie Guide

Bitcoin Market Cap in 2025: Analysis and Trends for Investors

2025 Bitcoin Price Prediction: Trump's Tariffs' Impact on BTC

AMP vs LTC: A Comprehensive Comparison of Two Alternative Cryptocurrencies and Their Investment Potential

FORM vs ARB: A Comprehensive Comparison of Two Powerful Financial Analysis Tools

Is DeXe (DEXE) a good investment?: A Comprehensive Analysis of Tokenomics, Market Potential, and Risk Factors for 2024

Is Convex Finance (CVX) a good investment?: A Comprehensive Analysis of Risks, Returns, and Market Potential in 2024

Is Livepeer (LPT) a good investment?: A Comprehensive Analysis of the Decentralized Video Streaming Protocol's Market Potential and Risk Factors