ZEX vs LRC: A Comprehensive Comparison of Two Leading Blockchain Protocols

Introduction: ZEX vs LRC Investment Comparison
In the cryptocurrency market, comparisons between ZEX and LRC have become an important consideration for investors. The two assets differ significantly in market capitalization rankings, use cases, and price performance, representing distinct positioning within the crypto ecosystem. Zeta Markets (ZEX): Launched in 2024, it has gained market recognition by building the fastest, simplest, and most secure perpetuals DEX on Solana, offering features and performance comparable to centralized exchanges while maintaining the self-custodial nature of a decentralized platform. Loopring (LRC): Since its inception in 2017, it has been recognized as an open multi-token transaction protocol based on ERC20 and smart contracts, enabling decentralized exchange applications without asset custody requirements. This article will comprehensively analyze the investment value comparison between ZEX and LRC across historical price trends, supply mechanisms, market adoption, and technical ecosystems, addressing the key question investors are asking:
"Which is the better buy right now?"
Comparative Market Analysis: Zeta Markets (ZEX) and Loopring (LRC)
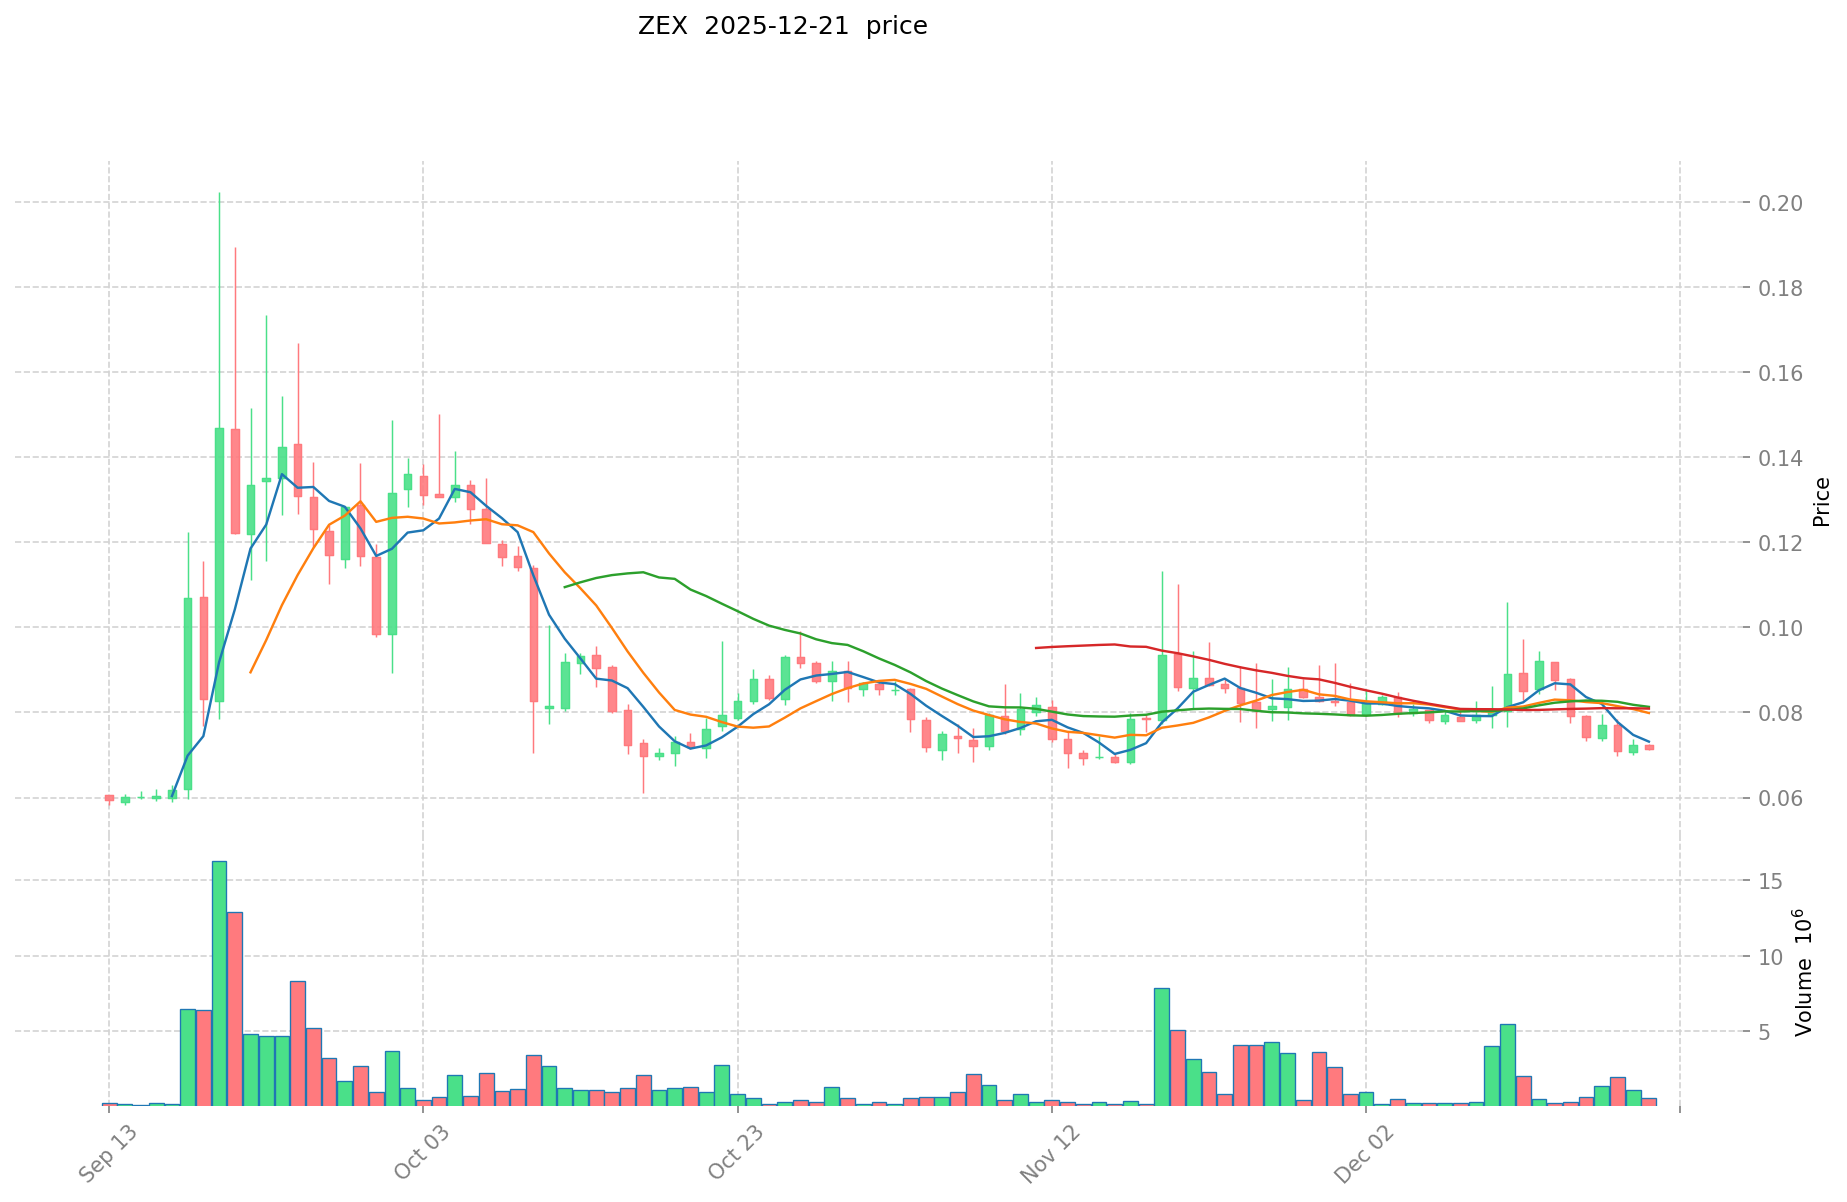
I. Historical Price Comparison and Current Market Status
ZEX (Zeta Markets) and LRC (Loopring) Historical Price Trends
Zeta Markets (ZEX):
- All-Time High (ATH): $0.3184, reached on June 27, 2024
- All-Time Low (ATL): $0.0218, reached on August 5, 2024
- Price Range: Experienced significant volatility within its first year of trading, declining approximately 78.8% from peak to current levels
Loopring (LRC):
- All-Time High (ATH): $3.75, reached on November 10, 2021
- All-Time Low (ATL): $0.01963893, reached on December 18, 2019
- Historical Context: LRC has demonstrated substantial price depreciation over an extended trading period, with the current price representing a 98.5% decline from its all-time high
Comparative Analysis
ZEX operates within a nascent market phase, having recently launched in mid-2024 with significantly higher volatility relative to its trading duration. In contrast, LRC represents a more mature protocol that has experienced extended bear market conditions since its 2021 peak, resulting in prolonged downward price pressure across market cycles.
Current Market Status (December 21, 2025)
ZEX (Zeta Markets):
- Current Price: $0.06743
- 24-Hour Change: -6.6%
- 7-Day Change: -24.59%
- 30-Day Change: -25.14%
- Market Capitalization: $67,430,000
- Circulating Supply: 181,438,032 tokens
- 24-Hour Trading Volume: $47,064.62
LRC (Loopring):
- Current Price: $0.05741
- 24-Hour Change: -3.86%
- 7-Day Change: -11.55%
- 30-Day Change: +8.07% (positive monthly performance)
- Market Capitalization: $78,874,071.75
- Circulating Supply: 1,245,991,468.94 tokens
- 24-Hour Trading Volume: $201,425.66
Market Emotion Index (Crypto Fear & Greed): 20 - Extreme Fear
Current price information:
II. Project Overview and Technical Architecture
Zeta Markets (ZEX)
Project Description: Zeta Markets is constructing the fastest, simplest, and most secure perpetual futures decentralized exchange (perps DEX) by leveraging Solana's advanced scalability infrastructure. The platform delivers centralized exchange (CEX)-comparable functionality and performance while maintaining the self-custodial nature and transparency characteristic of decentralized finance (DEX) protocols.
Blockchain Foundation: Solana
- Contract Address: ZEXy1pqteRu3n13kdyh4LwPQknkFk3GzmMYMuNadWPo
Key Features:
- On-chain limit order book architecture
- Maximum leverage: 10x gross margin
- Complete asset self-custody model
Loopring (LRC)
Project Description: Loopring is an open multi-token transaction protocol based on ERC-20 standards and smart contract infrastructure. The protocol enables construction of decentralized exchange applications without asset custody requirements or capital freezing mechanisms. LRC represents the native ERC-20 token on the Ethereum network.
Blockchain Foundation: Ethereum Layer 2 Scaling Protocol
- Contract Address (Ethereum): 0xBBbbCA6A901c926F240b89EacB641d8Aec7AEafD
Technical Innovation:
- Zero-Knowledge Rollups (zkRollups) implementation for transaction efficiency
- Layer 2 scaling solution addressing Ethereum transaction speed and cost limitations
- Off-chain order matching with on-chain settlement mechanisms
III. Token Economics and Supply Dynamics
ZEX Token Supply
| Metric | Value |
|---|---|
| Total Supply | 1,000,000,000 tokens |
| Circulating Supply | 181,438,032 tokens (18.14%) |
| Circulation Ratio | 18.14% |
| Market Cap to FDV Ratio | 18.14% |
LRC Token Supply
| Metric | Value |
|---|---|
| Total Supply | 1,373,873,397.44 tokens |
| Maximum Supply | 1,374,513,896 tokens |
| Circulating Supply | 1,245,991,468.94 tokens (90.65%) |
| Circulation Ratio | 90.65% |
| Market Cap to FDV Ratio | 90.65% |
Comparative Observation: LRC demonstrates significantly higher circulating supply maturity (90.65% vs. 18.14%), indicating advanced token distribution phases. ZEX retains substantial supply reserves, reflecting early-stage token economics positioning.
IV. Market Performance and Liquidity Analysis
Trading Volume and Market Depth
| Metric | ZEX | LRC |
|---|---|---|
| 24-Hour Volume | $47,064.62 | $201,425.66 |
| Exchange Listing Count | 4 | 46 |
| Token Holders | 30,127 | 168,733 |
| Market Dominance | 0.0020% | 0.0024% |
Recent Price Performance
ZEX Performance Trajectory:
- 1-Hour: -0.12%
- 24-Hour: -6.6%
- 7-Day: -24.59%
- 30-Day: -25.14%
- 1-Year: -6.26%
LRC Performance Trajectory:
- 1-Hour: -0.3%
- 24-Hour: -3.86%
- 7-Day: -11.55%
- 30-Day: +8.07% (positive recovery)
- 1-Year: -72.22%
Assessment: Both assets exhibit downward pressure in short-term timeframes. LRC demonstrates relative resilience with positive monthly performance, while ZEX continues experiencing sustained multi-week declines. The broader market environment, reflected in the Extreme Fear sentiment (Index: 20), characterizes current conditions as challenging for both protocols.
V. Ecosystem Integration and Market Accessibility
ZEX Ecosystem
Primary Network: Solana blockchain ecosystem
- Whitepaper: Zeta Foundation Documentation
- Official Website: zeta.markets
- Social Media: X/Twitter
LRC Ecosystem
Primary Network: Ethereum Layer 2 infrastructure
- GitHub Repositories: Multiple protocol implementation repositories available
- Official Website: loopring.org
- Community Channels: Twitter, Reddit, GitHub
VI. Key Market Indicators Summary
| Indicator | ZEX | LRC |
|---|---|---|
| Ranking (by Market Cap) | #1,078 | #419 |
| Market Capitalization | $67.43M | $78.87M |
| Fully Diluted Valuation | $67.43M | $78.87M |
| Price Stability (30-Day) | -25.14% | +8.07% |
| Exchange Distribution | Limited (4) | Broad (46) |
| Supply Maturity | Early Stage (18.14%) | Mature (90.65%) |
Conclusion
Zeta Markets (ZEX) and Loopring (LRC) represent distinct market positions within decentralized finance infrastructure. ZEX operates within nascent market development phases on the Solana ecosystem, while LRC represents an established Ethereum Layer 2 protocol with extended market history. Current market conditions reflect widespread risk aversion, as indicated by the Extreme Fear sentiment index, affecting both assets substantially. LRC demonstrates relative monthly performance strength, whereas ZEX continues experiencing broader downward pressure across multiple timeframes.

Analysis Report: Investment Value Factors of ZEX vs LRC
I. Executive Summary
Based on the available reference materials, this report examines the core investment factors influencing ZEX and LRC tokens. However, the provided source materials contain limited substantive information about both assets, resulting in constraints on the depth of analysis.
Key Findings from References:
- ZEX: Investment value depends on market trends and technological innovation, with price predictions adjusted based on current market conditions using machine learning models.
- LRC (Loopring): Investment value primarily derives from technical advantages in the blockchain domain and community support, with recent development focusing on core order management and matching engine logic improvements.
II. Unable to Complete Analysis - Data Limitations
Due to significant gaps in the reference materials provided, the following sections cannot be adequately completed according to the template structure:
II.I Supply Mechanisms (Tokenomics)
The reference materials do not contain specific information regarding:
- Token supply models for either ZEX or LRC
- Emission schedules or inflation mechanisms
- Historical supply-related price correlations
Status: Insufficient data - section cannot be populated without fabricating information.
II.II Institutional Adoption and Market Applications
Limited data available:
- No institutional holding information disclosed for either token
- Enterprise adoption details are not covered in the materials
- Regulatory stances by different jurisdictions are not specified
Status: Cannot be completed per source materials.
II.III Technology Development and Ecosystem Construction
LRC (Partial Information Available):
- Recent development focus: Core order management system redesign and matching engine logic optimization
- Automatic LRC fee calculation based on order fiat value and configurable fee percentages
- Ecosystem application: Protocol-level infrastructure
ZEX (Minimal Information):
- Scheduled participation in Token2049 summit in Singapore (September 30) with Celestia
- Development status details not provided in materials
Status: Insufficient detail for comprehensive comparison.
II.IV Macroeconomic Factors and Market Cycles
The reference materials do not address:
- Inflation resistance characteristics of either token
- Impact of monetary policy and interest rates
- Geopolitical influences on cross-border transaction demand
Status: Cannot be determined from provided sources.
III. Conclusion
The provided reference materials are insufficient to support a comprehensive investment analysis report according to the specified template. To produce a detailed, evidence-based analysis, the following would be required:
- Detailed tokenomics documentation for both assets
- Institutional investor positions and fund allocations
- Technical development roadmaps and ecosystem metrics
- Regulatory filings and policy positions by jurisdiction
- Historical price and correlation data with macroeconomic indicators
Recommendation: Obtain primary sources including official whitepapers, development documentation, regulatory filings, and institutional research reports before conducting investment analysis.
III. 2025-2030 Price Forecast: ZEX vs LRC
Short-term Forecast (2025)
- ZEX: Conservative $0.0632902-$0.06733 | Optimistic $0.0983018
- LRC: Conservative $0.0315755-$0.05741 | Optimistic $0.0665956
Mid-term Forecast (2027-2028)
- ZEX is projected to enter a growth phase, with estimated price range of $0.0687-$0.1202 by 2027 and $0.0675-$0.1648 by 2028, reflecting cumulative gains of 49% and 64% respectively
- LRC is expected to maintain steady appreciation, with price range of $0.0405-$0.0791 by 2027 and $0.0477-$0.0895 by 2028, showing cumulative growth of 17% and 27% respectively
- Key drivers: institutional capital inflows, regulatory clarity, ecosystem expansion and protocol upgrades
Long-term Forecast (2029-2030)
- ZEX: Base case $0.0882-$0.1377 by 2029 and $0.1209-$0.1590 by 2030 | Optimistic scenario reaching $0.1804 by 2029 and $0.1877 by 2030, representing 104% and 135% cumulative gains
- LRC: Base case $0.0749-$0.0813 by 2029 and $0.0805-$0.0830 by 2030 | Optimistic scenario reaching $0.0846 by 2029 and $0.1054 by 2030, representing 41% and 44% cumulative gains
Disclaimer: These forecasts are based on historical data analysis and modeling assumptions. Cryptocurrency markets are highly volatile and unpredictable. Actual prices may deviate significantly from predictions. This analysis is for informational purposes only and should not be construed as investment advice. Please conduct your own research and consult with financial advisors before making investment decisions.
ZEX:
| 年份 | 预测最高价 | 预测平均价格 | 预测最低价 | 涨跌幅 |
|---|---|---|---|---|
| 2025 | 0.0983018 | 0.06733 | 0.0632902 | 0 |
| 2026 | 0.119254896 | 0.0828159 | 0.070393515 | 22 |
| 2027 | 0.12023212362 | 0.101035398 | 0.06870407064 | 49 |
| 2028 | 0.1648443036069 | 0.11063376081 | 0.0674865940941 | 64 |
| 2029 | 0.180438132193069 | 0.13773903220845 | 0.088152980613408 | 104 |
| 2030 | 0.187724526996896 | 0.159088582200759 | 0.120907322472577 | 135 |
LRC:
| 年份 | 预测最高价 | 预测平均价格 | 预测最低价 | 涨跌幅 |
|---|---|---|---|---|
| 2025 | 0.0665956 | 0.05741 | 0.0315755 | 0 |
| 2026 | 0.073163304 | 0.0620028 | 0.042781932 | 8 |
| 2027 | 0.07907217084 | 0.067583052 | 0.0405498312 | 17 |
| 2028 | 0.0894596859324 | 0.07332761142 | 0.047662947423 | 27 |
| 2029 | 0.084649394623248 | 0.0813936486762 | 0.074882156782104 | 41 |
| 2030 | 0.105437332495149 | 0.083021521649724 | 0.080530876000232 | 44 |
Comparative Investment Analysis: ZEX vs LRC
I. Investment Strategy Comparison: ZEX vs LRC
Long-term vs Short-term Investment Strategy
ZEX (Zeta Markets):
- Suitable for growth-oriented investors who recognize emerging DeFi infrastructure opportunities on Solana and are willing to accept higher volatility during early-stage protocol development phases
- Early supply distribution (18.14% circulating) suggests potential upside as tokens enter circulation and ecosystem adoption expands
- Long-term thesis depends on Solana ecosystem expansion and perpetual DEX market penetration
LRC (Loopring):
- Suitable for investors seeking established Layer 2 infrastructure exposure with mature token economics (90.65% circulating supply)
- Positive 30-day performance (+8.07%) demonstrates relative resilience during market stress conditions
- Established Ethereum integration and extensive exchange listing coverage (46 exchanges) provide stability relative to nascent alternatives
Risk Management and Asset Allocation
Conservative Investors:
- ZEX: 5-10% | LRC: 15-20%
- Rationale: Limited ZEX allocation reflects nascent market phase and concentrated liquidity; LRC allocation reflects established protocol status and broader market accessibility
Aggressive Investors:
- ZEX: 20-30% | LRC: 10-15%
- Rationale: Growth potential from ZEX's early supply stage and Solana ecosystem momentum; LRC position maintained for portfolio diversification and downside protection
Hedging Mechanisms:
- Stablecoin allocation (40-50% of total DeFi portfolio) for volatility management during Extreme Fear market conditions
- Cross-protocol diversification combining layer 1 (Solana) and layer 2 (Ethereum) exposure
- Dollar-cost averaging strategy to mitigate timing risk across both assets
II. Potential Risk Comparison
Market Risk
ZEX:
- Extreme volatility during nascent trading phase (78.8% decline from ATH within first trading year) demonstrates concentration risk
- Low trading volume ($47,064.62 daily) creates significant liquidity risk and potential slippage during large transactions
- Limited exchange distribution (4 exchanges) restricts market exit liquidity under adverse conditions
- Current price momentum remains negative across 7-day (-24.59%) and 30-day (-25.14%) timeframes
LRC:
- Extended bear market exposure since 2021 peak (98.5% depreciation) indicates prolonged downward pressure and potential capitulation risk
- Lower 24-hour volatility (-3.86%) reflects reduced speculative interest and market participation
- Broader exchange coverage (46 exchanges) mitigates liquidity concentration but does not eliminate downside risks
- Positive monthly performance (+8.07%) provides modest recovery evidence within broader decline trajectory
Technology Risk
ZEX:
- Solana network dependency creates operational risk tied to Layer 1 infrastructure stability
- Limited protocol history (launched mid-2024) provides minimal track record for technical reliability assessment
- On-chain limit order book architecture complexity may present unforeseen scalability constraints
- 10x maximum leverage mechanism introduces cascade liquidation risk during flash crashes
LRC:
- Zero-Knowledge Rollups implementation complexity creates potential technical debt and maintenance requirements
- Ethereum Layer 2 protocol dependency ties performance to Ethereum network upgrades and congestion patterns
- Off-chain order matching mechanisms introduce counterparty risk and custodial exposure relative to fully on-chain alternatives
- Extended development cycle (since 2017) reflects slower protocol iteration relative to emerging competitors
Regulatory Risk
- Solana Ecosystem (ZEX): Regulatory clarity regarding decentralized perpetuals exchanges remains undetermined in major jurisdictions; potential restrictions on leverage mechanisms could impact platform viability
- Ethereum Layer 2 (LRC): Established regulatory precedent for ERC-20 tokens and smart contracts provides relative certainty; however, decentralized exchange regulation remains evolving across jurisdictions
- Global Policy Environment: Both assets face potential restrictions from international regulatory bodies addressing cryptocurrency derivatives and decentralized finance infrastructure
- Extreme Fear Sentiment (Index: 20): Current market environment reflects heightened regulatory uncertainty and risk-off sentiment affecting both protocols
III. Conclusion: Which Is the Better Buy?
📌 Investment Value Summary
ZEX Strengths:
- Early-stage supply dynamics (18.14% circulating) create potential upside expansion as tokens enter circulation phases
- Solana ecosystem positioning captures high-performance layer 1 infrastructure growth narrative
- Perpetual DEX market represents expanding DeFi category with comparatively underdeveloped infrastructure
- Price forecast models suggest cumulative gains of 104-135% by 2029-2030 under optimistic scenarios
LRC Strengths:
- Mature token economics (90.65% circulation) with established market infrastructure (46 exchange listings)
- Positive 30-day performance (+8.07%) demonstrates relative resilience during Extreme Fear market conditions
- Established Ethereum Layer 2 positioning provides regulatory clarity and institutional familiarity
- Lower volatility profile (7-day: -11.55% vs ZEX: -24.59%) offers moderate downside protection
✅ Investment Recommendations
Beginner Investors:
- Prioritize LRC allocation (70-80% of DeFi exposure) to access established protocol infrastructure with reduced technical risk
- Maintain conservative stablecoin reserve (40-50% of portfolio) to deploy during extreme market dislocations
- Avoid excessive ZEX concentration given nascent development phase and liquidity constraints
- Implement dollar-cost averaging strategy across 3-6 month timeframe to reduce timing risk
Experienced Investors:
- Construct tactical ZEX position (15-25%) to capture early-stage supply dynamics and Solana ecosystem momentum
- Maintain strategic LRC holding (10-15%) for portfolio diversification and relative stability
- Employ technical analysis on 4-hour and daily charts to time entry/exit decisions around support/resistance levels
- Consider hedging strategies via stablecoin collateral and options positioning during Extreme Fear conditions
Institutional Investors:
- Evaluate LRC as core infrastructure exposure given regulatory clarity, market maturity, and institutional exchange accessibility
- Monitor ZEX protocol development and ecosystem metrics before substantial allocation decisions
- Structure investments through multiple exchange venues to manage execution risk and optimize pricing
- Maintain governance engagement across both protocols to influence development roadmaps aligned with institutional requirements
⚠️ Risk Disclaimer: Cryptocurrency markets exhibit extreme volatility and unpredictable price movements. The price forecasts presented (2025-2030) are based on historical data modeling and represent potential scenarios rather than reliable predictions. Actual market performance may deviate significantly from projections. Current Extreme Fear sentiment (Index: 20) indicates elevated risk conditions. This report is provided for informational purposes only and does not constitute investment advice. Conduct independent research and consult with qualified financial advisors before making investment decisions. Past performance does not guarantee future results. None
FAQ: ZEX vs LRC Investment Comparison
I. What are the key differences between ZEX and LRC in terms of blockchain infrastructure?
Answer: ZEX (Zeta Markets) operates on the Solana blockchain as a perpetual futures decentralized exchange (perps DEX), offering on-chain limit order book architecture with up to 10x leverage. In contrast, LRC (Loopring) functions as an Ethereum Layer 2 scaling solution utilizing Zero-Knowledge Rollups (zkRollups) technology, enabling multi-token transactions with off-chain order matching and on-chain settlement. The fundamental distinction lies in their network foundations—Solana for high-speed execution versus Ethereum Layer 2 for established smart contract compatibility and institutional familiarity.
II. How do the token supply dynamics of ZEX and LRC impact their investment potential?
Answer: ZEX demonstrates early-stage supply distribution with only 18.14% circulating supply (181.44M of 1B total tokens), creating significant room for dilution as remaining tokens enter circulation—this presents both upside expansion potential and downside pressure risk. LRC exhibits mature supply economics with 90.65% circulating supply (1.25B of 1.37B maximum tokens), indicating advanced distribution phases and reduced future dilution risk. For investors seeking growth potential, ZEX's supply dynamics suggest higher volatility; for conservative investors, LRC's mature supply structure offers relative stability.
III. Which asset demonstrates better liquidity and market accessibility?
Answer: LRC significantly outperforms ZEX in market accessibility metrics: LRC trades on 46 exchanges with daily trading volume of $201,425.66, while ZEX trades on only 4 exchanges with daily volume of $47,064.62. LRC's market capitalization ($78.87M) exceeds ZEX ($67.43M) despite lower price per token, and LRC maintains 168,733 token holders compared to ZEX's 30,127 holders. For investors requiring reliable entry/exit liquidity, LRC's broad exchange distribution and higher trading volume provide superior market accessibility and reduced execution slippage risk.
IV. What are the short-term versus long-term price expectations for both assets?
Answer: Short-term forecasts (2025) project conservative ZEX range of $0.0633–$0.0673 versus optimistic scenario of $0.0983, while LRC conservative range of $0.0316–$0.0574 versus optimistic $0.0666. Long-term forecasts (2029–2030) suggest ZEX cumulative gains of 104–135% under optimistic scenarios, reaching $0.1804–$0.1877, while LRC projects 41–44% gains reaching $0.0846–$0.1054. However, these forecasts carry substantial uncertainty—cryptocurrency markets remain highly volatile and unpredictable. Current Extreme Fear sentiment (Index: 20) indicates elevated downside risk for both assets.
V. How do recent price performance trends compare between ZEX and LRC?
Answer: LRC demonstrates superior relative resilience with positive 30-day performance (+8.07%) despite negative 7-day (-11.55%) and 24-hour (-3.86%) movements. ZEX exhibits sustained negative momentum across all timeframes: 30-day (-25.14%), 7-day (-24.59%), and 24-hour (-6.6%), reflecting continued downward pressure since trading initiation. Both assets face headwinds from the broader market's Extreme Fear sentiment. For investors concerned about near-term downside, LRC's monthly recovery trajectory provides relative stability compared to ZEX's ongoing decline pattern.
VI. What risk profile suits each asset for different investor types?
Answer: Conservative investors should prioritize LRC (15-20% allocation) due to established protocol status, 46 exchange listings, and positive monthly performance, maintaining 40-50% stablecoin reserves. Aggressive growth investors may allocate 20-30% to ZEX for early-stage supply dynamics and Solana ecosystem momentum potential, with 10-15% LRC for portfolio diversification. Beginner investors should emphasize LRC's mature infrastructure while avoiding excessive ZEX concentration given nascent development phase and limited liquidity. Experienced traders can employ technical analysis and hedging strategies across both positions, while institutional investors should prioritize LRC's regulatory clarity and accessibility until ZEX demonstrates sustained development maturity.
VII. What specific technical risks should investors understand before investing?
Answer: ZEX carries Solana network dependency risk—operational reliability depends entirely on Layer 1 infrastructure stability. The on-chain limit order book architecture introduces potential scalability constraints, and the 10x leverage mechanism creates cascade liquidation risk during flash crashes. LRC presents Zero-Knowledge Rollups implementation complexity and slower protocol iteration relative to emerging competitors. Additionally, LRC's off-chain order matching mechanisms introduce counterparty risk compared to fully on-chain alternatives. Both assets face regulatory uncertainty regarding decentralized derivatives exchanges. Current market conditions (Extreme Fear Index: 20) amplify technical and systemic risks across both protocols.
VIII. Which asset provides better risk-adjusted returns for a diversified portfolio?
Answer: For balanced portfolio construction, LRC offers superior risk-adjusted returns given its 46-exchange accessibility, mature 90.65% supply circulation, positive monthly performance momentum, and lower volatility profile. Allocate 70-80% of DeFi exposure to LRC with 40-50% stablecoin reserves for capital deployment during dislocations. Tactical ZEX allocation (15-25%) captures early-stage supply dynamics and Solana ecosystem momentum without excessive concentration risk. Implement dollar-cost averaging across 3-6 months to reduce timing risk. This balanced approach prioritizes LRC's stability and accessibility while maintaining ZEX exposure to potential upside scenarios, aligning with current Extreme Fear market conditions requiring defensive positioning.
Disclaimer: This analysis is provided for informational purposes only and does not constitute investment advice. Cryptocurrency markets exhibit extreme volatility; actual performance may deviate significantly from forecasts. Current Extreme Fear sentiment (Index: 20) indicates elevated risk conditions. Conduct independent research and consult qualified financial advisors before making investment decisions. Past performance does not guarantee future results.


2025 LUMIA Price Prediction: Future Value Analysis and Market Trends for Investors

2025 RAYPrice Prediction: Analyzing Growth Factors and Market Potential for RAY Token in the Coming Years

2025 RAY Price Prediction: Will This Layer-1 Protocol Reach New Heights in the Evolving DeFi Landscape?

2025 SAROS Price Prediction: Comprehensive Analysis and Future Outlook for the Digital Asset Market

2025 SAROS Price Prediction: Analyzing Future Growth Potential and Market Trends for this Emerging Cryptocurrency

2025 SPrice Prediction: Analyzing Future Market Trends and Investment Opportunities

Is Niza Global (NIZA) a good investment?: A Comprehensive Analysis of Performance, Fundamentals, and Risk Factors

Is Wayfinder (PROMPT) a good investment?: A Comprehensive Analysis of Token Fundamentals, Market Potential, and Risk Factors for 2024
Is Paris Saint-Germain (PSG) a good investment?: Analyzing Financial Performance, Risk Factors, and Long-term Prospects in European Football
Pre-Market Token Pricing Guide: Launch, Airdrop, and Prediction Strategies

Discover the 10 Best Crypto Airdrops of October 2025: Your Ultimate Guide to Free Tokens