Bitcoin Nears $100K as Easing Inflation and Middle East Tensions Fuel Market Momentum
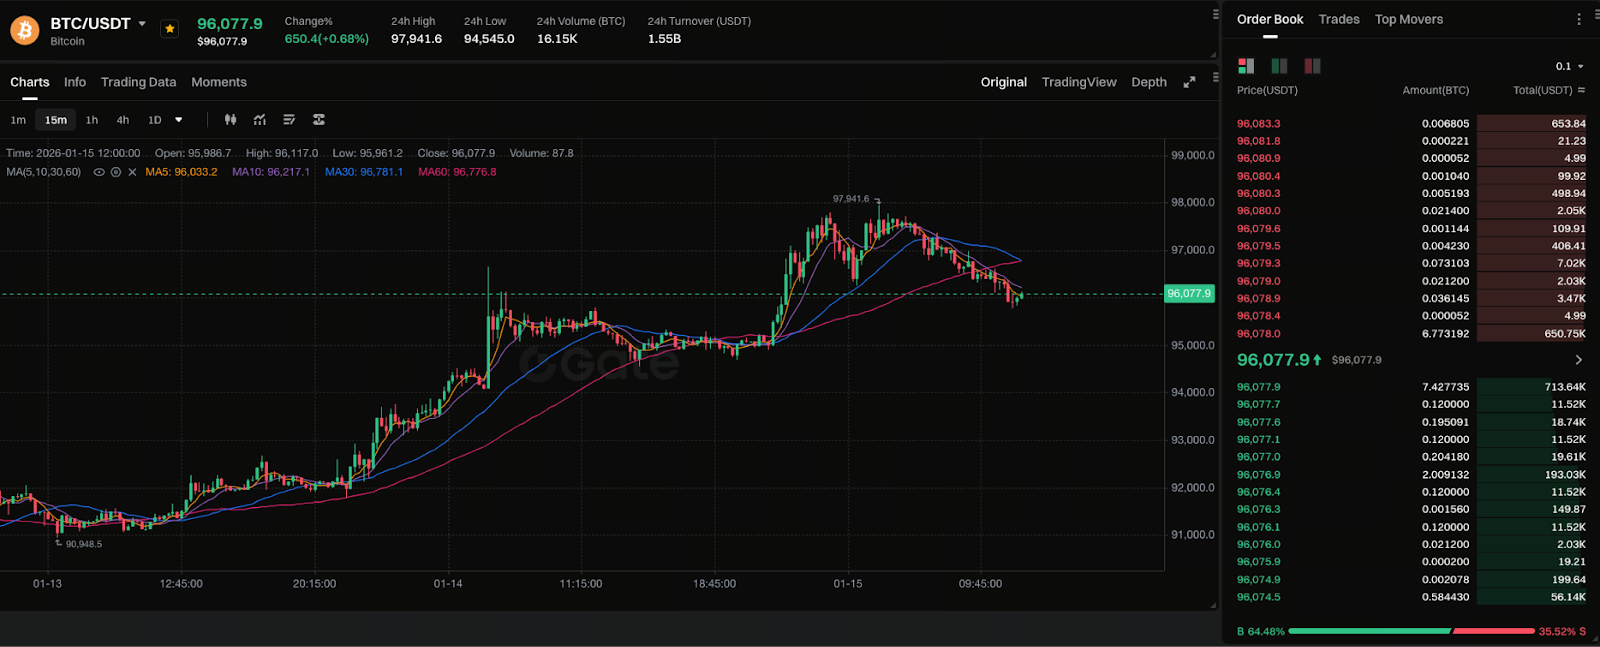
Image: https://www.gate.com/trade/BTC_USDT
As of January 15, 2026, Bitcoin (BTC) trades at around $95,926, near its yearly high, with bullish momentum continuing to build. This latest rally is primarily driven by two macro factors: expectations of easing US inflation and rising tensions in the Middle East.
Global Macroeconomic Forces Driving Bitcoin
Bitcoin’s price is shaped not only by supply and demand but also by macroeconomic sentiment and risk events. The market’s recent focus has been on the latest US inflation data and global geopolitical developments:
- US CPI data shows inflationary pressures are easing, reducing the likelihood of aggressive rate hikes.
- Investors have shifted capital toward risk assets—including stocks and crypto—bringing increased attention to BTC.
A low-inflation environment typically signals that interest rate hikes may be delayed or reversed, and this expectation for looser monetary policy supports risk asset appreciation.
Impact of US Inflation Data on Risk Assets
Recent figures show the US Consumer Price Index (CPI) annual growth rate remains in a low range. This indicates inflationary pressures are easing and, to an extent, lowers the probability of further hikes by the Federal Reserve.
- CPI eases → Less pressure for Fed rate hikes
- Demand for risk assets rises → Bitcoin benefits
- Investors gain confidence in future interest rate direction
As a result, not only BTC but most risk assets have been boosted by these positive factors, including key stock indexes and other cryptocurrencies.
Middle East Tensions and BTC’s Safe-Haven Appeal
Geopolitical conflict often drives markets to seek alternative assets. Recently, escalating tensions between Iran and the US have triggered a flight to safety in global financial markets.
While debate continues over whether Bitcoin serves as a traditional safe-haven like gold, BTC’s decentralized nature has increased its appeal among some investors during regional crises and concerns about capital controls.
Some analysts suggest that in environments marked by currency depreciation or heightened capital controls, crypto assets can provide a measure of value preservation.
Technical Analysis and Key Price Levels
From a technical standpoint, Bitcoin currently faces several critical resistance and support levels:
- Psychological barrier at $100,000 — A breakout could attract additional bullish capital
- Short-term support at $90,000 — Holding this level would reinforce the foundation for further gains
Technical indicators show prices consolidating at two-month highs, helping bulls build confidence.
Market Risks and Potential Future Directions
Despite stronger bullish sentiment, the market still faces several risks:
- Macroeconomic uncertainty: If inflation data strengthens again, expectations for rate hikes may return.
- Policy and regulatory changes: The global regulatory environment remains in flux and may affect mainstream trading activity.
- Technical corrections: If short-term capital takes profits, price volatility may increase.
To better assess future trends, investors should monitor macroeconomic data, exchange inflow/outflow trends, and ETF fund flows.
Core Indicators Investors Should Watch
- US CPI and PPI data
- Federal Reserve interest rate decisions and statements
- Bitcoin holdings and fund flows on exchanges
- Latest geopolitical developments and market sentiment
- Key technical support and resistance levels
By tracking these indicators, investors can better identify the underlying drivers of market volatility.
Share
Content


Related Articles

Gold Price Forecast for the Next Five Years: 2026–2030 Trend Outlook and Investment Implications, Could It Reach $6,000?

Crypto Future Profit Calculator: How to Calculate Your Potential Gains

Crypto Futures Calculator: Easily Estimate Your Profits & Risks

What is Oasis Network (ROSE)?

The $50M Crypto Scam Nobody Is Talking About
