Since the approval of BTC and ETH spot ETFs, daily ETF inflows and outflows have become a key metric for many traders tracking the market.
The rationale is simple: net inflows reflect institutional buying and a bullish stance, while net outflows signal institutional selling and a bearish outlook.
However, the ETF data available each day actually reflects the previous day’s results.
By the time the data is released, price action has often already responded.
Is there a way to anticipate whether today’s ETF flows will be net positive or negative?
There is—the answer is the ETF premium rate.
Verifying this pattern is straightforward. Reviewing January 2026, which is about to conclude, provides a clear example.
As of January 28, there have been 18 trading days in the US equity market this month.
According to statistics, Coinbase’s premium index was positive on only two days, while the remaining 16 days were all in negative territory.
ETF capital flow data shows that out of these 16 days, 11 ended with net outflows.
Particularly, from January 16 to 23, the negative premium rate consistently fell below -0.15%. During this period, ETFs saw over $1.3 billion in net outflows in a single week, and BTC’s price dropped from a peak of $97,000 to around $88,000.
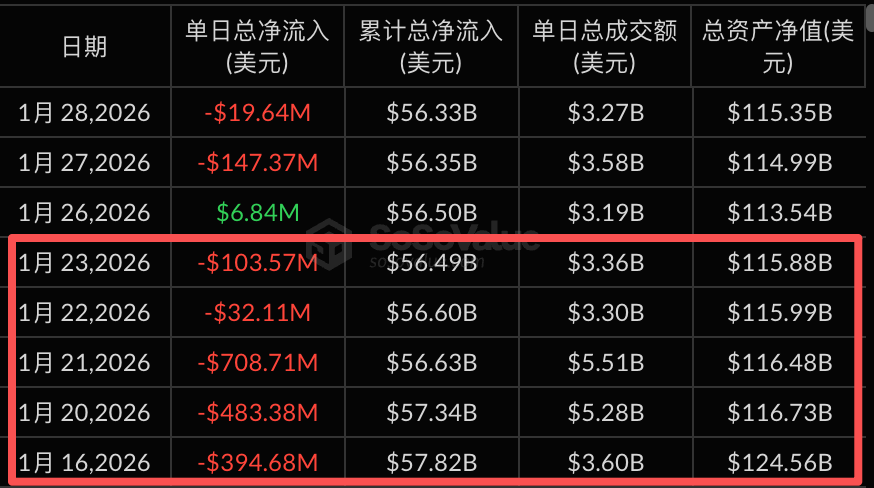
Data source: sosovalue
Let’s take a longer-term perspective.
From July 1, 2025, to January 28, 2026, there were 146 trading days in total.
· Negative premiums appeared on 48 days, with net outflows on 39 of those days—an accuracy rate of 81%.
· Positive premiums appeared on 98 days, with net inflows on 82 of those days—an accuracy rate of 84%.
This illustrates the value of the premium rate: it allows you to spot capital flows before most market participants.
What Is the Premium Rate?
After all this discussion, what exactly is the premium rate?
Consider this analogy.
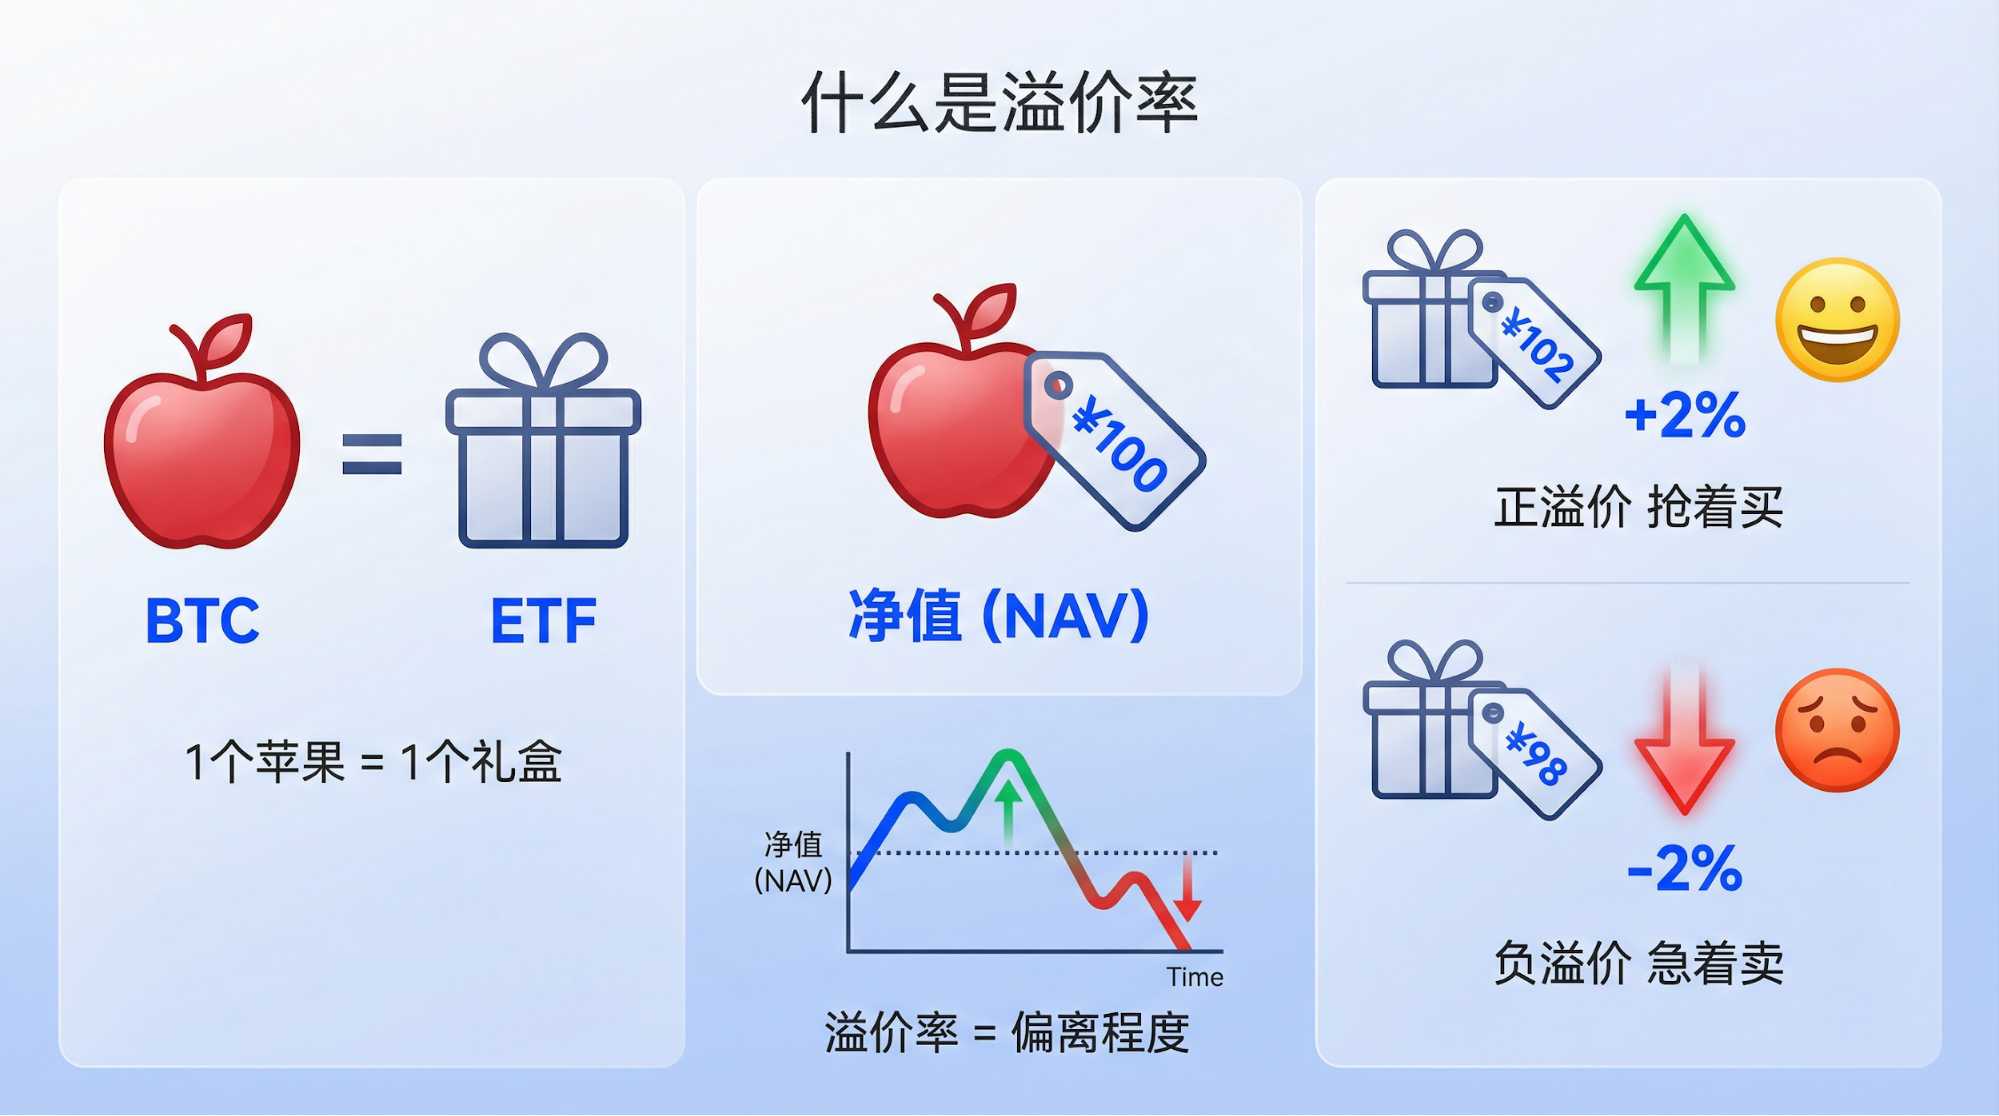
BTC is like loose apples at a farmer’s market, while a BTC spot ETF is like a boxed apple gift set at a supermarket, with each box containing one apple.
If an apple sells for 100 yuan at the market, that’s the net asset value (NAV).
The price of the boxed apple at the supermarket depends on supply and demand.
If demand is strong and the boxed set is bid up to 102 yuan, that’s a positive premium rate of +2%.
If sellers dominate and the boxed set drops to 98 yuan, that’s a negative premium rate of -2%.
The premium rate reflects how much the ETF market price deviates from BTC’s actual price.
A positive premium signals optimistic market sentiment, with buyers rushing in.
A negative premium signals pessimism, with sellers eager to exit.
How Premium Rate Relates to ETF Inflows and Outflows
The premium rate is not just a sentiment indicator—it’s also a crucial driver of capital flows.
The central figure here is the AP, or authorized participant—think of them as privileged market facilitators.
APs operate on a risk-free arbitrage model: they can subscribe to or redeem ETF shares in the primary market and trade them in the secondary market.
Whenever a price difference emerges, APs arbitrage it.
When a positive premium appears and the boxed apple is pricier than the loose apple, APs buy BTC in the primary market, package it into ETF shares, and sell those shares in the secondary market to capture the spread. This process involves buying BTC and results in net inflows.
Conversely, when a negative premium appears and the boxed apple is cheaper than the loose apple, APs buy ETFs in the secondary market, redeem them for BTC, and sell the BTC to profit from the spread. This process involves selling BTC and causes net outflows.
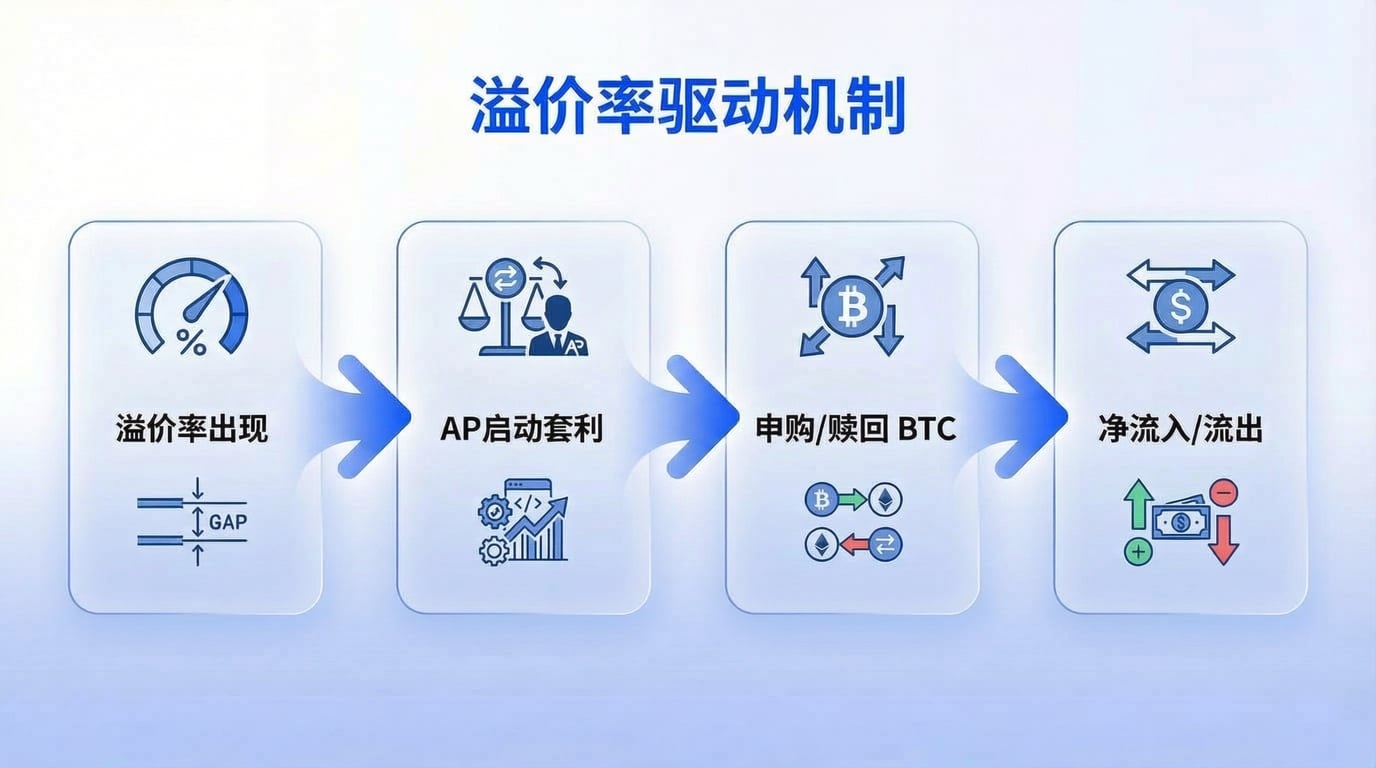
The logic chain works as follows:
Premium rate emerges → APs initiate arbitrage → subscriptions or redemptions occur → net inflows or outflows result.
The ETF capital flow data we see each day is published the day after settlement.
The premium rate is real-time, while capital flow data is delayed.
This is why the premium rate gives you a head start over the market.
How to Use the Premium Rate
Now that we understand the principles linking the premium rate and ETF net flows, how should we incorporate it into our trading strategies?
First, the premium rate should not be used in isolation.
It can indicate the direction of capital flows, but not their scale or persistence.
I recommend combining it with the following dimensions.
1. Consistency Matters More Than Single-Day Premium Rate Values
A single day of negative premium may just be a short-term fluctuation.
But if negative premiums persist for several days, they are likely to correspond with continuous net outflows and warrant caution.
Reviewing the five consecutive trading days from January 16 to 23 this year, persistent negative premiums matched five days of net outflows, with BTC falling nearly 10%.
2. Watch for Extreme Premium Rate Values
Typically, the premium rate fluctuates within a ±0.5% range.
If it breaks through ±1%, this signals a marked shift in market sentiment, stronger AP arbitrage activity, and accelerated capital flows.
3. Assess in Context of Price Levels
Persistent negative premiums at high price levels may indicate early capital flight.
Persistent positive premiums at low price levels may signal bottom-fishing inflows.
The premium rate alone is not a trading signal, but it can help you confirm the current trend or spot a potential turning point early.
Final Notes
To conclude, a few reminders:
No indicator is infallible. The effectiveness of the premium rate depends on the proper functioning of the AP arbitrage mechanism.
In extreme market conditions—such as the sharp drop on October 11—liquidity can dry up, arbitrage mechanisms may fail, and the correlation between premium rate and capital flows can weaken.
Also, the premium rate is just one lens for observing ETF capital trends.
For experienced investors, it’s merely one piece of the puzzle.
It’s best to cross-validate with the following indicators:
- ETF position changes: An increase means institutions are accumulating; a decrease means they’re reducing exposure. This is more direct than the premium rate, but updates are delayed.
- Futures basis and funding rates: A positive basis and persistently high funding rates indicate overheated bullish sentiment and possible over-optimism. The opposite signals bearish dominance.
- Options market Put/Call ratio: Puts are bearish, calls are bullish. A rising ratio signals increased risk aversion; a falling ratio signals dominant optimism.
- Large on-chain transfers and net exchange inflows: Large BTC transfers to exchanges usually mean upcoming selling pressure. Large outflows suggest accumulation.
For example,
If you observe: persistent negative premiums, declining ETF positions, and rising net exchange inflows,
all three signals point in the same direction—capital is leaving, and selling pressure is building.
At this point, at minimum, you should be more cautious and reduce your position, rather than buying the dip.
No single indicator provides the full picture. Only multi-dimensional cross-validation can improve your judgment accuracy.
The more perspectives you monitor in this market, the smaller your information gap becomes—but the timing gap always exists.
Whoever spots the direction of capital first gains the upper hand.
Disclaimer:
- This article is reprinted from [[TechFlow(https://www.techflowpost.com/zh-CN/article/30175)], with all rights reserved by the original author] with copyright belonging to the original author>) [San]. If you have any objections to this reprint, please contact the Gate Learn team, and we will address it promptly in accordance with relevant procedures.
- Disclaimer: The views and opinions expressed in this article are solely those of the author and do not constitute investment advice.
- Other language versions of this article are translated by the Gate Learn team. Do not copy, distribute, or plagiarize the translated article without referencing Gate.


