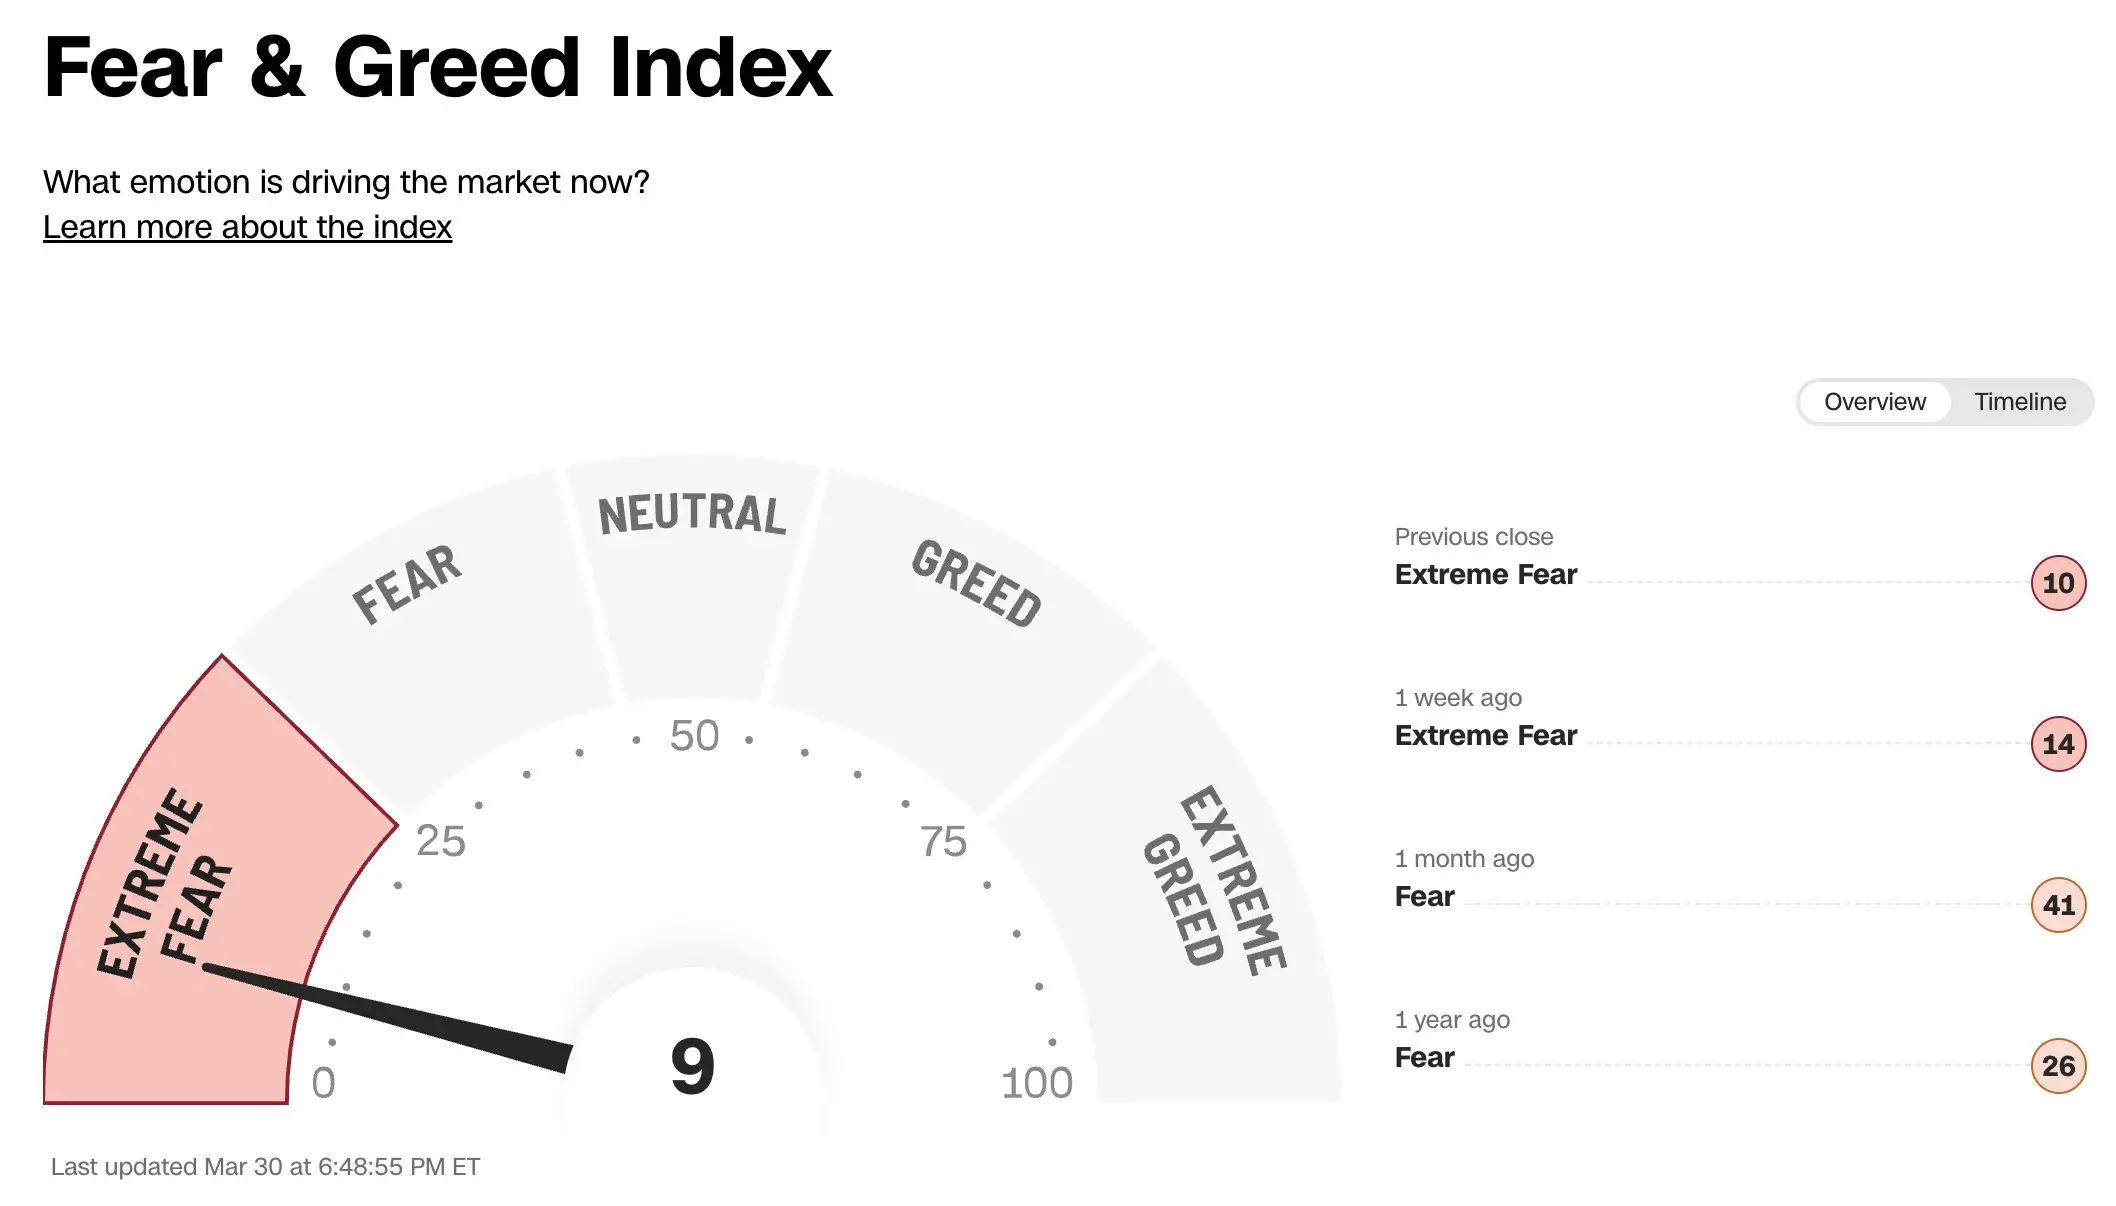
Multiple key market indicators move in sync, showing that Wall Street is facing the most extreme bearish sentiment since 2020. The CNN Fear and Greed Index has plunged to 9, the lowest level since November 2025; the put option trading volume for the S&P 500 ETF (SPY) has surged to 8.6 million contracts. The synchronized extreme readings across multiple indicators suggest that market participants are building crash-scenario hedging positions at an unprecedented pace.
Four Major Extreme Indicators Hit Peaks: A Full Breakdown of Crash Bets
 (Source: The Kobeissi Letter)
According to data compiled by The Kobeissi Letter, the depth and breadth of this round of market bearish sentiment both exceed most of the pullback cycles in recent years. The situation is especially pronounced in the energy sector: the short positions in the Select Sector SPDR ETF (XLE) have jumped to the highest level since the 2008 financial crisis, and in the past few weeks, short positions in the energy industry have doubled—one of the fastest growth rates in this century.
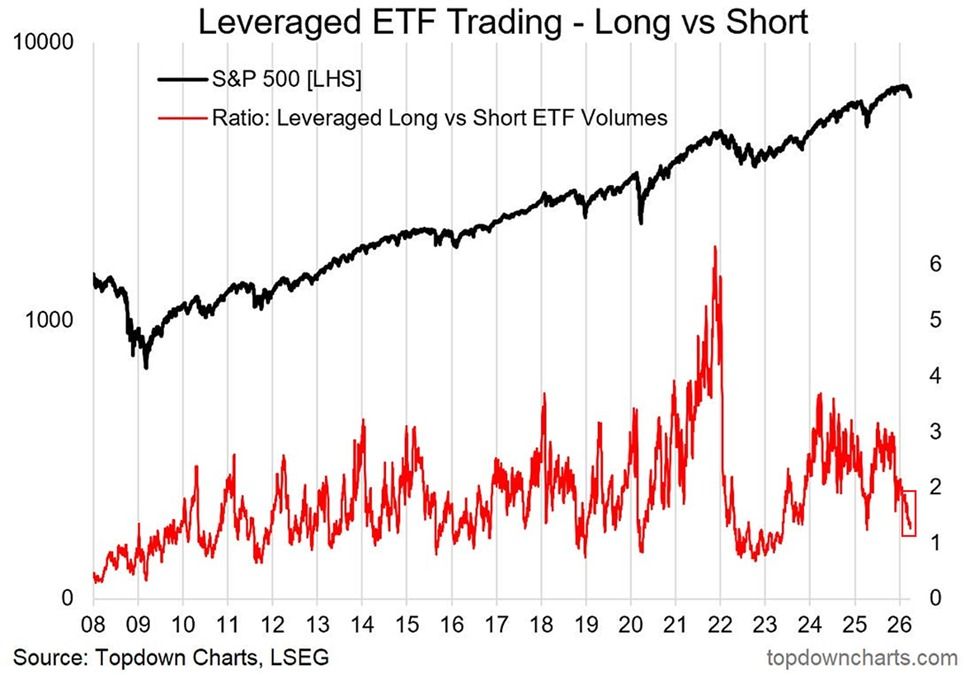
The trading ratio of leveraged long/short ETFs also releases a strong signal. In October 2025, the long/short ETF trading ratio was 3.0, with bullish bets holding a decisive advantage; this ratio has now fallen to about 1.1, meaning the trading volume of leveraged short ETFs is nearly on par with that of long ETFs, approaching the levels seen during the 2022 bear market and the 2020 pandemic lows.
Current Extreme Readings of the Four Major Market Indicators
 (Source: Barchart)
CNN Fear and Greed Index: 9 (lowest since November 2025, in the extreme fear range)
Russell 3000 short position median: 4.3% (15-year high, 1 percentage point higher than the 2022 bear market peak)
XLE energy ETF short positions: highest since the 2008 financial crisis, doubling growth in recent weeks
SPY put option trading volume: 8.6 million contracts (highest since April 2025)
Are Reverse Signals Coming Together? The Historical Precedent and the Complex Play of Current Geopolitics
With a range of extreme indicators—market sentiment, short positions, options hedging, and ETF fund flows—all hitting peaks in tandem, a thought-provoking contrarian question naturally arises from a technical perspective. Historical experience suggests that when market positioning is so lopsided toward pessimism, a sharp reverse reversal is often close at hand. As an example, around the 2008 financial crisis bottom, the long/short ETF trading ratio fell to 0.4, meaning the trading volume of short ETFs was about 150% higher than that of long ETFs—and after the bottom, the market immediately launched a large rebound.
However, The Kobeissi Letter also clearly points out that whether this historical pattern still holds is far from certain, given that geopolitical tensions are escalating and macro headwinds continue to intensify. The ongoing conflict between Iran and the U.S. is pushing oil prices higher, and global supply chains are facing structural pressures; these factors mean the current cycle carries more unpredictable geopolitical variables, so it cannot simply be fitted to the logic of past cyclical reversals.
Frequently Asked Questions
What does a Fear and Greed Index drop to 9 mean for the market?
The CNN Fear and Greed Index measures market sentiment on a scale of 0 to 100, where 0 is extreme fear and 100 is extreme greed. A reading of 9 indicates that the market has entered the highest level of fear, showing investors’ very strong expectations for further declines—an important signal that market sentiment has deteriorated sharply.
Does a new 15-year high in short positions necessarily mean a market crash?
Not necessarily. Extreme short positions are a double-edged sword: if the market continues to fall, short positions profit; but if an unexpected bottoming reversal occurs, large-scale short squeezes (Short Squeeze) can drive a rapid rebound. The challenge right now is that geopolitical uncertainty makes bottoming timing even harder to predict.
How do the current extremes in market sentiment compare with those of 2008 and 2022?
The similarity is that multiple sentiment indicators have reached or are nearing historical extreme levels. The biggest difference is that geopolitical complexity is higher now—an exogenous shock such as an energy supply disruption caused by the Iran–U.S. conflict is not present in a purely macro-policy bear market, which significantly increases the difficulty of forecasting where the market will go.
Disclaimer: The information on this page may come from third parties and does not represent the views or opinions of Gate. The content displayed on this page is for reference only and does not constitute any financial, investment, or legal advice. Gate does not guarantee the accuracy or completeness of the information and shall not be liable for any losses arising from the use of this information. Virtual asset investments carry high risks and are subject to significant price volatility. You may lose all of your invested principal. Please fully understand the relevant risks and make prudent decisions based on your own financial situation and risk tolerance. For details, please refer to
Disclaimer.
