How Prediction Markets Price ETH
The core mechanism of prediction markets is not complicated: participants wager real money on the outcome of a future event, and the trading price of the contract directly reflects the implied probability that the outcome occurs. Unlike traditional polls or expert opinions, prediction markets have a key feature—participants take on real financial risk. This risk constraint means that each quote represents the bettors’ actual beliefs, not just offhand opinions.
In Gate’s prediction market (Event Contracts), contract prices range from 0.01 USDT to 0.99 USDT, directly reflecting the market’s real-time probability estimates for each outcome. A contract priced at 0.65 USDT means the market assigns that outcome an implied probability of about 65%. This “probability equals price” mechanism is precisely why prediction markets can turn dispersed information into quantifiable signals.
As of July 28, ETH is trading in a tight range around $1,880. The probability distribution from the prediction market shows a clear pattern: bearish bets are concentrated around the $1,800 level (41%), while the probability of deeper drops (below $1,700) falls sharply into single digits; for the upside, $2,000 is assigned a 25% probability, but above $2,100 the probabilities quickly converge to 5% and below.
This distribution shape tells a story in itself: the market believes ETH is likely to stay within a $1,700–$2,100 range over the remainder of July, with $1,800 serving as the key line where bulls and bears are in the most direct contest.
Why Capital Treats $1,800 as the Core Battleground
A 41% breakdown probability implies that, at the current $1,880 price level, the market believes the chance of ETH dropping back below $1,800 before the end of July is more than four in ten. This view is not arbitrary—it has clear technical and on-chain support.
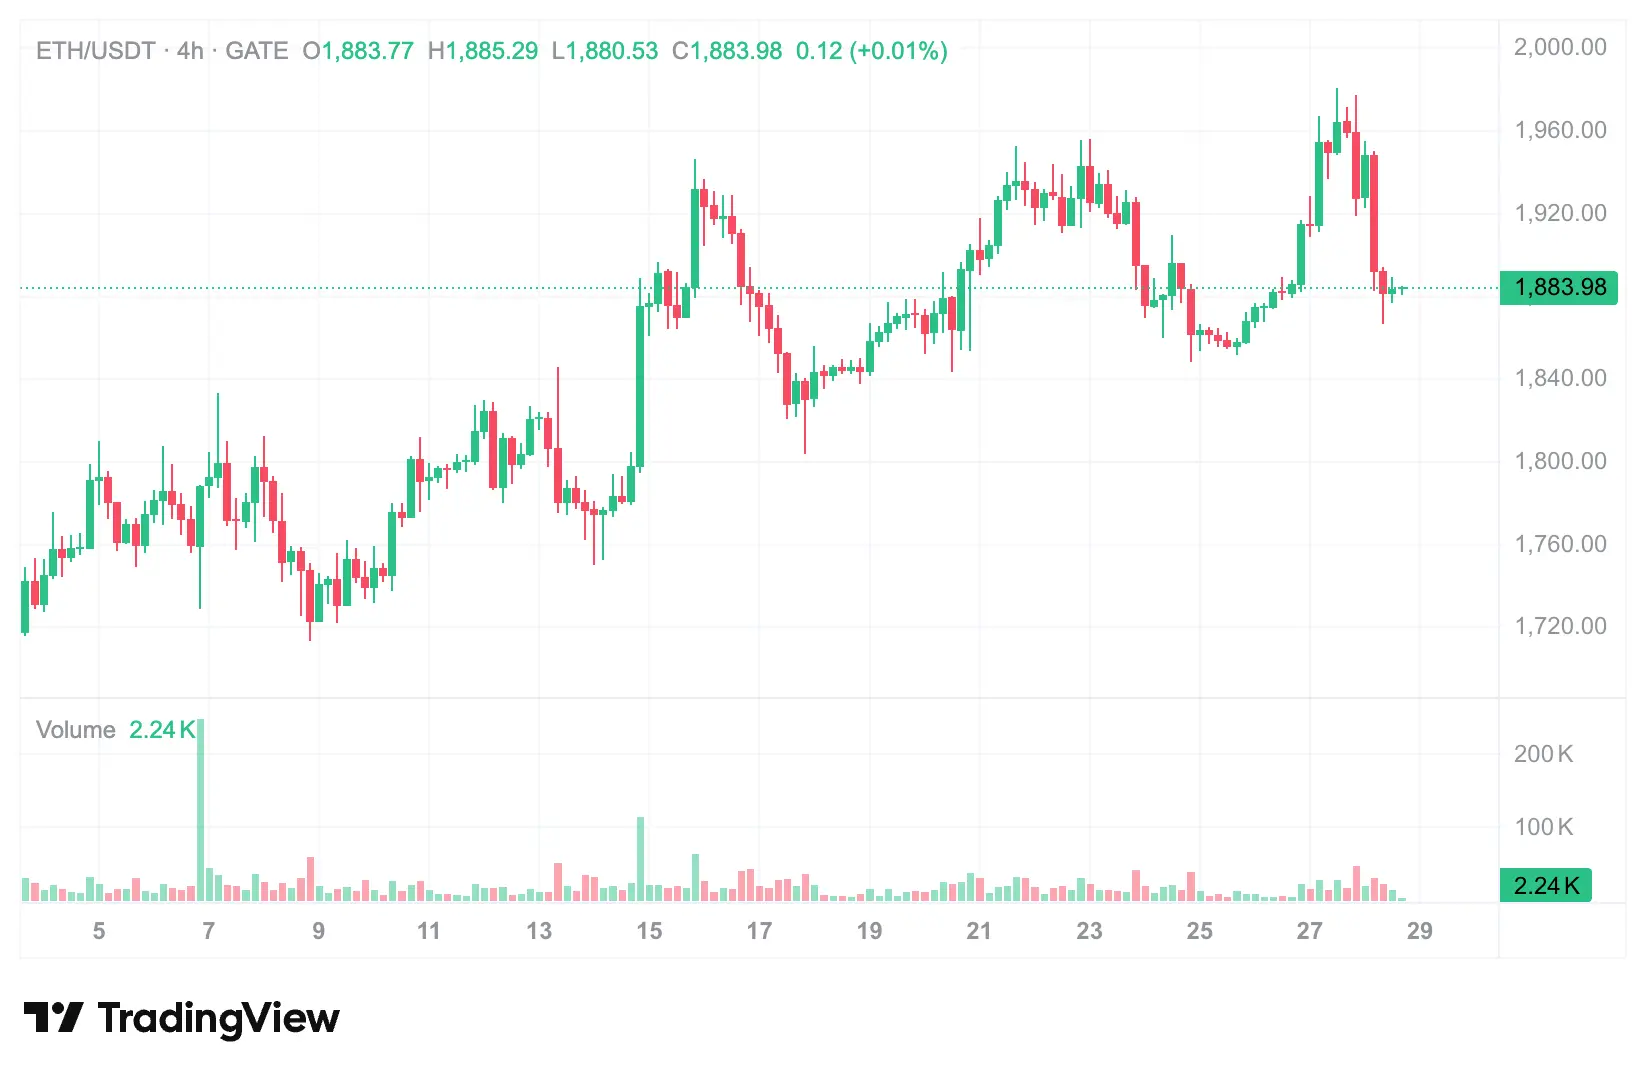
From a technical-structure perspective, $1,800 is the crucial level in this rebound cycle where resistance turned into support. After ETH first tagged $1,800 on July 5, it experienced a pullback, then broke above that level with an upside expansion in a high-volume bullish candle on July 14. Since then, $1,800 has been defended in multiple pullbacks. From a technical analysis standpoint, a support level that is repeatedly tested and successfully held tends to strengthen with each test. However, once that level is effectively broken, it can quickly flip into resistance.
On-chain data provides another reference point. Glassnode data shows that, as of July 25, Ethereum’s on-chain Realized Price is around $2,240. This means the current $1,880 spot price is still about 16% below the network’s overall average cost basis. Many holders are in unrealized losses, which can create potential selling pressure from a psychological standpoint—when price rebounds toward more people’s cost lines, selling to exit positions may become a force that suppresses further upside.
Derivative-market signals are also worth watching. CoinGlass data shows that the ETH perpetual contract funding rate (open interest weighted) is around 0.0028%, and the volume-weighted figure is about 0.0018%, both below a bearish threshold of 0.005%. Funding staying low indicates that longs are not willing to pay a premium to maintain their positions, and overall there isn’t enough chasing demand from derivatives traders to aggressively buy into the move. This sentiment appears especially cautious given that the price has already risen about 30%.
What the 25% Breakout Probability Reveals About Market Expectations
Compared with bearish bets, the 25% probability of breaking above $2,000 is lower than the 41% probability of a breakdown below $1,800, but it is not a number to ignore—it means that a quarter of the market’s capital still believes ETH can hold above this key psychological level over the remainder of July.
There are also positive factors backing this view. From pure price action, ETH’s rebound in July has a relatively complete trend structure: higher highs, higher lows, and support levels that have been repeatedly validated. ETH briefly touched $1,980 on July 27, only one step away from $2,000. That proximity itself sends a signal to the market—$2,000 is not out of reach.
Ethereum ETF flows provide another constructive signal. In the first three weeks of July, Ethereum spot ETFs accumulated total net inflows of about $338 million. As of July 27, the total net asset value of Ethereum spot ETFs reached $10.65 billion, accounting for 4.53% of Ethereum’s total market capitalization. While daily flows can fluctuate, the overall trend throughout July has remained net inflow. This ongoing institutional allocation echoes, to a certain extent, the prediction market’s 25% breakout probability—the stance of longer-term capital is more constructive than short-term betting.
In addition, the ETH/BTC exchange rate saw a monthly rise of about 8.3% in July. Given that ETH has been weaker versus Bitcoin in five of the first seven months of 2026, if this relative strength improvement can persist, it may attract more capital rotating from Bitcoin into Ethereum.
What the Tails of the Bet Distribution Reveal
The value of a prediction market lies not only in pricing the most likely outcome, but also in revealing tail risks.
In the current bet distribution, the probability of ETH dropping below $1,600 is only 2%, and the probability of breaking above $2,200 is only 1%. These two extremely low-probability tail events actually outline the market’s consensus boundaries for the price range of ETH over the remainder of July—$1,600 and $2,200 are treated as extreme scenarios.
Such extremely low probability does not mean these scenarios cannot happen; it means that, under the current set of market information, the catalysts required to trigger them have not yet been priced in. Breaking below $1,600 would mean ETH fully gives back all of July’s gains and prints a new monthly low, which would require a significant negative shock at the macro level (such as an FOMC decision that is more hawkish than expected) or a crypto-specific black swan event. Breaking above $2,200 would require ETH to rise another 17% from the current level within about two weeks, which usually needs powerful fundamental catalysts—for example, a notable acceleration in ETF inflows, a burst of growth in Ethereum network activity, or a broader systematic lift in risk appetite across the crypto market.
It is also worth noting that the prediction market’s probability distribution is not static. As new information enters the market (such as FOMC rate decision outcomes, ETF flow data, changes in on-chain activity, and more), these probabilities are continuously updated. This is the prediction market’s core value as a “real-time information aggregator.”
Cross-Validation Between Prediction Market Probabilities and Traditional Analysis Frameworks
To understand whether the probability distribution is reasonable, it should be cross-validated within a broader market analysis framework.
From seasonal patterns, July has historically been one of the stronger months for ETH. Data from 2020 to 2025 shows that in July when ETH rises, the average gain is about 43%, while in falling Julys the average decline is only about 5%. This asymmetry between up and down moves suggests that ETH’s July performance profile is positively skewed—upside moves are much larger than downside moves. In July 2026 so far, ETH has risen from about $1,615 at the start of the month to around the current $1,880, for a monthly increase of about 16%. Historically, this gain hasn’t yet reached the average level of a “strong July” (43%), but it is also far above the average drawdown of a “weak July” (5%).
From on-chain fundamentals, the Pectra network upgrade has been completed recently, and Lido has initiated the migration of more than 8 million staked ETH (valued at about $16.5 billion) to the new validator architecture. This upgrade is expected to reduce the number of Ethereum validators by about one-third, and reduce witness messages per epoch by 29%. Although these changes do not directly reduce gas fees or accelerate trading, they reflect Ethereum continuously optimizing its underlying architecture. Such technology-level progress is generally viewed as a positive signal for long-term fundamentals.
Comparing these with the prediction market’s probability distribution: the 25% probability of a $2,000 breakout reflects the market’s limited acknowledgment of improving fundamentals—capital recognizes that positive factors exist, but a decisive, overwhelming bullish consensus hasn’t formed yet. The 41% probability of a $1,800 breakdown reflects the market’s emphasis on short-term resistance—technical pressure, cost basis considerations, and derivatives sentiment together form multiple constraints on the path upward.
The Underlying Logic of ETH Price Competition from Capital Bets
Overall, Gate’s current prediction market price probability distribution depicts a clear picture of the battle: around $1,880, ETH faces a choice of direction, and market capital is taking a cautious stance.
The downside is given a higher probability weight (41% for a breakdown below $1,800), but that reflects respect for existing resistance more than panic about a collapse—the probability of deeper drops (below $1,700) falls sharply into single digits. The upside has a lower probability (25% for a break above $2,000), but given that ETH is up about 30% from the lows and has already touched $1,980, this probability still has a plausible path to realization.
The core value of a prediction market is turning fragmented market views into quantifiable probability signals. The 41% breakdown probability does not mean $1,800 “will definitely” be broken; it indicates that, under the current information environment, the market sees the likelihood as slightly lower than “it will not happen.” Similarly, the 25% breakout probability does not mean it is “hard” for $2,000 to be reached; it means the market believes this requires additional catalysts to move.
For market participants, understanding how these probabilities are constructed—what factors are priced in and what factors are not—often matters more than the probability numbers themselves. A prediction market does not provide deterministic answers; instead, it offers a continuously updated probability reference based on capital consensus.
FAQ
Q1: How are prediction market probabilities calculated?
Prediction market probabilities are determined by participants’ actual trading prices. Contract prices fluctuate between 0.01 and 0.99 USDT, directly corresponding to the market’s implied probability estimate of that outcome. For example, a contract priced at 0.65 USDT means the market believes that outcome has an implied probability of about 65%.
Q2: Why is the probability of ETH breaking down below $1,800 (41%) higher than the probability of breaking above $2,000 (25%)?
This reflects how the market is pricing multiple current constraint factors: while $1,800 is a key support level, if it breaks it may trigger stop-losses and liquidations; $2,000 as a psychological threshold requires stronger catalysts to break through. The difference between 41% and 25% itself indicates that the market is more wary of downside risks than it is confident about upside momentum.
Q3: Will the prediction market probabilities change?
Yes. Prediction market probabilities will continuously update as new information enters the market. Major macroeconomic data (such as FOMC rate decisions), changes in ETF flows, fluctuations in on-chain activity, and other factors can all change how the market prices probabilities.
Q4: Can prediction market bets accurately predict price?
A prediction market reflects the collective consensus of current market participants, not a deterministic forecast. Its core value is to quantify fragmented views into observable probability signals, helping market participants understand how “capital is betting,” rather than providing a “correct answer.”
Q5: Where can I view ETH prediction market data?
The Gate platform provides Event Contracts. Users can view prediction market data based on BTC and ETH on this platform, including real-time price probabilities and order-book depth information.