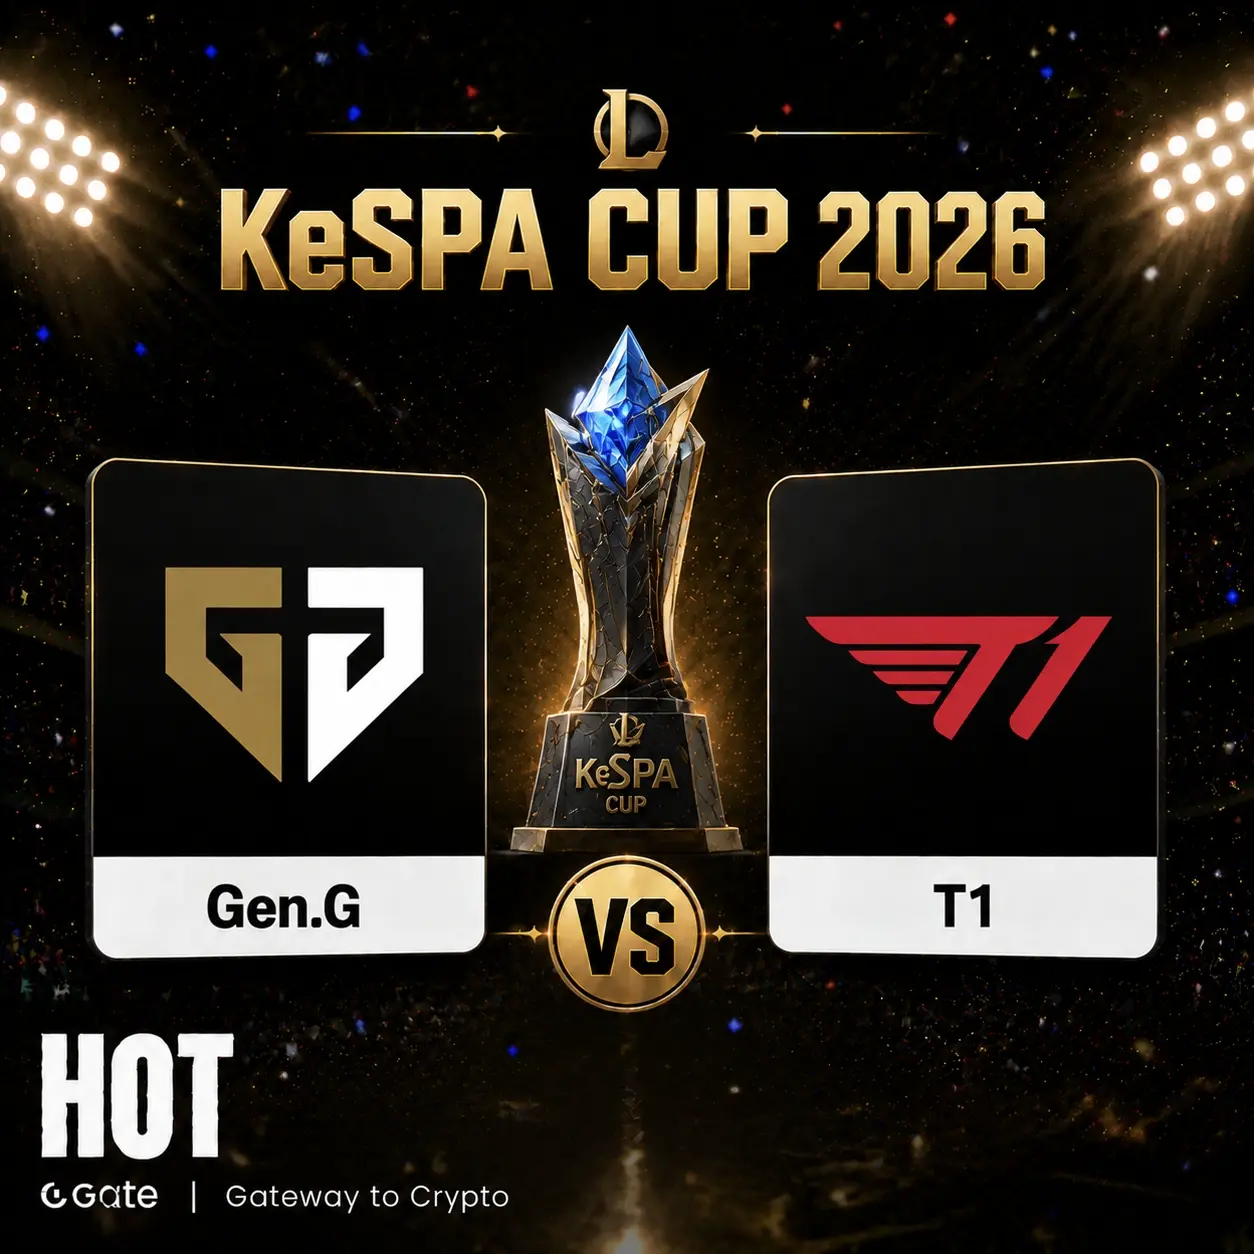
The 2026 summer esports season is now in full swing, with major tournaments like EWC, LPL, and LCK running continuously. Popular esports titles such as LoL, Dota 2, Counter-Strike, and Valorant are all kicking off in turn. Gate has launched a time-limited campaign, “电竞巅峰交易季”. Predict global esports matchups on Polymarket and split 200,000 USDT. During the event, users can register and participate in predictions for specified esports events on Gate Polymarket to unlock prediction market experience vouchers every week; cumulative prediction trading volume can also help you climb the esports prediction trading leaderboard. From single-match outcomes to the final champion, every call has a chance to turn into rewards.
What the capital distribution in the prediction market reflects about expectations
The 64% to 37% win-rate distribution shown by Gate’s prediction market is, in essence, not a simple judgment of “who’s stronger,” but a collective expectation formed by market participants based on the information available to them. At the core of prediction markets is this mechanism: users express their view on an outcome’s probability by buying and selling Event Contracts, and real-time price movements reflect the direction of capital flow and how concentrated that flow is.
A 64% implied probability means that, in the market participants’ view, T1’s chance of winning is about 1.7 times that of Gen.G. This gap represents a significant deviation from the average state in LCK matchups between top teams—out of 43 prior encounters, Gen.G won 26 times and T1 won 17 times. The historical head-to-head tilt does not align with the current market expectation, suggesting we need to look at more recent variables.
As the world’s first centralized trading platform integrated with Polymarket, Gate’s prediction market had cumulative trading volume surpassing $622 million as of July 16, 2026. Features such as the dual-mode trading interface, smart money tracking, and real-time capital flow alerts give users tools to observe market capital movements from multiple angles. In the face of this data, the market’s leaning bets on T1 are obviously not driven by emotion, but by verifiable information.
What differences exist between the two teams’ recent competitive form
To understand the logic behind the capital distribution in the prediction market, the first step is to review the teams’ recent competitive form.
In the League of Legends bronze-medal match at the esports World Cup (EWC) on July 19, 2026, Gen.G and T1 had just faced each other directly. Gen.G defeated T1 2-1, successfully securing the bronze. In the first game, Gen.G top laner Kiin used Vayne to get ten kills and guided the team to an easy win. In the second game, T1 flipped the script with Oner’s Monkey King and Peyz’s Jhin to claw back. In the deciding game, Gen.G ultimately closed it out 2-1.
Looking at broader win-rate data, Gen.G’s current win rate is 80%, while T1’s is 50%. In terms of team rankings, Gen.G is ranked first globally and T1 is ranked fourth. Taken together, these figures point to a clear signal: in both recent direct confrontations and overall performance, Gen.G has held the advantage.
However, the prediction market delivered the opposite direction—T1 is assigned a higher win probability. This contradiction—stronger recent results yet not favored by the market—is the key angle for understanding how prediction markets price trades. The market is not using recent wins and losses as the only basis; it also factors in multiple elements such as roster adjustments, adaptation to the current patch/meta, tactical reserves, and fluctuations in the form of key players.
How do star players’ individual value affect market pricing
In esports, the presence of star players is itself an important market variable. T1 has Faker—an iconic legendary player whom TIME magazine described as “one of the most representative figures in the esports industry.” Faker’s commercial value has long exceeded the competitive layer. A single Google Play brand advertising campaign pays 750 million KRW (about 3.36 million RMB); he holds shares in the T1 team and has endorsement deals with brands such as Nike and Red Bull. T1’s chief operating officer has also been even more explicit that the club aims to reach a $1 billion valuation through expansion across multiple projects and the “Faker halo.”
By comparison, Gen.G’s core player Chovy also has top-tier mechanical skill and competitive level, and is widely rated as the “god of mechanics.” But in terms of commercial influence and global recognition, there is still a gap between Chovy and Faker. Faker is not just a player—he’s a cultural symbol that extends beyond the esports industry.
How does this difference show up in prediction market pricing? On one hand, Faker’s presence means T1 draws more attention and is more “talk-worthy” in any match, which tends to pull more market capital into trades. On the other hand, Faker’s experience in international tournaments—and his “big heart” persona—also creates an “uncertainty premium” in market expectations. In other words, in matchups where outcomes are hard to call, the market tends to favor the side with more experience.
How does club commercial value relate to market attention
The difference between T1 and Gen.G isn’t limited to individual players; it also extends to each club’s overall commercial value and market positioning.
T1 generated revenue exceeding $60 million in 2025, representing year-over-year growth of 80%, and also reached profitability for the first time. The club’s current valuation is about $200 million, with a long-term goal of reaching $1 billion. In terms of disclosed investment scale, T1 ranks first globally among esports clubs at approximately $100 million.
Gen.G’s publicly disclosed investment scale is about $59.4 million. While that figure still places it among the top tier in the esports industry, it’s clearly smaller in magnitude compared with T1. To some extent, this gap reflects the market’s differing assessments of the two clubs’ future growth potential.
Market capital flow and a club’s commercial fundamentals aren’t directly correlated, but they reinforce each other logically. A club with higher commercial value and broader attention typically draws more participants and capital into prediction markets—not only because more people have “heard of” the team, but also because the information ecosystem around that team is richer, giving market participants more充分 grounds to price it.
In addition, Gate has launched real U.S. stock trading services, supporting trading of more than 10,000 U.S. stock tickers. Users can use USDT to trade stocks and ETFs listed on markets like the NYSE and Nasdaq directly. If leading esports clubs go public in the future, their stock performance and prediction market data could create a new kind of linkage—opening up more room for cross-investment between crypto assets and the esports industry.
How do differences in prediction market mechanisms affect pricing logic
The prediction market shows a 64% to 37% win-rate distribution. The data generation mechanism implies that pricing in the prediction market is closer to an expression of “wisdom of the crowd,” rather than an output of a single institution’s viewpoint. Gate’s “smart money” feature lets users track traders with higher win rates—their positions and market judgments. This makes the pricing process more transparent: participants can not only observe the price itself, but also see who is driving the price changes.
In the matchup between Gen.G and T1, the 64% to 37% distribution means the market isn’t making an excessively one-sided bet on a single side. After weighing both teams’ strength, it has formed a differentiated judgment. Although the gap is significant at nearly 30 percentage points, 37% of the capital still backs Gen.G. This suggests the market doesn’t treat T1’s victory as a certainty; it also believes Gen.G has a meaningful chance to win.
Industry trends and expansion space for esports prediction markets
The Gen.G vs T1 matchup is only one snapshot of esports prediction markets. During the 2026 World Cup, prediction market trading volume surged dramatically, confirming the strong boost effect that sports events have on prediction market growth. Gate prediction market has already launched predictions for popular events, including the 2026 KeSPA Cup League of Legends event. From $138k in 2022 to $4.28 billion in 2026, the four-year growth curve shows a typical exponential pattern.
Esports has special characteristics: high event frequency, clearly binary outcomes, and audiences with a high overlap with crypto users. These traits make esports a naturally compatible use case for prediction markets. As platforms like Gate continue to lower the barrier to participation—gas-free, no wallet needed, no cross-chain needed—esports prediction markets are expected to move from the current early stage toward broader mass adoption.
For users focused on the intersection of esports and crypto assets, understanding prediction market pricing logic, tracking smart money capital flows, and focusing on top teams’ competitive form and commercial fundamentals together form three core dimensions for participating in this emerging market.
Frequently Asked Questions (FAQ)
Q1: How is the win-rate data in Gate prediction markets generated?
Win rates in prediction markets are determined by market prices formed when users trade Event Contracts. Users use USDT to participate in predictions, and price fluctuations are reflected in real time as the collective judgment of market participants about the likelihood of the event occurring.
Q2: Gen.G recently beat T1—why does the prediction market favor T1 instead?
Prediction market pricing takes multiple factors into account comprehensively, including recent performance, player form, roster depth, tactical reserves, as well as the commercial impact and market attention of key players. The result of a single match isn’t enough to overturn the market’s overall assessment of the teams’ strength.
Q3: How can I participate in esports prediction markets on Gate?
Users can go to the Polymarket page from the Alpha section on the Gate App homepage and use USDT in their account to participate in 热门电竞赛事预测. The platform supports a dual-mode trading interface. Beginners can use probability and odds mode, while professional users can use tools such as an order book and candlestick charts.