Trade
Basic
Futures
Futures
Hundreds of contracts settled in USDT or BTC
TradFi
Gold
Trade global traditional assets with USDT in one place
Options
Hot
Trade European-style vanilla options
Unified Account
Maximize your capital efficiency
Demo Trading
Futures Kickoff
Get prepared for your futures trading
Futures Events
Participate in events to win generous rewards
Demo Trading
Use virtual funds to experience risk-free trading
Earn
Launch
CandyDrop
Collect candies to earn airdrops
Launchpool
Quick staking, earn potential new tokens
HODLer Airdrop
Hold GT and get massive airdrops for free
Launchpad
Be early to the next big token project
Alpha Points
Trade on-chain assets and enjoy airdrop rewards!
Futures Points
Earn futures points and claim airdrop rewards
Investment
Simple Earn
Earn interests with idle tokens
Auto-Invest
Auto-invest on a regular basis
Dual Investment
Buy low and sell high to take profits from price fluctuations
Soft Staking
Earn rewards with flexible staking
Crypto Loan
0 Fees
Pledge one crypto to borrow another
Lending Center
One-stop lending hub
VIP Wealth Hub
Customized wealth management empowers your assets growth
Private Wealth Management
Customized asset management to grow your digital assets
Quant Fund
Top asset management team helps you profit without hassle
Staking
Stake cryptos to earn in PoS products
Smart Leverage
New
No forced liquidation before maturity, worry-free leveraged gains
GUSD Minting
Use USDT/USDC to mint GUSD for treasury-level yields
More
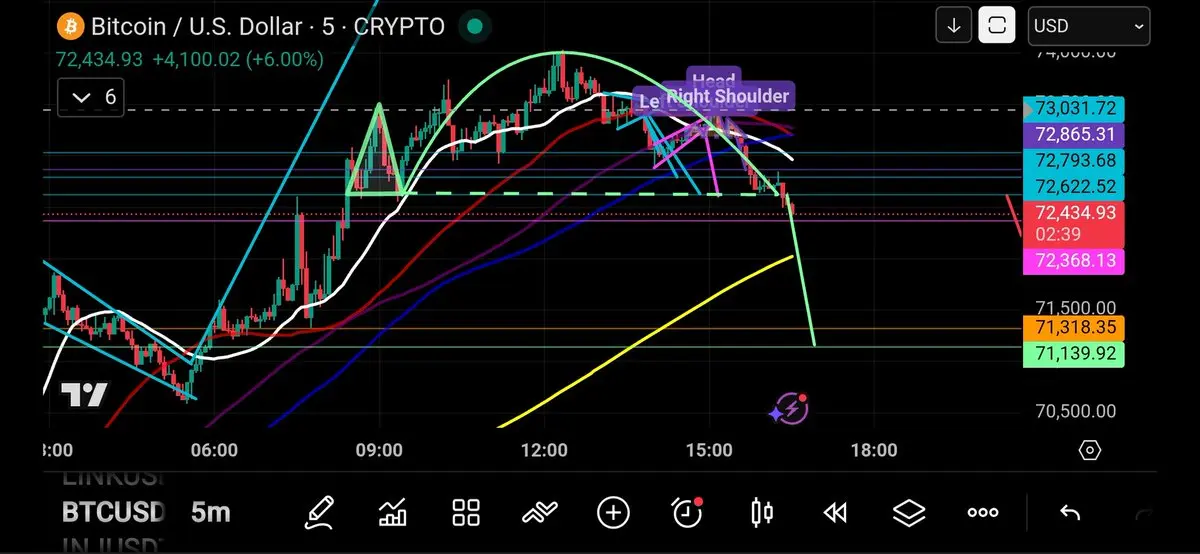
As discussed earlier in a previous post the head and shoulder could breakdown early and turn into a Adam and Eve double top.
Same target...
Same target...
- Reward
- like
- Comment
- Repost
- Share
zy
zy
Created By@GateUser-2432a2dc
Listing Progress
0.00%
MC:
$2.48K
More Tokens
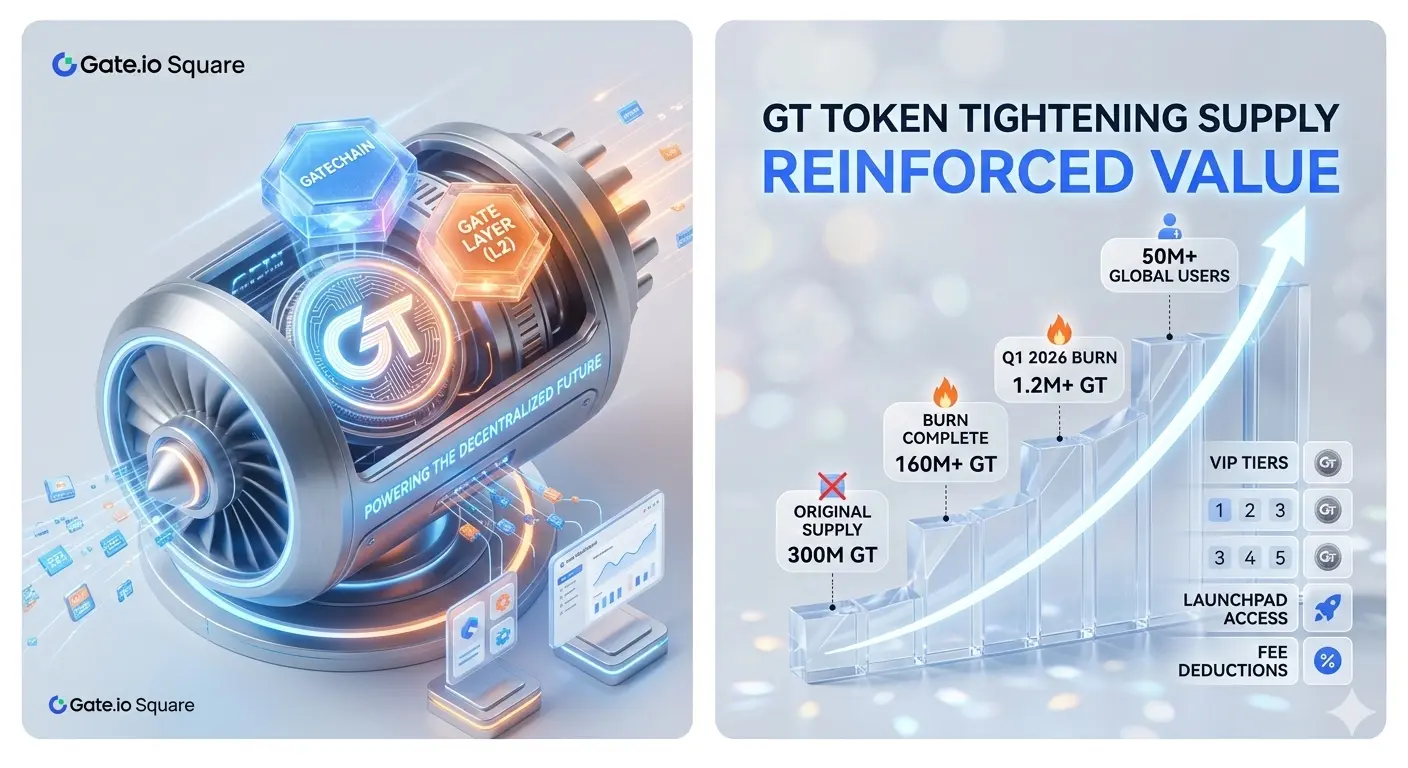
GateToken (GT): The Engine of the Gate.io Ecosystem
GateToken (GT) remains a cornerstone for traders in 2026, offering much more than just fee discounts. As the native asset of the GateChain and the newer Gate Layer (L2), GT is the primary gas token powering a high-performance decentralized future.
Currently trading around the $6.90–$7.10 range, GT's value is reinforced by a aggressive quarterly burn mechanism. Having already burned over 60% of its original supply, the Q1 2026 burn is expected to further tighten circulating supply. With Gate.io surpassing 50 million users, the demand for GT—dr
GT4.76%

- Reward
- like
- Comment
- Repost
- Share
- Reward
- 4
- 5
- Repost
- Share
GateUser-de1ccc48 :
:
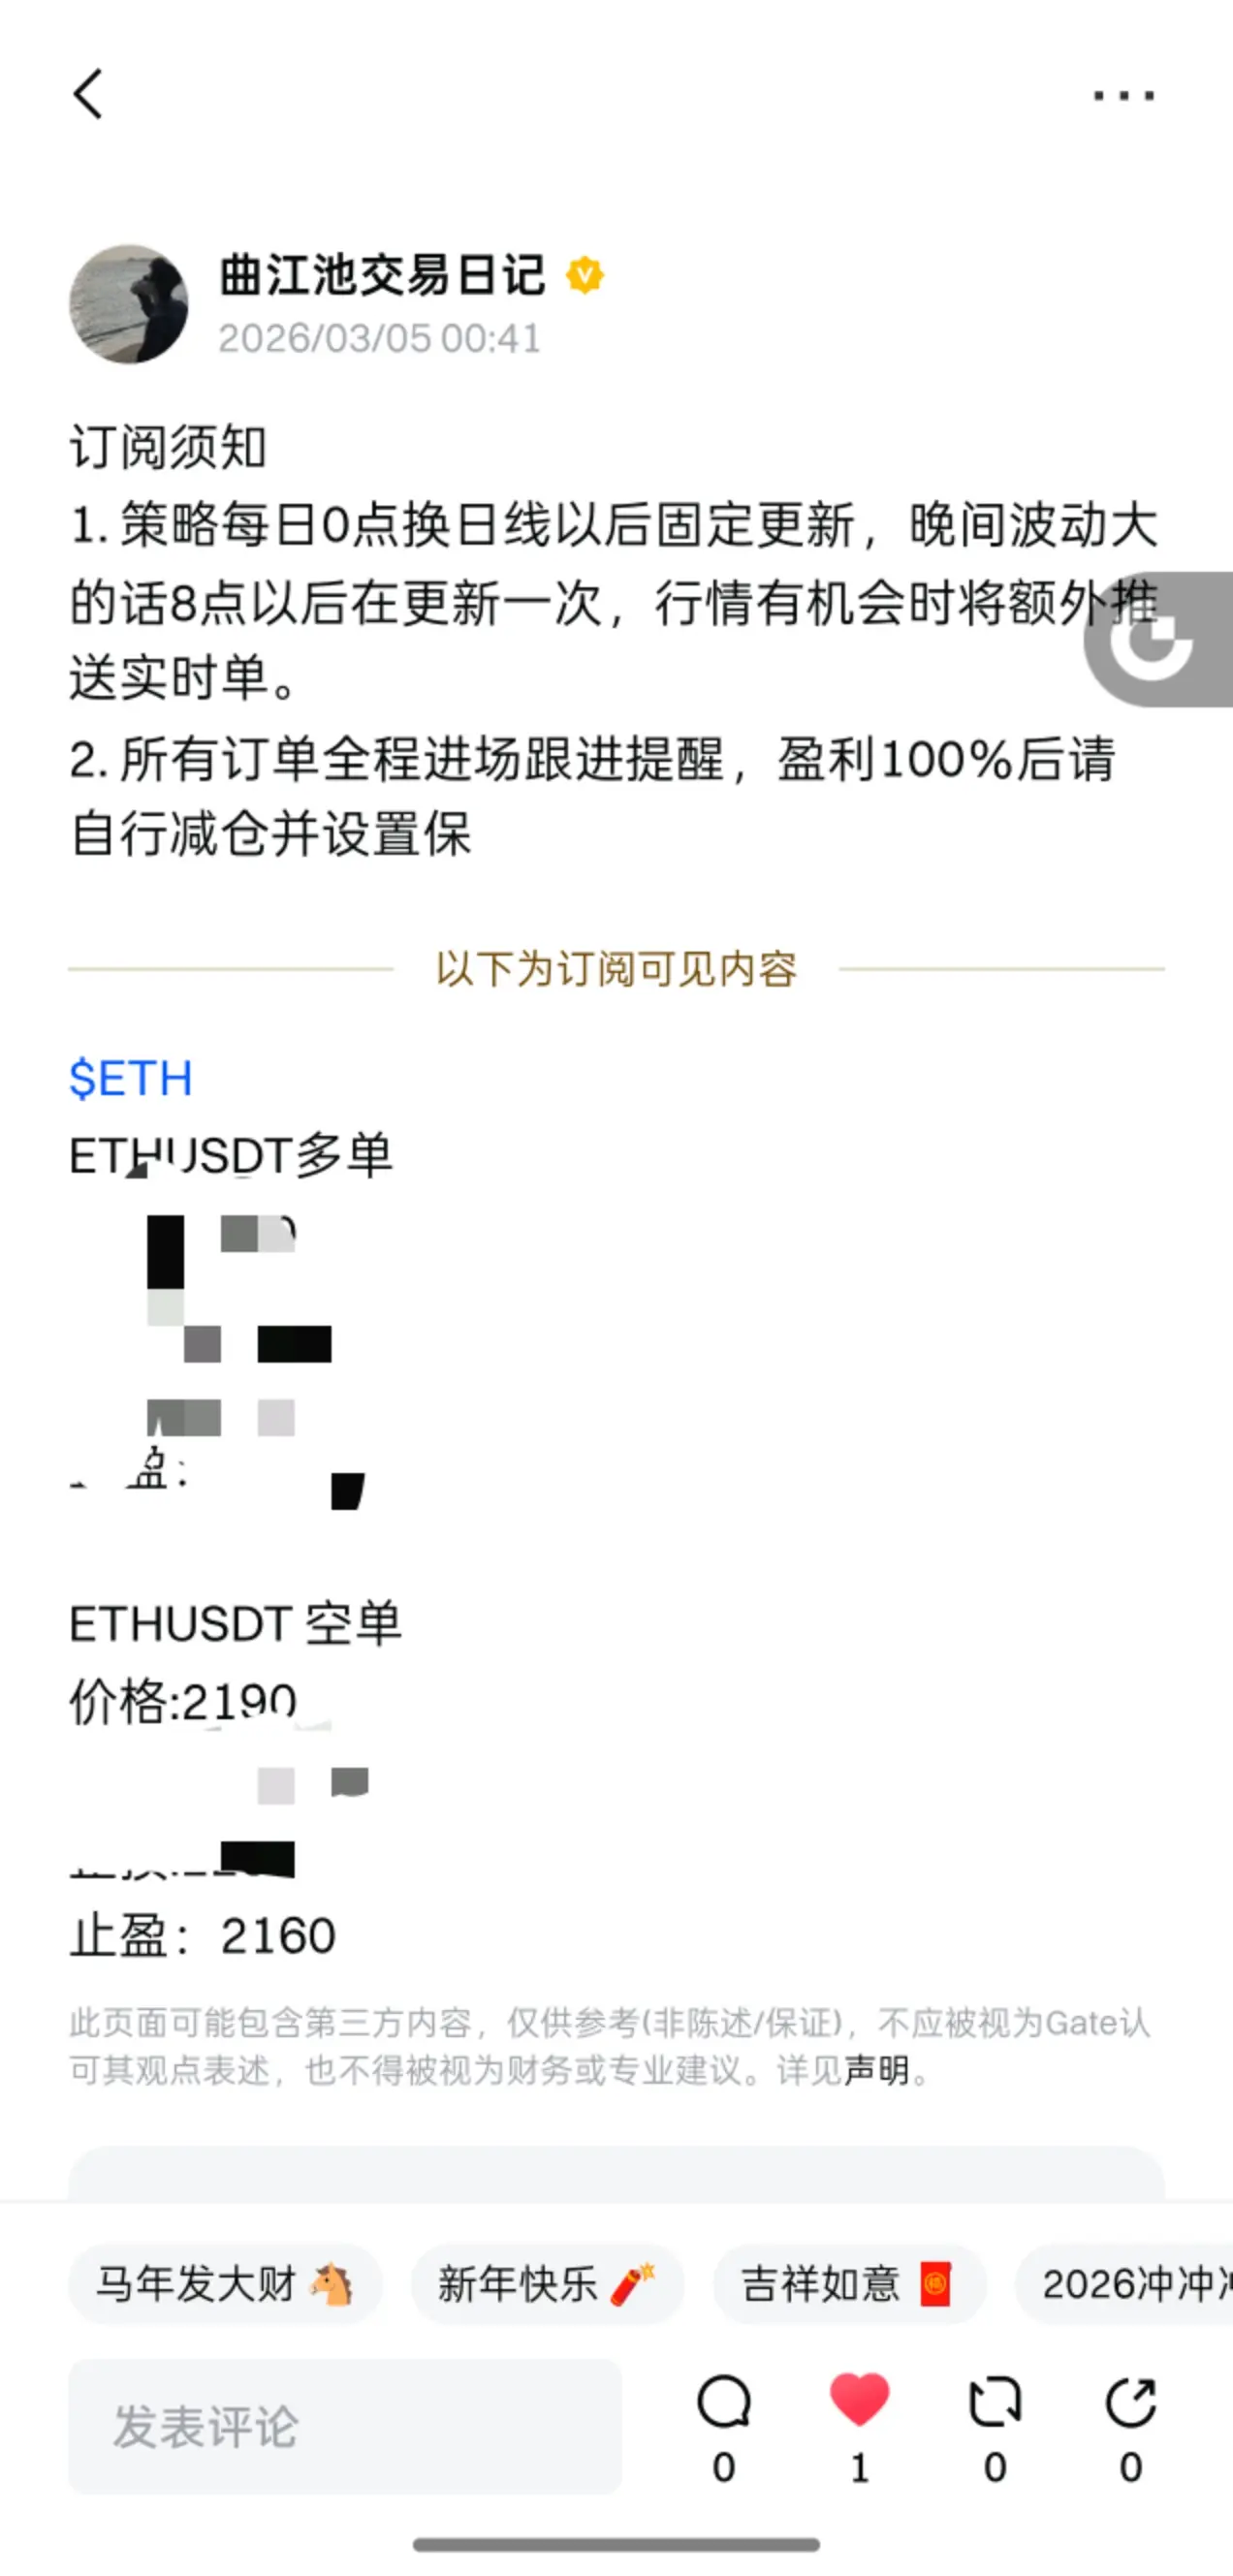
I'm also in Qujiang.View More
- Reward
- like
- Comment
- Repost
- Share
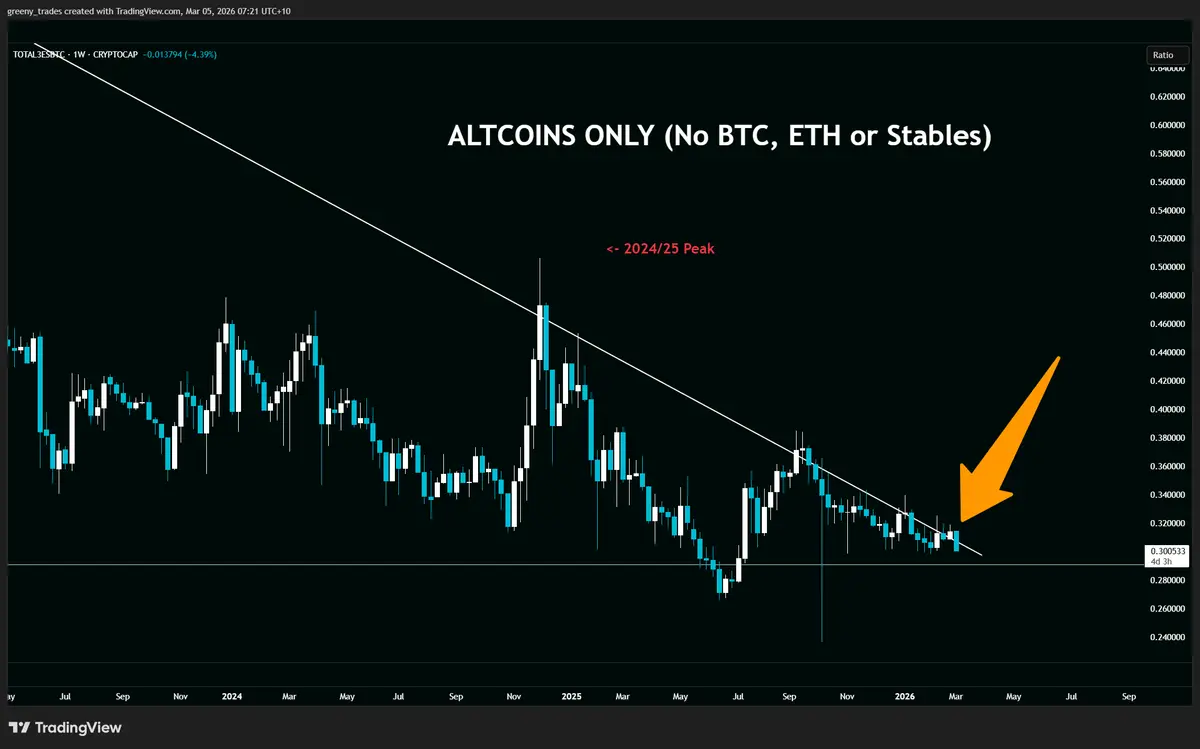
What happened to all the altcoin bulls calling for the next altcoin season? Fakeout was inevitable here.
- Reward
- like
- Comment
- Repost
- Share
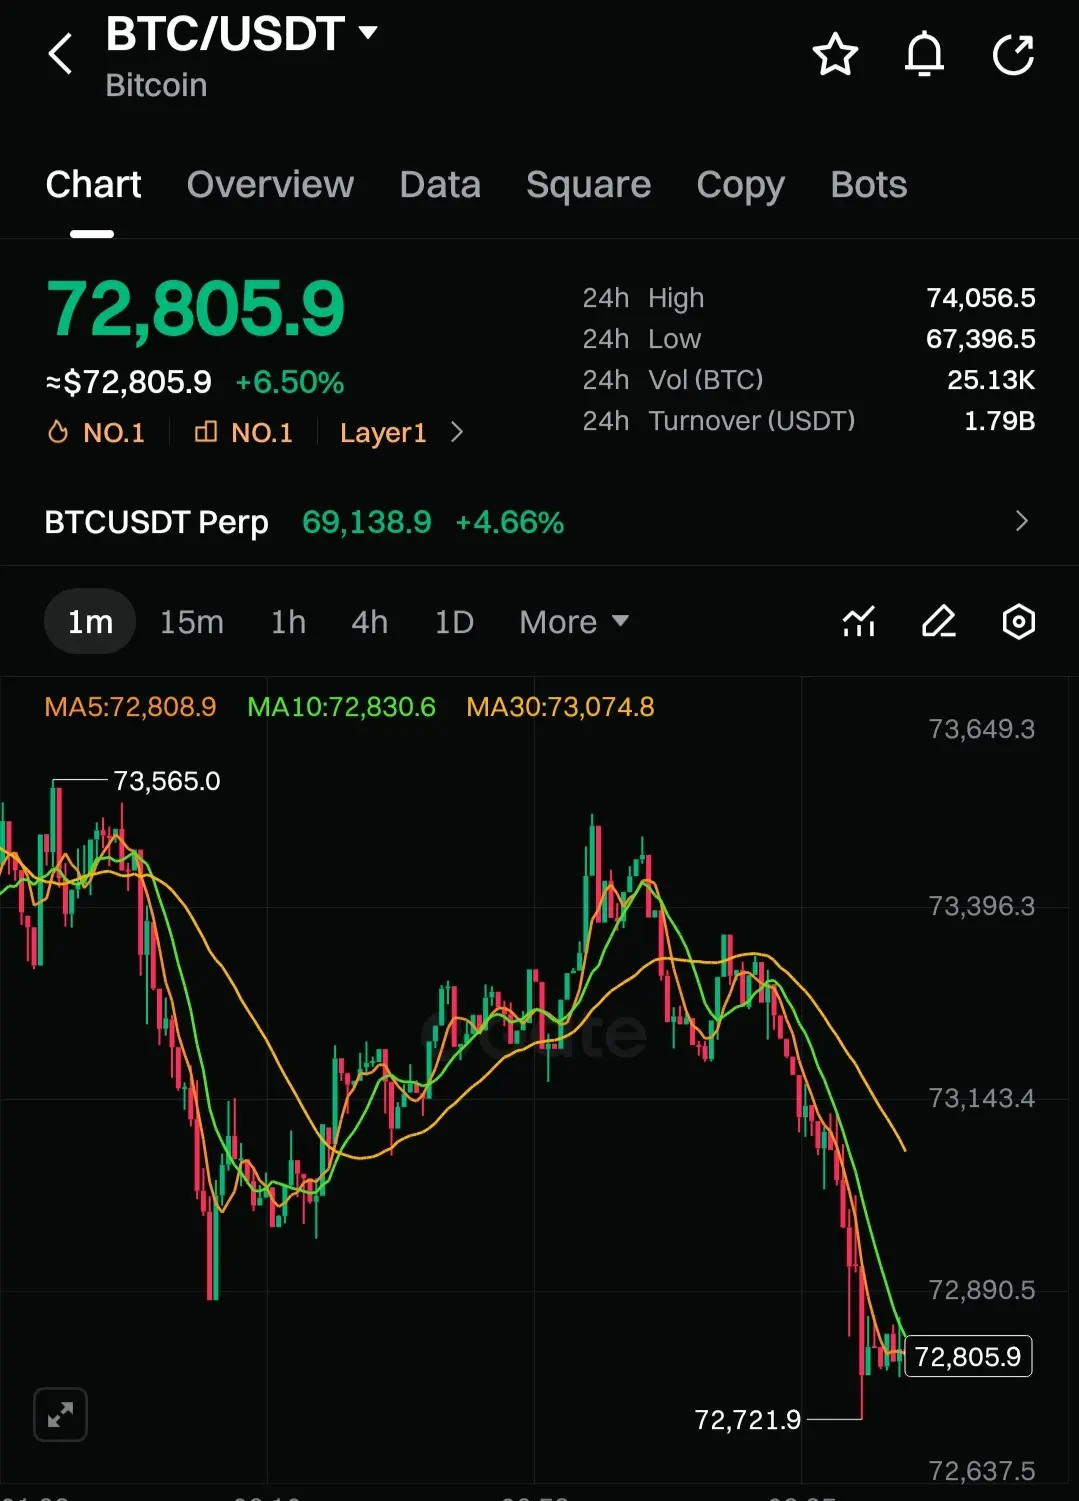
Just checked $BTC it’s trading around $72,805.9 USD. Honestly, that feels like a massive swing after the recent dip either the market’s pulling a surprise rebound, or the price has moved way past your expected entry.
.Right now, I’d lean very cautiously: this doesn’t feel like a quick pump play…more like a move you watch if you believe in its long‑term momentum. But unless there’s a fresh catalyst, I wouldn’t go all in.
#BTC #Rmj-Trades
.Right now, I’d lean very cautiously: this doesn’t feel like a quick pump play…more like a move you watch if you believe in its long‑term momentum. But unless there’s a fresh catalyst, I wouldn’t go all in.
#BTC #Rmj-Trades
BTC6.31%
- Reward
- like
- Comment
- Repost
- Share

In the crypto market, approximately $424 million worth of short positions were liquidated in the last 12 hours. This development stands out as a strong short squeeze triggered by Bitcoin's (BTC) sudden rise.
According to data platforms like Coinglass, Bitcoin's price recently rose rapidly, surpassing the $68,000 level and even approaching $70,000. This rise caught investors who had opened bearish positions off guard and led to large-scale liquidations. Short positions were heavily wiped out, especially in major coins such as Bitcoin, Ethereum (ETH), and Solana (SOL). While some sources state t
According to data platforms like Coinglass, Bitcoin's price recently rose rapidly, surpassing the $68,000 level and even approaching $70,000. This rise caught investors who had opened bearish positions off guard and led to large-scale liquidations. Short positions were heavily wiped out, especially in major coins such as Bitcoin, Ethereum (ETH), and Solana (SOL). While some sources state t
- Reward
- 14
- 11
- Repost
- Share
kader1 :
:
To The Moon 🌕View More
am gonna try my best and do what I know best and may the road ahead be a great lesson and a great journey full of blessing and love

- Reward
- like
- Comment
- Repost
- Share
ZCASH
ZERO CASH
Created By@CoreDao2.0
Listing Progress
0.00%
MC:
$2.54K
More Tokens
Ethereum Foundation releases a seven-year roadmap: 7 forks by the
572
- Reward
- like
- Comment
- Repost
- Share
Never underestimate how low a coin can go

- Reward
- like
- Comment
- Repost
- Share
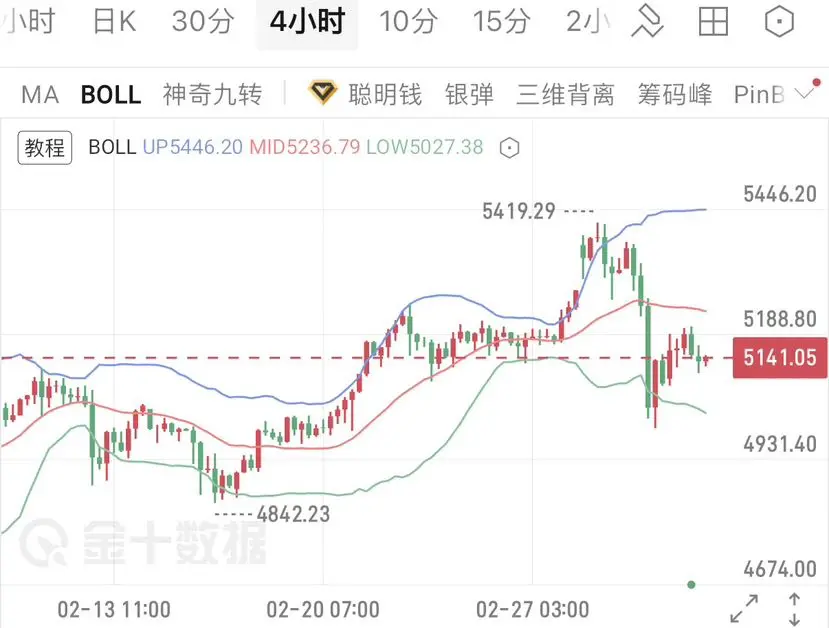
Recently, gold surged to around 5419 before starting to pull back, then plummeted on Tuesday, with a low of 4997. This pattern is consistent with previous declines last year, where the technical performance showed a drop to near the middle Bollinger Band on the daily chart, followed by repeated tests and trend reversal leading to an upward move. Currently, the close is at 5141, with the rebound nearly halving the previous decline. It is basically confirmed that this round of correction is complete, and a cyclical rally is beginning.
The daily chart has already closed with a positive candle,
View OriginalThe daily chart has already closed with a positive candle,

- Reward
- like
- Comment
- Repost
- Share
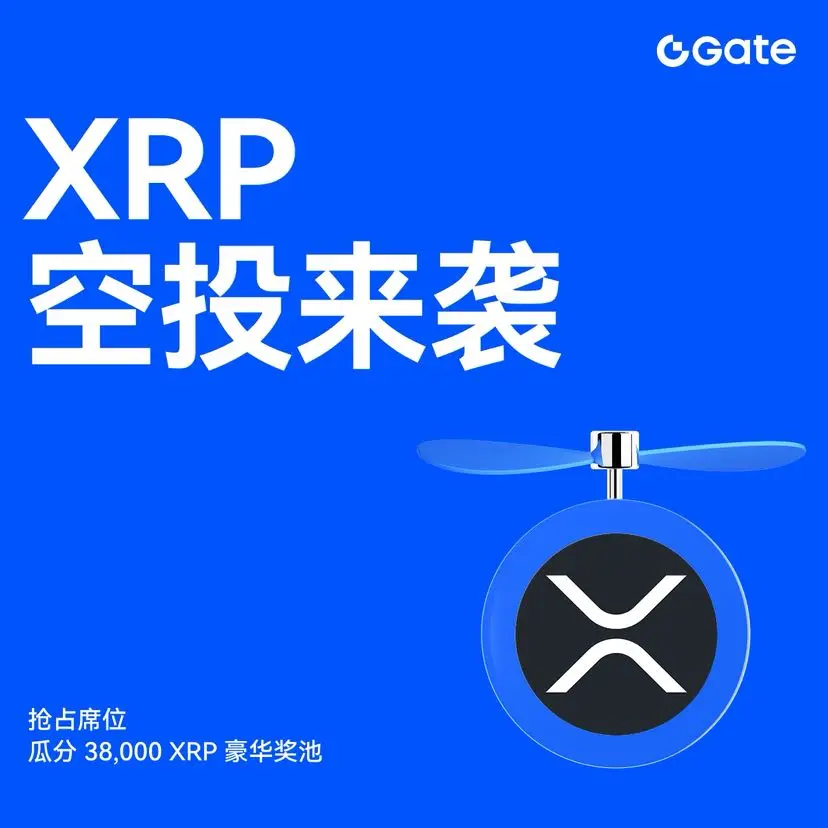
XRP Market Rebound, Airdrops in Full Swing
Seize the opportunity in volatile markets, earn up to 100 XRP per person
🔥 Four Major Incentive Programs Launch Simultaneously
Trading · Holding · Contracts · Invitations, multiple ways to continuously earn XRP airdrops
🚀 Take advantage of the market rebound to participate, rewards are being distributed
👉 Event Link: https://www.gate.com/campaigns/4132
📄 Details Link: https://www.gate.com/announcements/article/49946
XRP4.99%
- Reward
- like
- Comment
- Repost
- Share
Bloomberg posted on X, highlighting the clarity emerging from investment decisions made over the past 5 to 10 years. As these choices mature, their outcomes are becoming increasingly evident, providing insights into their effectiveness and impact on financial markets. Investors are now able to assess the long-term viability and success of their strategies, reflecting on the foresight and planning involved in their initial decisions. This period of evaluation offers valuable lessons for future investment approaches, emphasizing the importance of strategic planning and patience in financial deci

- Reward
- like
- Comment
- Repost
- Share
Yichen: Pullback to Gather Strength, Bullish Reversal Window Opens
After a deep correction yesterday, a strong rebound was seen, demonstrating the resilience of the bulls. The four-hour gold price has stabilized and rebounded from the lower support level. The MACD green bars are narrowing, indicating weakening bearish momentum, and the short-term rebound has the potential to continue.
From a fundamental perspective, ongoing global geopolitical conflicts continue to intensify safe-haven demand. Coupled with persistent gold purchases by central banks around the world, this provides a solid botto
View Original
- Reward
- like
- Comment
- Repost
- Share
Human joys and sorrows are not shared! NaNa says the US stock market (2026.03.04)
View Original- Reward
- like
- Comment
- Repost
- Share
Load More
Join 40M users in our growing community
⚡️ Join 40M users in the crypto craze discussion
💬 Engage with your favorite top creators
👍 See what interests you
Trending Topics
View More310.24K Popularity
93.83K Popularity
191.09K Popularity
19.08K Popularity
416.7K Popularity
News
View MoreElon Musk Testifies in Court Over Market Manipulation Lawsuit During Twitter Acquisition
1 m
a16z Crypto is raising $2 billion for its fifth fund
13 m
The world's largest gold ETF holdings decreased significantly by 18 tons in a single day
19 m
Data: 930 BTC transferred from an anonymous address, then routed through a relay and sent to another anonymous address
28 m
TradFi上涨提醒:NAS100上涨超1.5%
58 m
Pin