Futures
Access hundreds of perpetual contracts
TradFi
Gold
One platform for global traditional assets
Options
Hot
Trade European-style vanilla options
Unified Account
Maximize your capital efficiency
Demo Trading
Introduction to Futures Trading
Learn the basics of futures trading
Futures Events
Join events to earn rewards
Demo Trading
Use virtual funds to practice risk-free trading
Launch
CandyDrop
Collect candies to earn airdrops
Launchpool
Quick staking, earn potential new tokens
HODLer Airdrop
Hold GT and get massive airdrops for free
Pre-IPOs
Unlock full access to global stock IPOs
Alpha Points
Trade on-chain assets and earn airdrops
Futures Points
Earn futures points and claim airdrop rewards
PHB Critical Turnaround! 0.18 becomes the life-and-death line, is the main force shaking out or a sign of a waterfall? In-depth analysis on April 19
Current Price: 0.1858
PHB’s current trend has entered a very critical stage—unlike mainstream coins that are oscillating at high levels, it resembles a “second divergence zone after a rally”. This structure often determines whether the price will continue to double or be cut in half directly.
Let’s proceed with the structural analysis.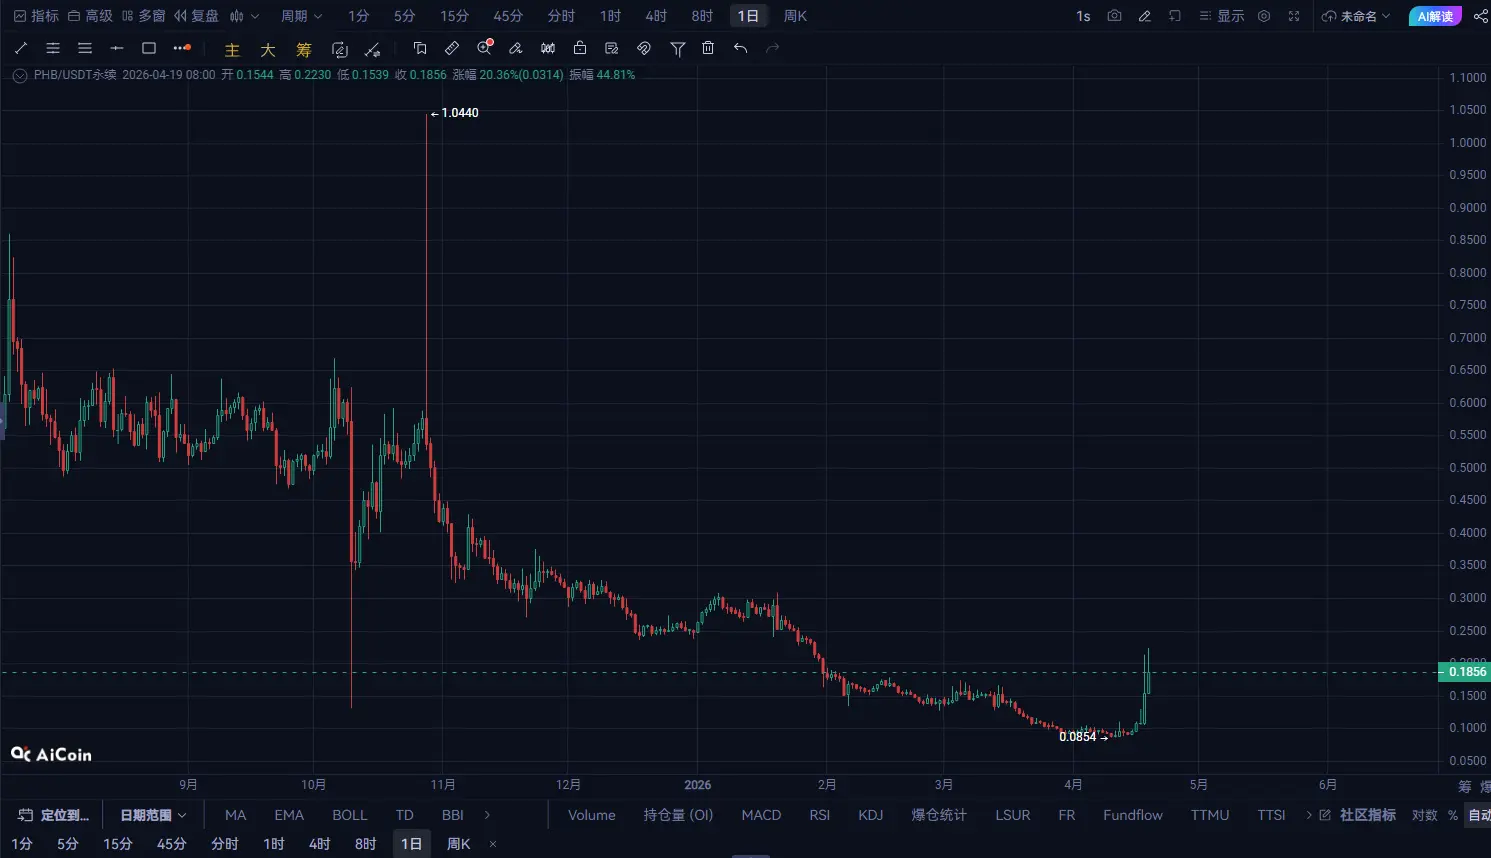
From the daily perspective, PHB previously experienced a clear rally, now entering a consolidation phase:
Highs are no longer rising rapidly, showing sideways oscillation K-line bodies are shrinking, with more upper and lower shadows → clear bullish-bearish divergence MACD red bars are shortening, momentum is waning RSI has fallen from high levels to a neutral zone
Key levels:
Strong support: 0.170 Defense level: 0.155 Resistance level: 0.205
Conclusion: The daily chart still shows a bullish structure, but has shifted from “offensive” to “consolidation + shakeout”.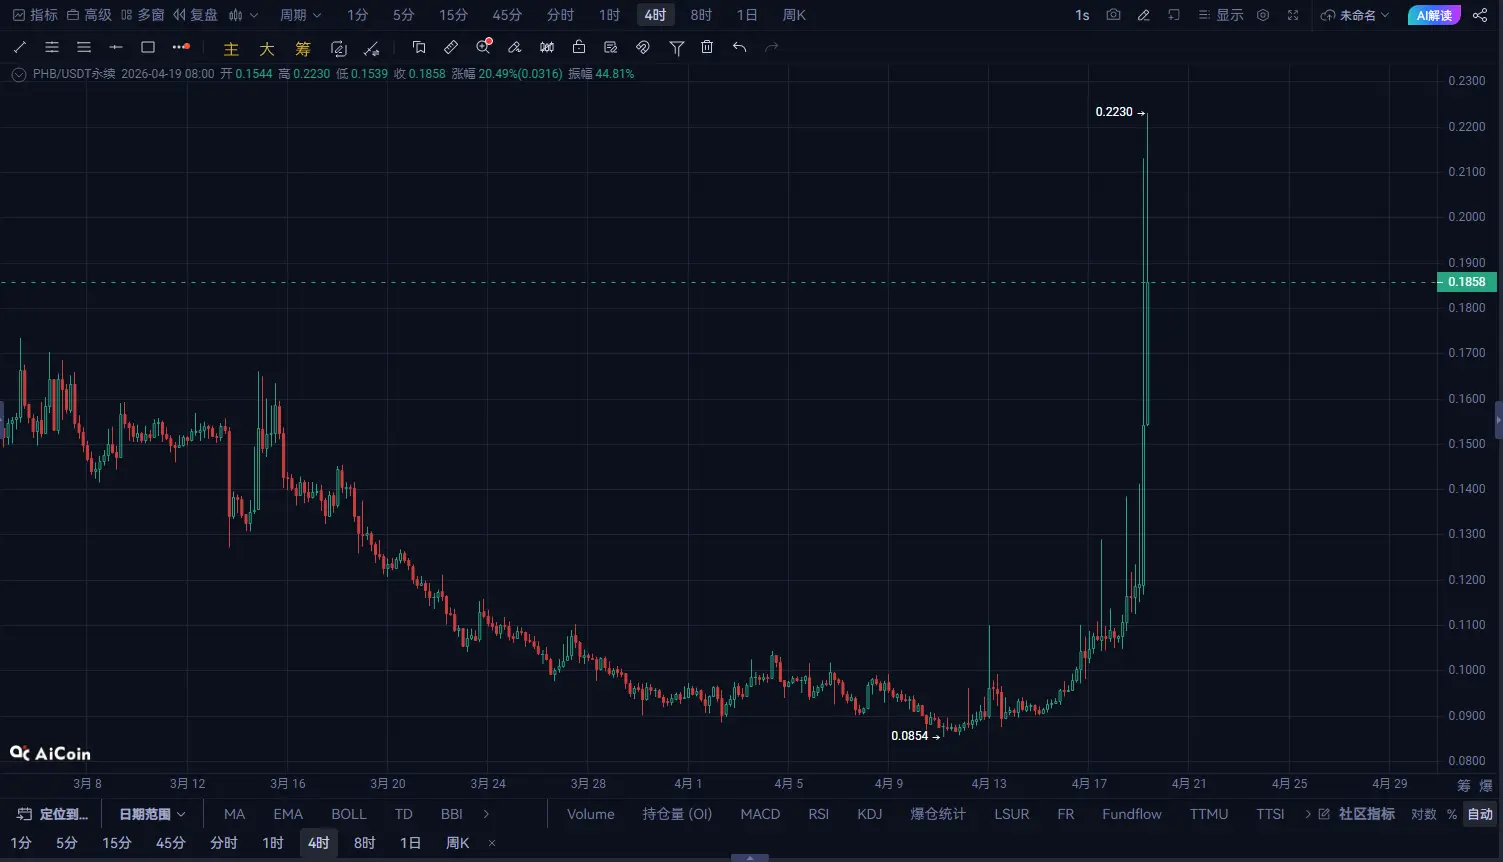
The 4-hour timeframe has already issued some unfriendly signals:
Highs are gradually decreasing (0.205 → 0.198 → 0.192) Lows repeatedly test around 0.18 Moving averages have flattened and started to turn downward
Technical performance:
MACD has broken below zero, increasing bearish momentum Bollinger Bands are opening downward, price is running along the middle to lower band Volume is increasing during declines → signs of capital outflow
Essential structure: Weak oscillation leaning bearish, not sideways trading
Key zones:
Resistance: 0.192-0.198 Support: 0.180 → breaking below targets 0.170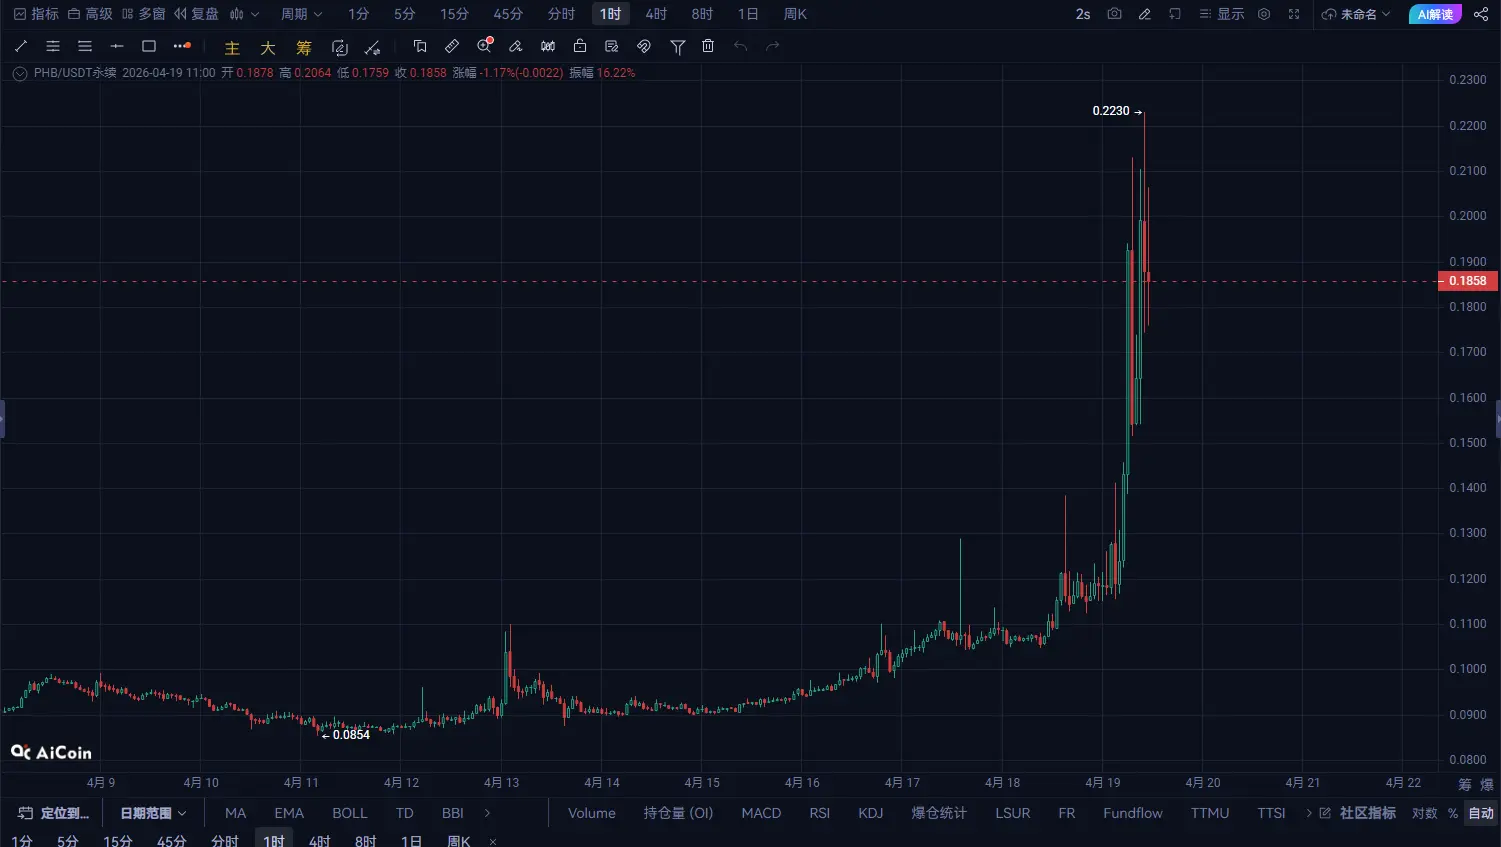
Short-term cycle is very clear:
Downtrend is stepwise (ladder decline) Rebounds are weak, unable to stabilize above moving averages MACD shows continuous increasing bearish volume
Typical pattern:
Weak rebound + bearish decline structure
Short-term key levels:
Resistance: 0.188-0.190 Support: 0.182 / 0.180
As long as the rebound does not surpass 0.19, the short-term outlook remains bearish.
The key point for PHB now is:
Is the 0.180 support holding?
Hold → Continue oscillating and shaking out, with a possibility of a second rally Break → Structural turn bearish, entering an accelerated decline phase
This is a typical “critical position game”.
Trading Strategies (Key Tips)
Short-term Strategy (Mainly Bearish)
Light short positions in the 0.188-0.195 range Stop-loss: above 0.205 Targets: 0.180 → 0.170
Logic: 4-hour + 1-hour bearish resonance
Lightly try long positions around 0.170 Add positions at strong support zone 0.155
Prerequisite: must have a sign of stabilization (volume increase on bullish candles / structural reversal)
Break above 0.205 → turn strong, go long with the trend Break below 0.180 → go short with the trend, targeting 0.170 or lower
Small coins are most prone to:
Fake breakouts Spike行情 Main force controlling and shaking out
Be sure to control your position size and avoid heavy holdings to resist shocks.