Bulls have now taken control of markets with the approval of the Bitcoin ETFs. This is seen from the global market cap, which has jumped by 2.2% from its previous 24-hour one, as the total cap stood at $1.75T as of press time. The fear and greed index is 74, as fear now creeps back into the markets
Bitcoin Price Analysis
Bitcoin (BTC) has ridden the ETF narrative to recover from yesterday’s minor corrections as the Bitcoin price stood at $46.2K as of press time, representing a 1% pump in the last 24 hours as the weekly rise stood at 7.8%. Bitcoin’s trading volume has spiked by 37% over the same period to $52M.
However, the future price trajectory for Bitcoin looks bearish, as an in-depth analysis of 24-hour BTC/USD charts reveals. The Relative Strength Index indicator is moving south, showing mounting bear pressure on BTC. The MACD indicator, on the other hand, is reverting toward the red zone, showing bearish prospects for the Bitcoin price as well.
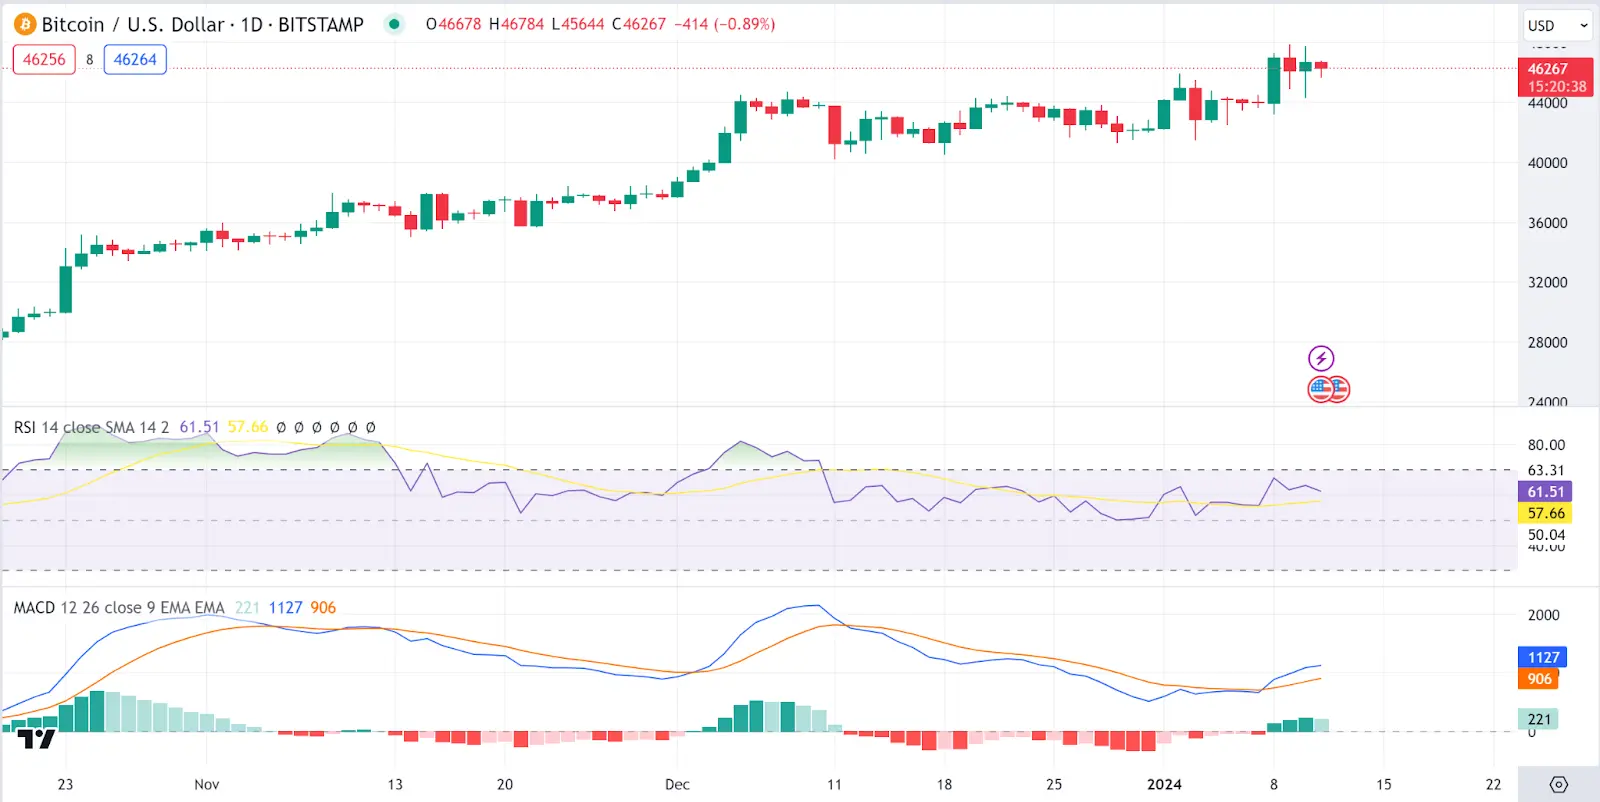 BTC 1-day chart | Source: TradingView## Ethereum Price Analysis
Ethereum (ETH) is among today’s top gainers as the Ethereum price stood at $2606 as of press time, representing a 9% increase in the last 24 hours as the weekly rise stood at 17%. As trading activities generally increase, the trading volume has spiked by 79% to $31B.
An in-depth analysis of the ETH/USD charts shows that ETH bulls are in control, as shown by the Relative Strength Index indicator, which is currently on a northern trajectory as it approaches the overbought region, showing bullish pressure on the Ethereum price. At the same time, the MACD moves in the green zone, supporting the bullish prospects on the Ethereum price.
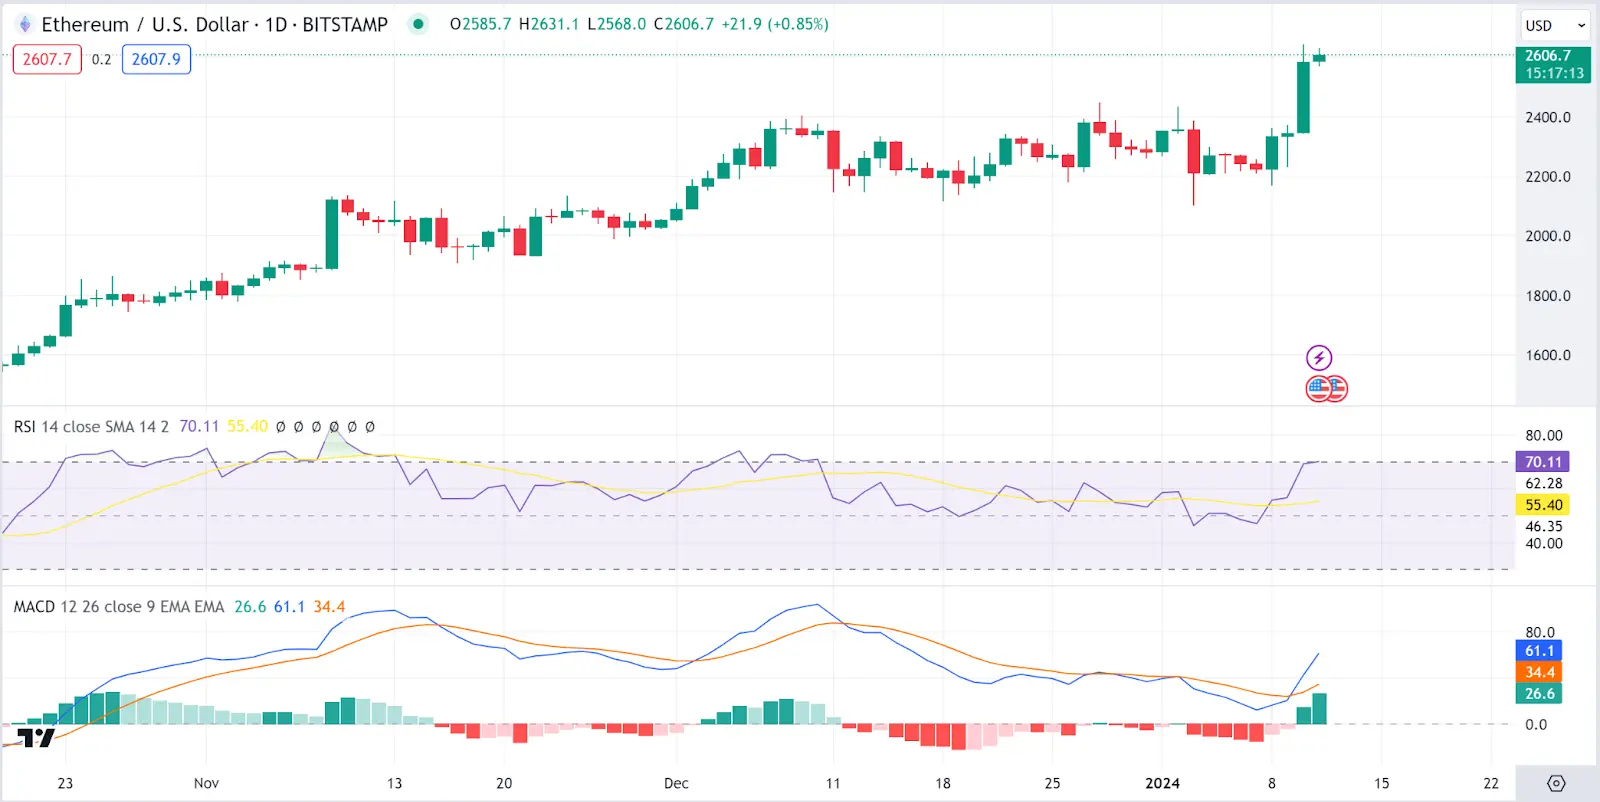 ETH 1-day chart | Source: TradingView
Blur Price Analysis
Blur (BLUR) is our other top gainer of the day, as the Blur price stood at $0.55 as of press time, representing a 20% increase in the last 24 hours to bring the weekly rise to 9.1%. Blur’s trading volume has also spiked by 157% to $380M.
An in-depth analysis of the BLUR/USDT charts shows that the Blur pump is likely to stick around for a while, as shown by the Relative Strength Index indicator, which is currently on a northern trajectory as it heads for the overbought region, showing bullish pressure on the Blur price. At the same time, the MACD moves in the green zone, supporting the bullish prospects on the Blur price.
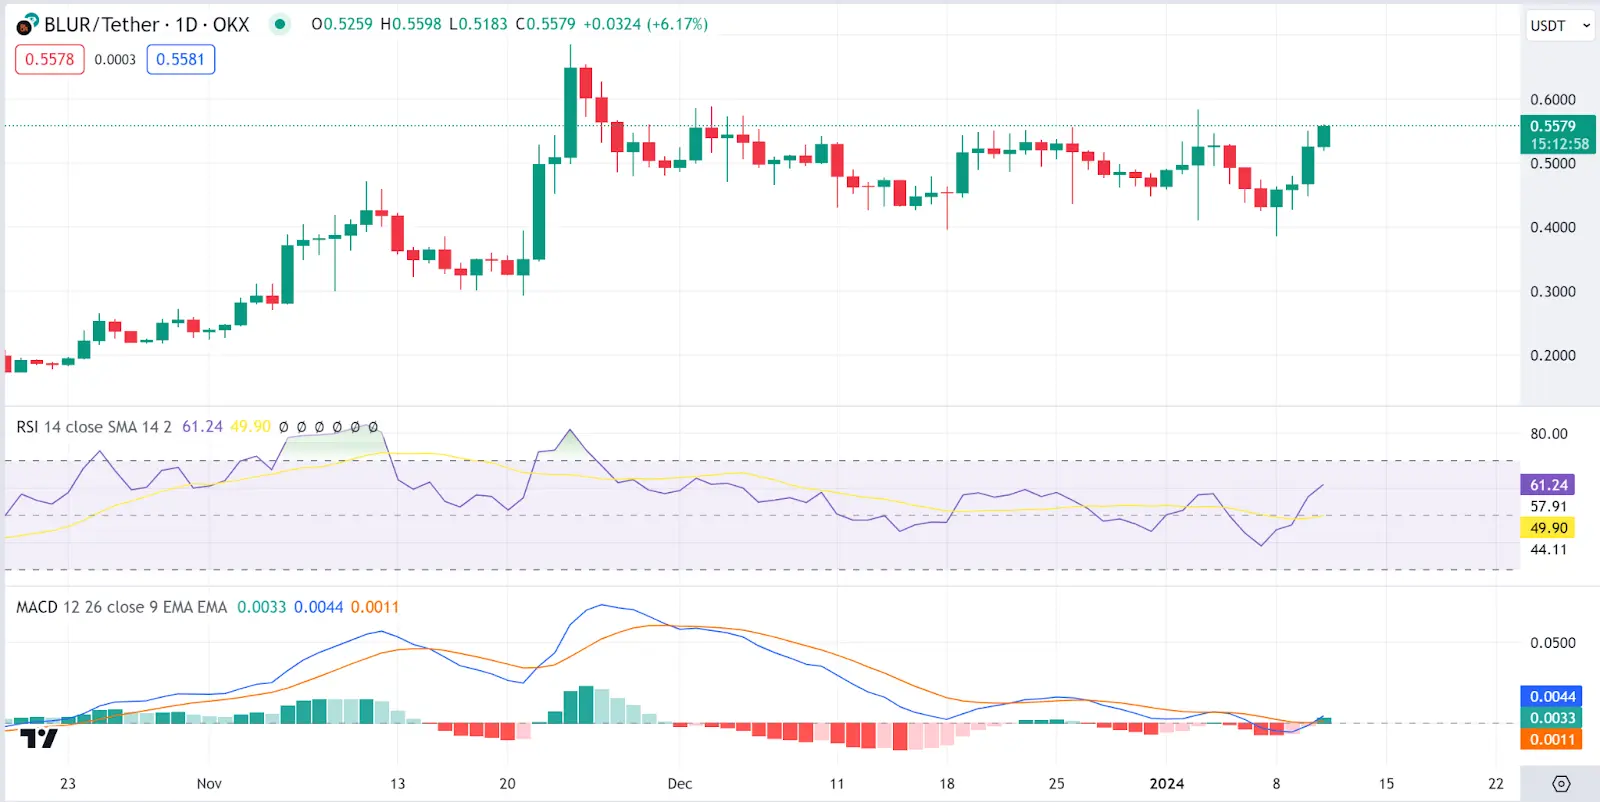 BLUR 1-day chart | Source: TradingView## GMX Price Analysis
GMX (GMX) has also ridden today’s bullish wave as the GMX price stood at $56.4 as of press time, representing an 11% increase in the last 24 hours to bring the weekly drop to 1.5%.GMX’s trading volume has also seen an 88% to $55M.
An in-depth analysis of the GMX/USDT charts shows that GMX bulls are in control, as shown by the Relative Strength Index indicator, which is currently on a northern trajectory as it heads for the overbought region, showing bullish pressure on the Ethereum price. At the same time, the MACD is also reverting toward the green zone, supporting the bullish prospects on the GMX price.
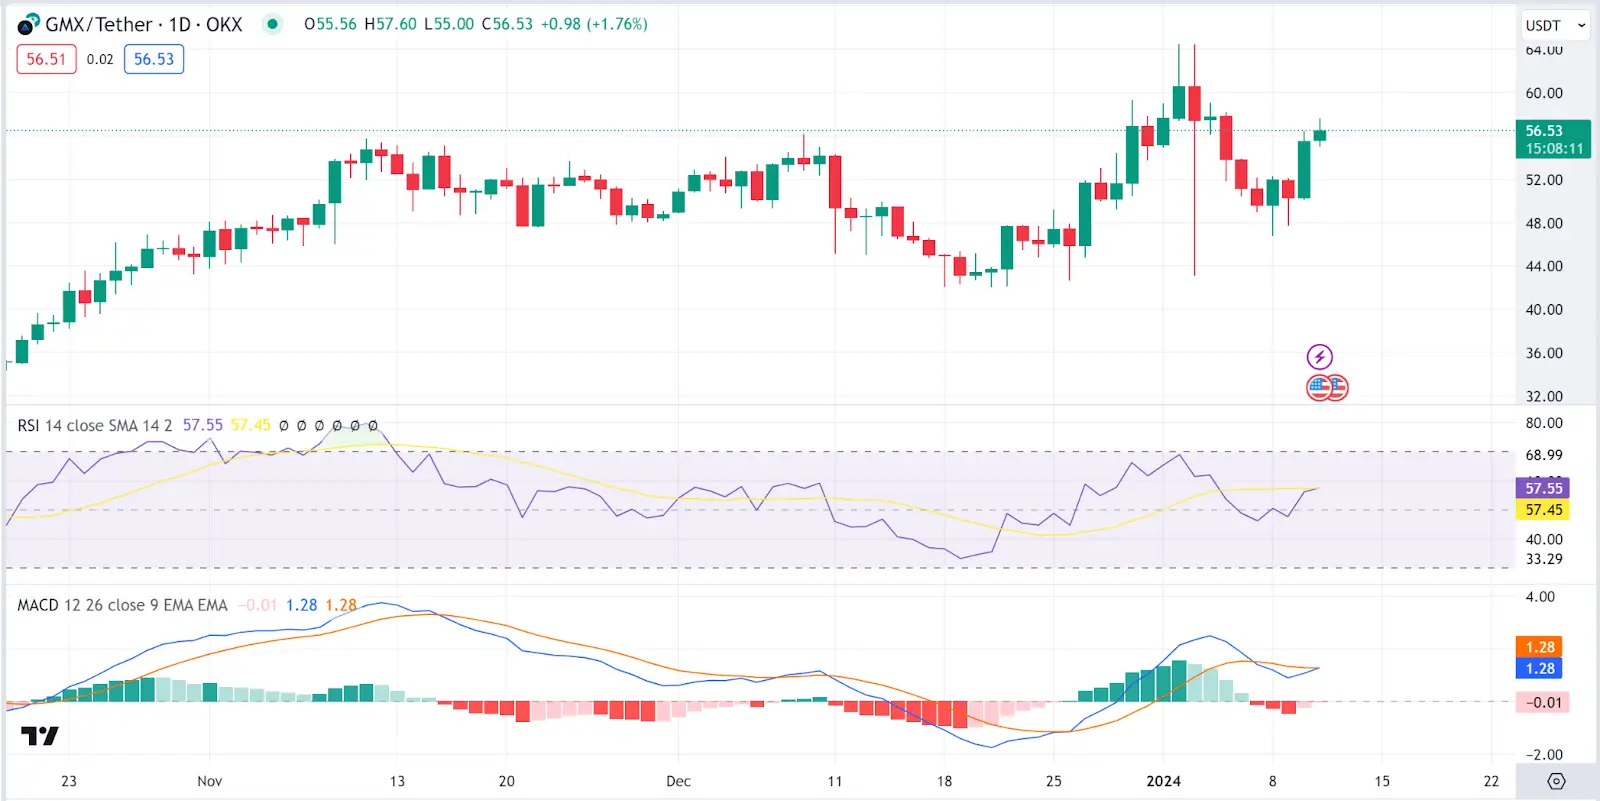 GMX 1-day chart | Source: TradingView## Litecoin Price Analysis
Litecoin (LTC) is among today’s top gainers as the Litecoin price stood at $71.18 as of press time, representing a 6.8% increase in the last 24 hours as the weekly rise stood at 9.3%. As trading activities generally increase, the token’s trading volume has spiked by 31% to $618M.
An in-depth analysis of the LTC/USD charts shows that LTC bulls are in control, as shown by the Relative Strength Index indicator, which is currently on a northern trajectory as it approaches the overbought region, showing bullish pressure on the Litecoin price. At the same time, the MACD moves are also reverting towards the green zone, backing the bull dominance prospects as the altcoin looks to carry on its pump in the short term.
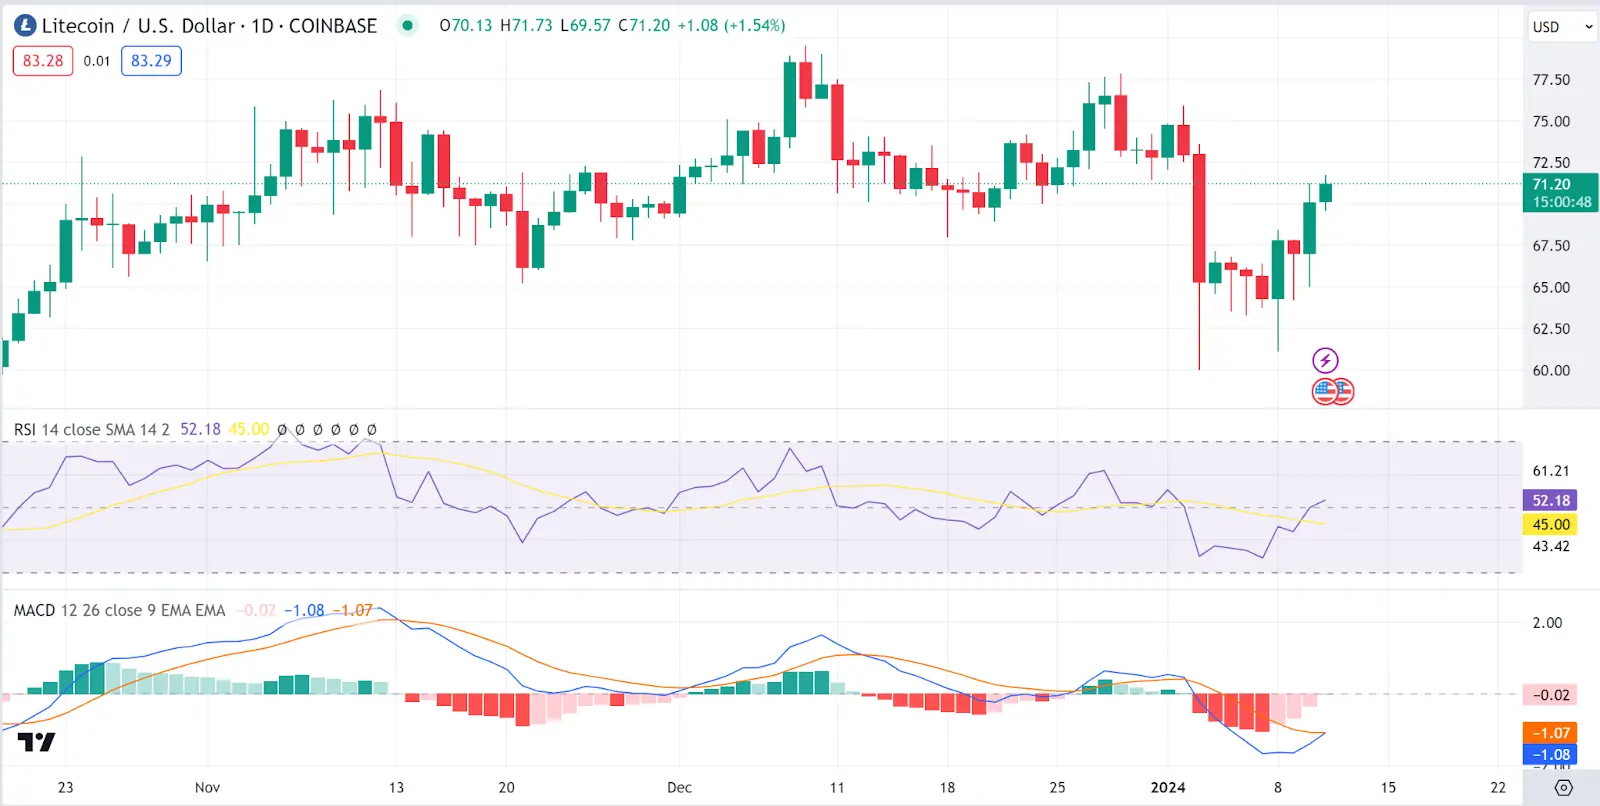 LTC 1-day chart | Source: TradingView
Disclaimer: The information on this page may come from third parties and does not represent the views or opinions of Gate. The content displayed on this page is for reference only and does not constitute any financial, investment, or legal advice. Gate does not guarantee the accuracy or completeness of the information and shall not be liable for any losses arising from the use of this information. Virtual asset investments carry high risks and are subject to significant price volatility. You may lose all of your invested principal. Please fully understand the relevant risks and make prudent decisions based on your own financial situation and risk tolerance. For details, please refer to
Disclaimer.
