#GateSquareMayTradingShare
🧪 $LAB/USDT – DeFi Gem Heating Up? Bullish Structure Intact!
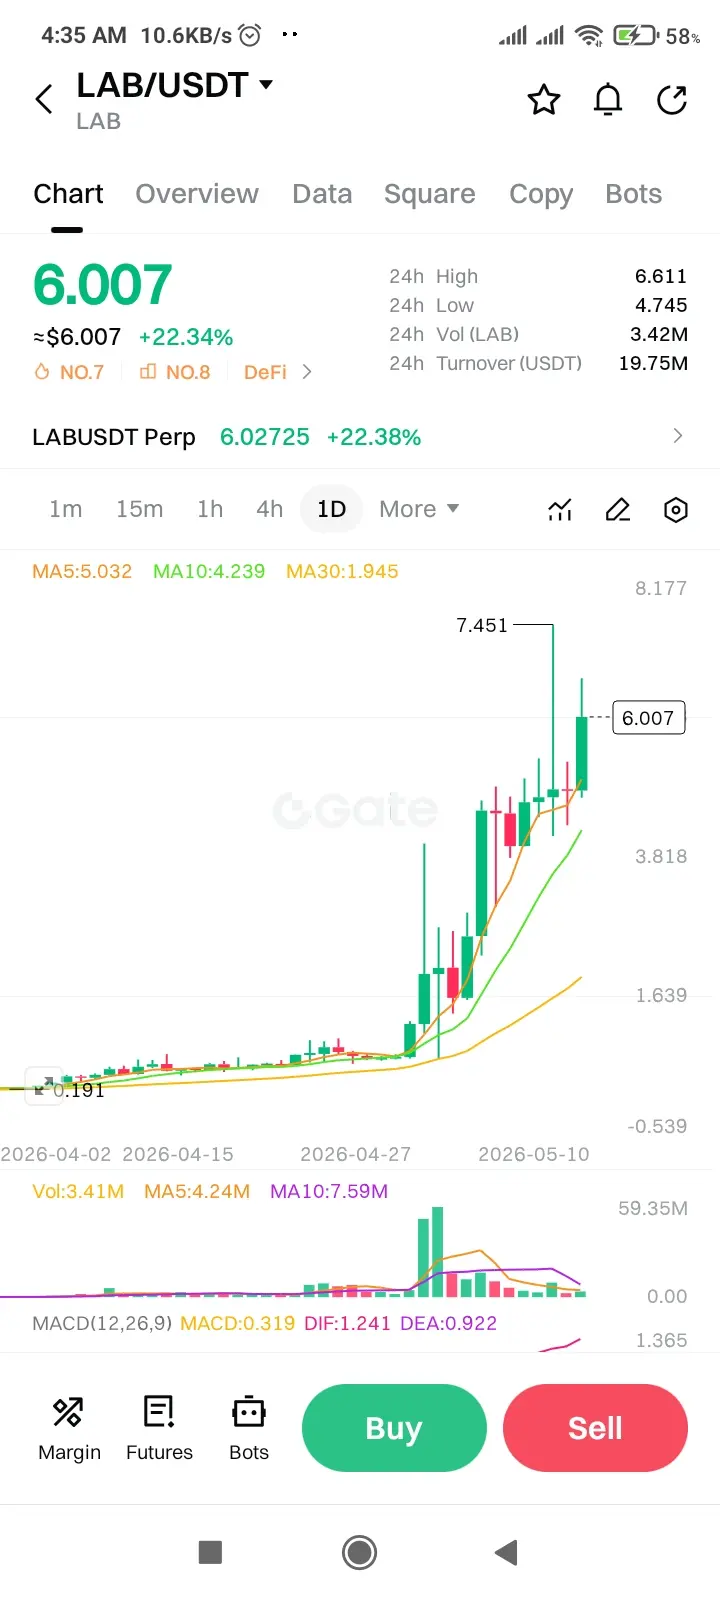
📍 Current Price: $6.007
📈 **24h Change:** **+22.34%**
🏷️ **Rank:** #7 Gainers 🔺 | #8 DeFi
⛽ **24h High:** $6.611 | 24h Low: $4.745
📊 **24h Vol (LAB):** 3.42M | **Turnover:** 19.75M USDT
🔁 **Perpetual:** $6.02725 (+22.38%)
---
🔍 Technical Breakdown
🕯️ Price Action
· Price rallied from $4.745** → **$6.611 (+39%).
· Currently holding $6.00 as psychological support after a small pullback.
📈 Moving Averages (MA)
· MA5: 5.032
· MA10: 4.239
· MA30: 1.945
· ✅ Perfect bullish alignment: MA5 > MA10 > MA30
· Price is well above all MAs – strong uptrend.
📉 MACD (12,26,9)
· MACD Line: 0.319
· DIF: 1.241
· DEA: 0.922
· ✅ Bullish cross confirmed – momentum rising.
📊 Volume
· Current Vol: 3.41M
· MA5 Vol: 4.24M
· MA10 Vol: 7.59M
· ⚠️ Volume slightly cooling – watch for re-acceleration.
---
🎯 Key Levels to Watch
Support Resistance
$5.03 (MA5) $6.61 (24H High)
$4.74 (24H Low) $7.45 (Next resistance)
$4.24 (MA10) –
---
⚡ Trade Setup Idea (Short-term)
Bullish Scenario:
· Hold above $6.00** → retest **$6.61 → breakout targets $7.45+
Bearish Scenario:
· Lose $5.03** → dip toward **$4.74–$4.24 support zone.
---
🧠 Final Thought
LAB is in a clean uptrend with strong MA structure and MACD confirmation. The DeFi tag adds narrative strength. However, volume is declining from its peak – a reclaim above 5M volume would confirm continuation.
✅ Not financial advice. Manage risk & trade smart.
🧪 $LAB/USDT – DeFi Gem Heating Up? Bullish Structure Intact!
📍 Current Price: $6.007
📈 **24h Change:** **+22.34%**
🏷️ **Rank:** #7 Gainers 🔺 | #8 DeFi
⛽ **24h High:** $6.611 | 24h Low: $4.745
📊 **24h Vol (LAB):** 3.42M | **Turnover:** 19.75M USDT
🔁 **Perpetual:** $6.02725 (+22.38%)
---
🔍 Technical Breakdown
🕯️ Price Action
· Price rallied from $4.745** → **$6.611 (+39%).
· Currently holding $6.00 as psychological support after a small pullback.
📈 Moving Averages (MA)
· MA5: 5.032
· MA10: 4.239
· MA30: 1.945
· ✅ Perfect bullish alignment: MA5 > MA10 > MA30
· Price is well above all MAs – strong uptrend.
📉 MACD (12,26,9)
· MACD Line: 0.319
· DIF: 1.241
· DEA: 0.922
· ✅ Bullish cross confirmed – momentum rising.
📊 Volume
· Current Vol: 3.41M
· MA5 Vol: 4.24M
· MA10 Vol: 7.59M
· ⚠️ Volume slightly cooling – watch for re-acceleration.
---
🎯 Key Levels to Watch
Support Resistance
$5.03 (MA5) $6.61 (24H High)
$4.74 (24H Low) $7.45 (Next resistance)
$4.24 (MA10) –
---
⚡ Trade Setup Idea (Short-term)
Bullish Scenario:
· Hold above $6.00** → retest **$6.61 → breakout targets $7.45+
Bearish Scenario:
· Lose $5.03** → dip toward **$4.74–$4.24 support zone.
---
🧠 Final Thought
LAB is in a clean uptrend with strong MA structure and MACD confirmation. The DeFi tag adds narrative strength. However, volume is declining from its peak – a reclaim above 5M volume would confirm continuation.
✅ Not financial advice. Manage risk & trade smart.