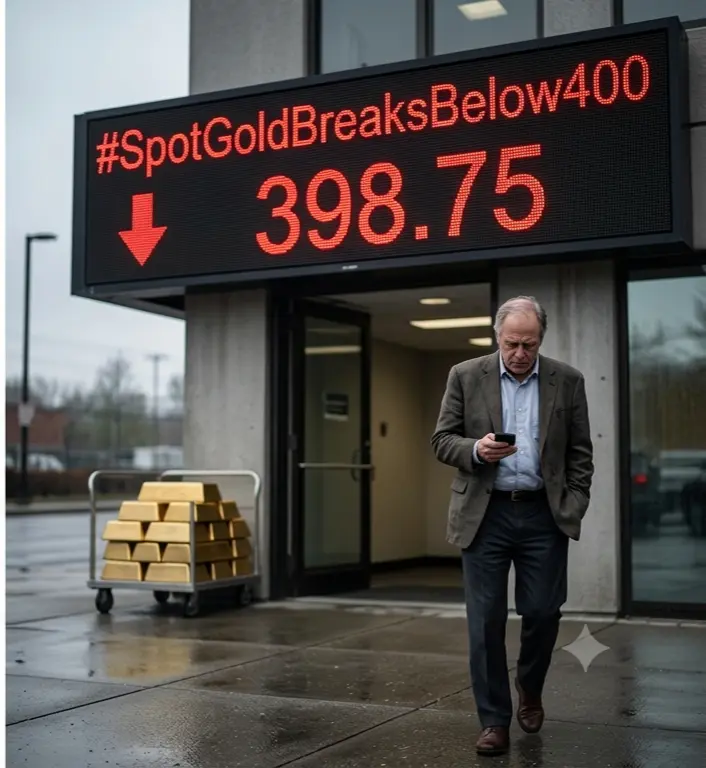
#SpotGoldBreaksBelow400
The precious metals market has witnessed a significant technical event as spot gold prices have decisively broken below the psychologically critical 4000 dollar support level, triggering widespread concern among investors and traders who have been monitoring this key threshold for months. This breakdown represents more than just a numerical breach, it signals a fundamental shift in market sentiment and structural dynamics that could have far reaching implications for the gold market in the coming weeks and months.
Understanding the Price Movement and Magnitude of Decline
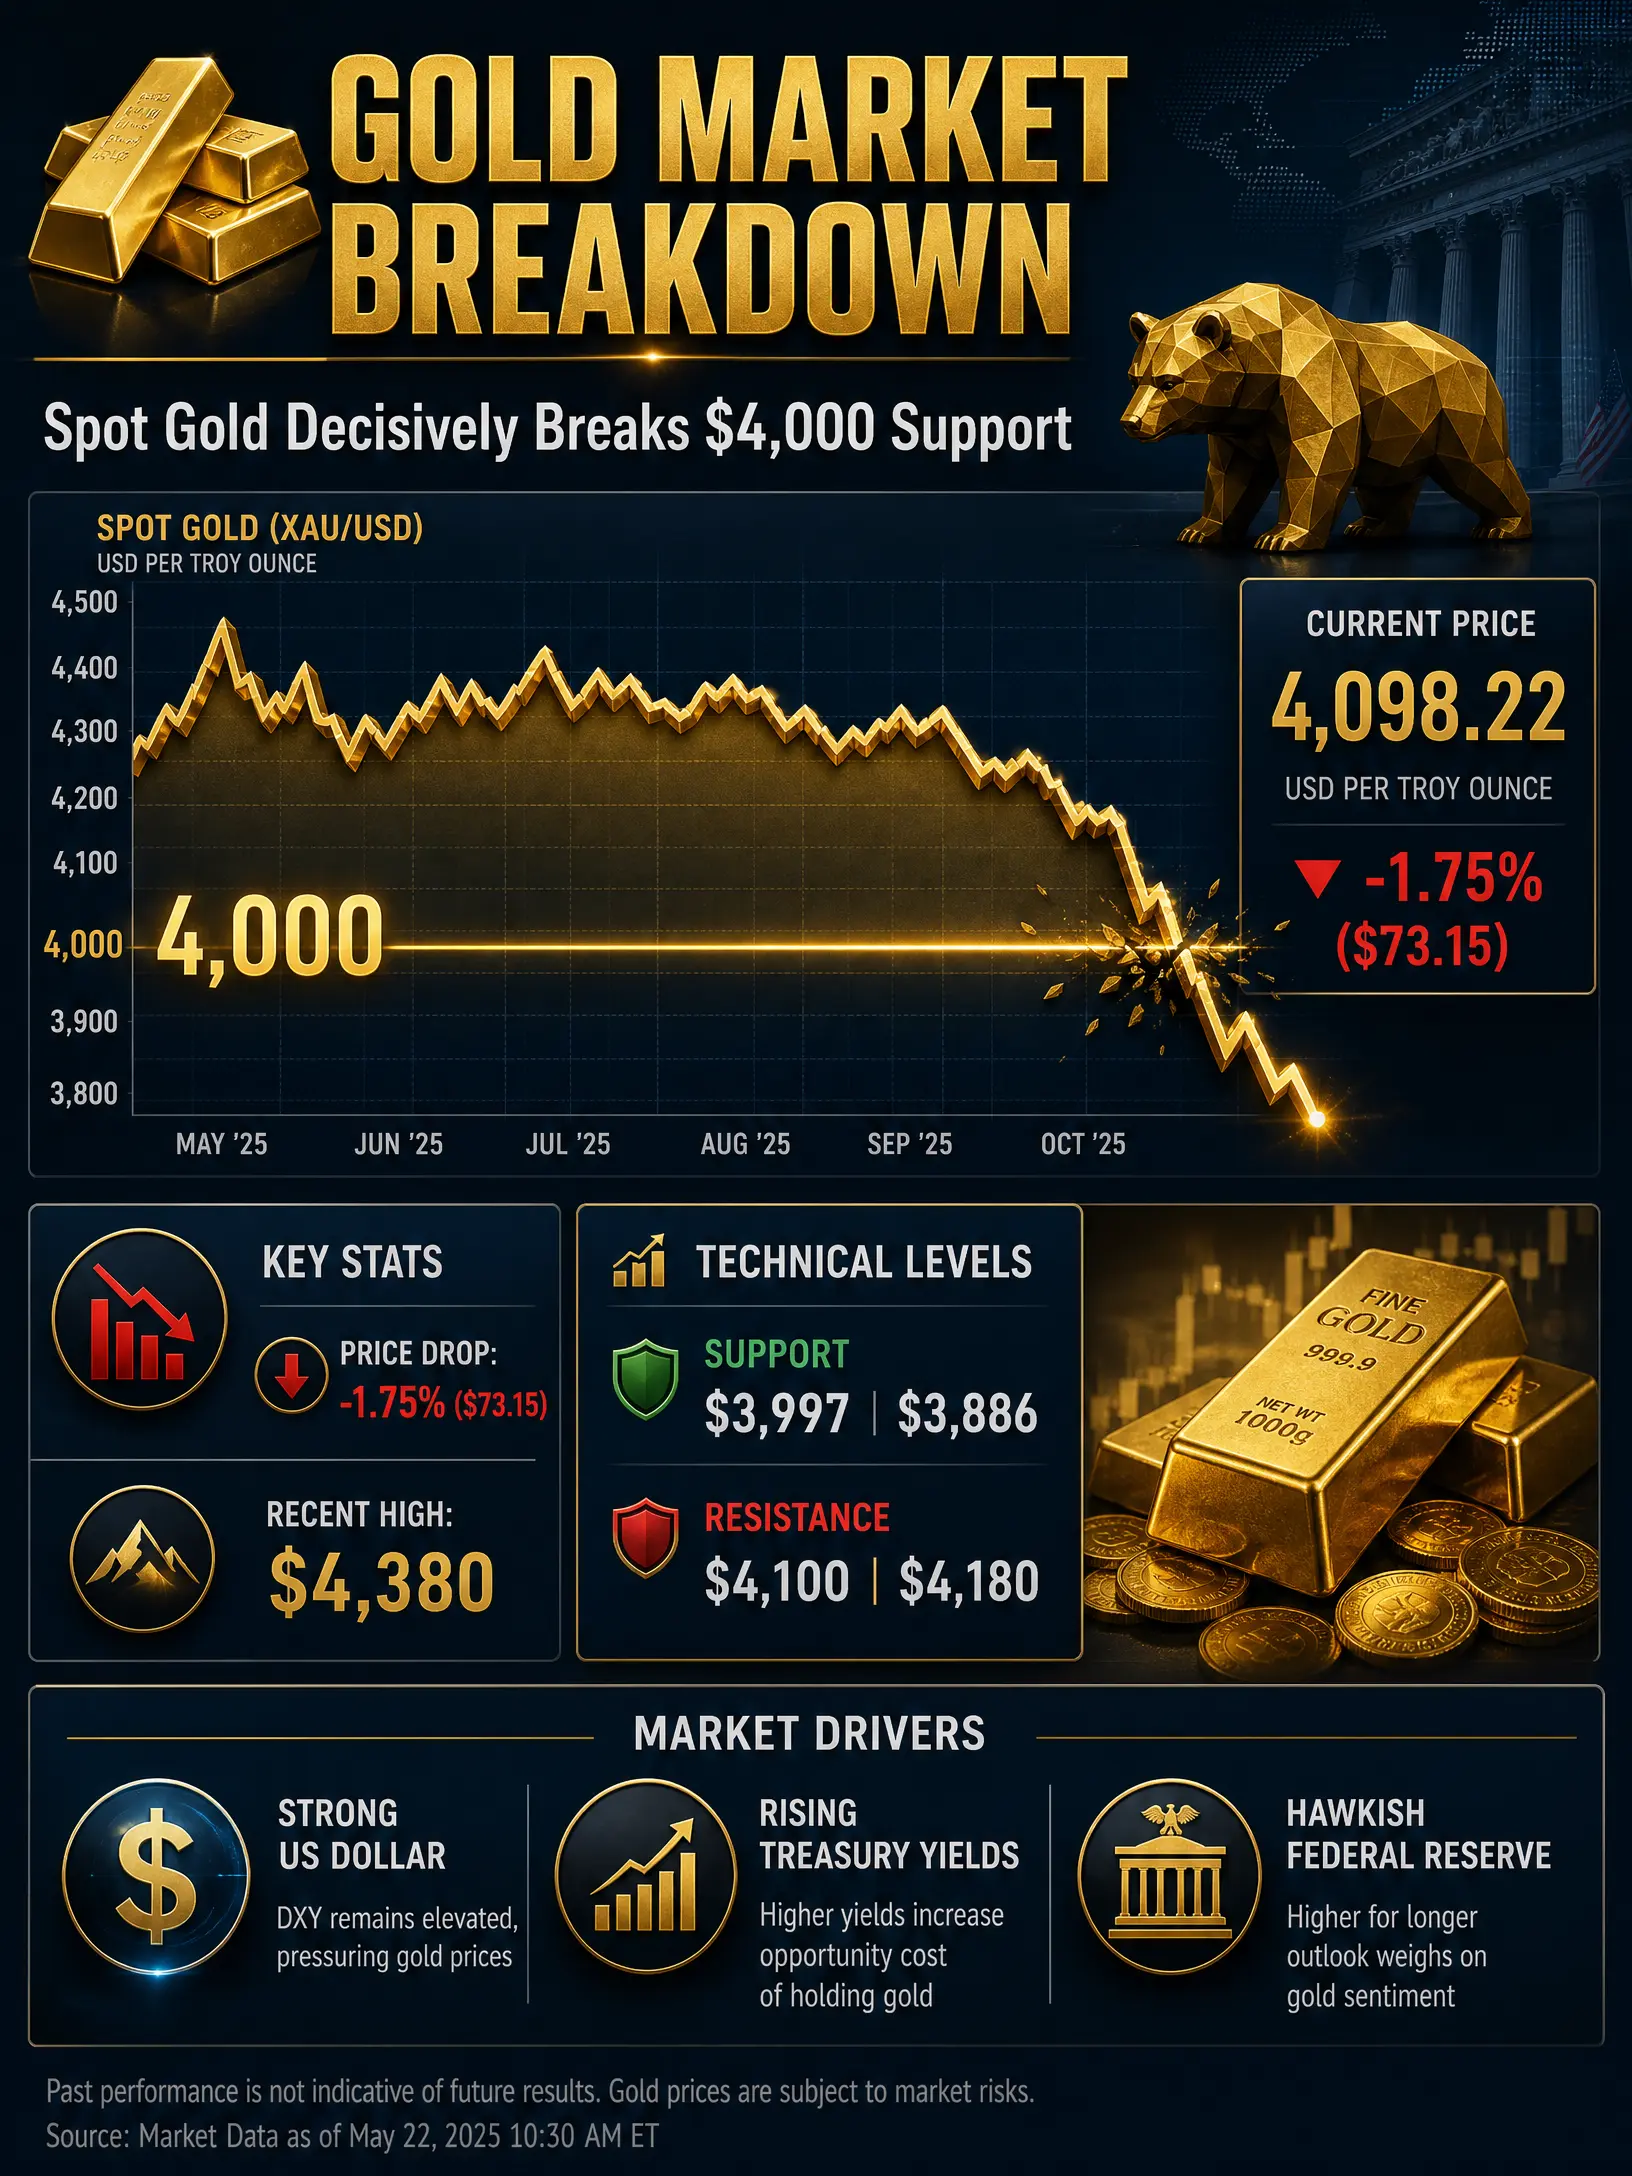
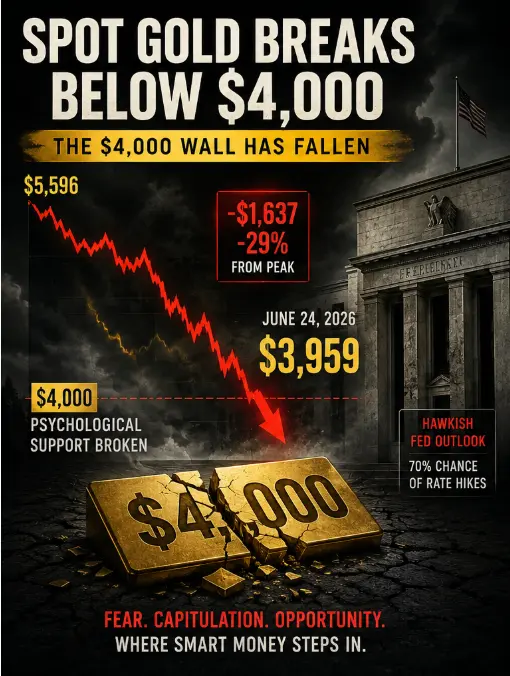
Gold prices have experienced a dramatic descent from their recent highs, with the precious metal plunging by 73.15 dollars or approximately 1.75 percent to hit a daily low of 4090.93 dollars on June 23, 2026, before continuing the downward trajectory toward the 4000 level. This decline has been part of a broader correction that has seen gold retreat significantly from its record highs above 4380 dollars reached earlier in 2026. The magnitude of this decline represents one of the most substantial corrections in recent gold market history, with prices falling from peaks near 4380 dollars to levels testing the 4000 dollar psychological barrier.
The percentage decline from the 2026 highs to current levels represents a correction of approximately 8 to 9 percent, which while significant, remains within the bounds of a healthy pullback in the context of the broader bull market that has been in place since 2022. However, the breach of the 4000 level carries substantial technical significance that extends beyond simple percentage calculations, as this level has served as a critical support zone and psychological anchor for market participants.
Technical Analysis and Support Level Dynamics
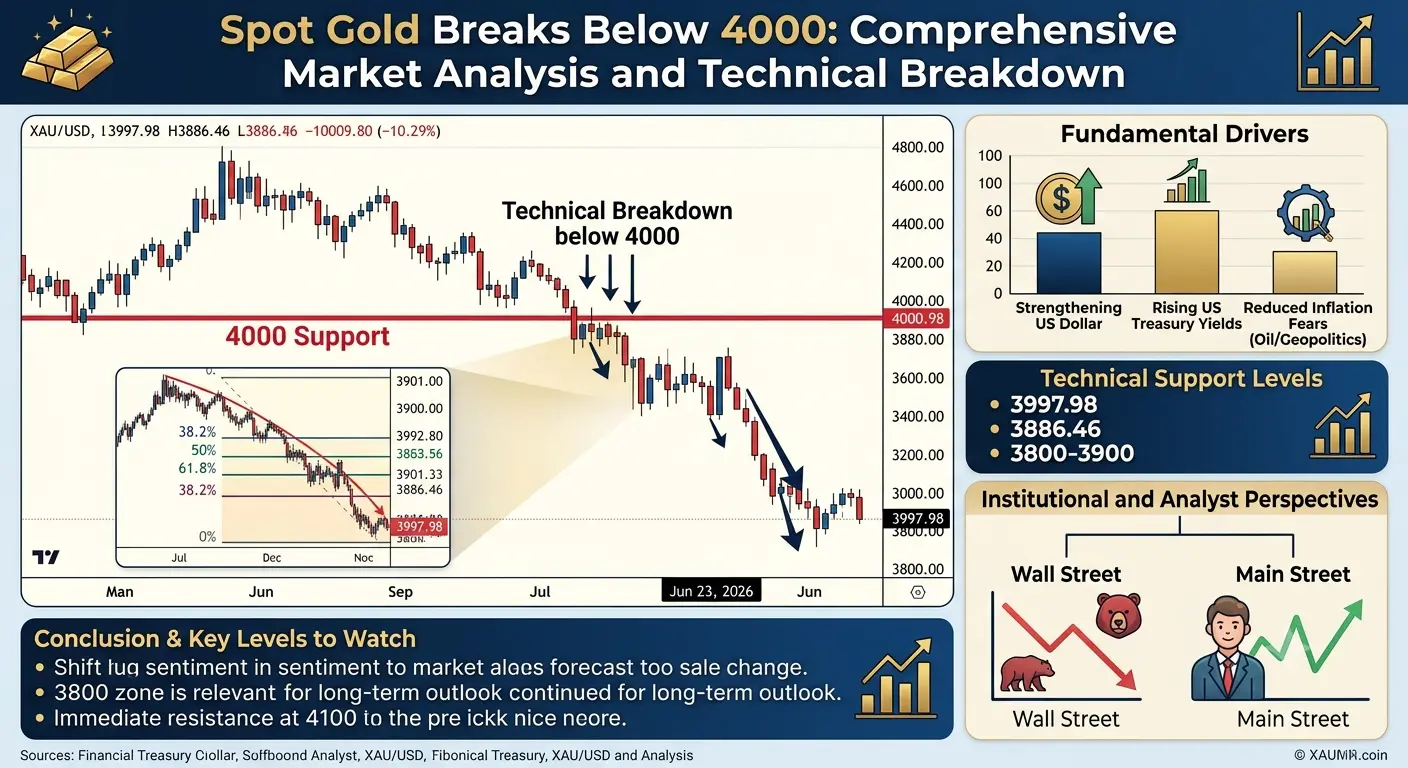
From a technical perspective, the decline has driven gold back into a vital swing area between 4006.99 dollars and 4098.74 dollars, with prices stalling just above the 38.2 percent retracement level of 4079.35 dollars calculated from the September 2022 low. This retracement level represents a key Fibonacci support zone that has historically provided meaningful support during corrections within larger uptrends.
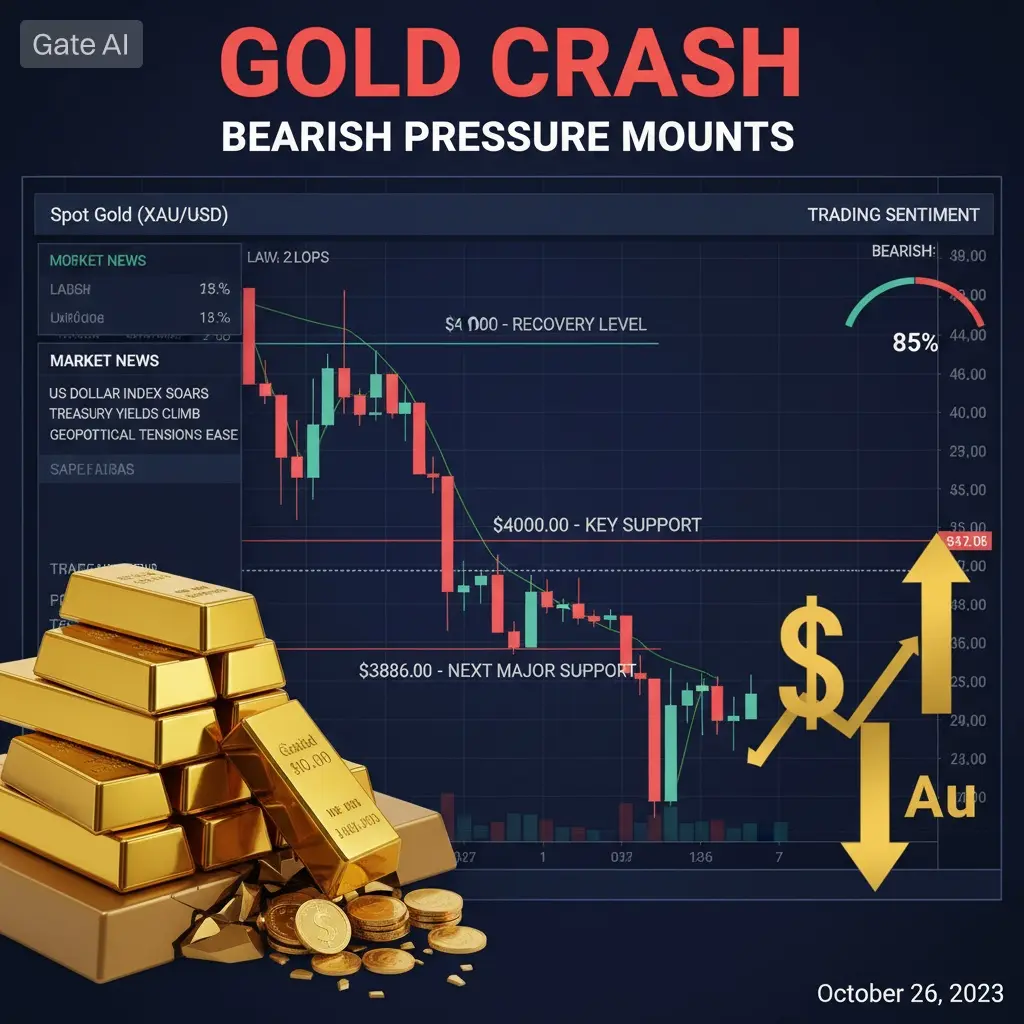
The 4000 dollar level itself represents far more than a round number, it serves as a critical psychological threshold that has been established through multiple tests over the past several months. Market technicians have identified this zone as a make or break level that would determine whether gold's rally was losing structural integrity or merely experiencing a temporary correction. The fact that sellers have managed to keep gold trading below its 200 day moving average for approximately 13 consecutive sessions indicates sustained selling pressure and weakening bullish momentum.
Technical analysis reveals that a break below 4006.99 dollars could trigger a cascade of selling as buyers who entered at higher levels convert into sellers, potentially accelerating downward momentum toward deeper support zones. The next significant support levels below 4000 include the 3997.98 dollar level, followed by more substantial support near 3886.46 dollars, which represents a deeper correction zone that could attract value oriented buyers.
Volume and Liquidity Considerations
Trading volume during this decline has been elevated, indicating that the breakdown below 4000 has occurred with meaningful participation rather than thin market conditions. The gold market maintains deep liquidity across multiple trading venues, with the London Bullion Market Association reporting substantial daily trading volumes that provide efficient price discovery and execution capabilities for market participants.
The transition between major trading sessions, including Tokyo, London, and New York, continues to dictate the rhythm of gold price volatility and market liquidity. High volume during this breakdown ensures tighter spreads and efficient execution for those looking to exit positions or establish new shorts. However, liquidity conditions can shift dramatically during off peak hours, potentially trapping traders in low volatility consolidation with wider spreads.
Market participants should note that gold futures volume on major exchanges such as the COMEX has shown increased activity during this decline, with open interest data suggesting that new short positions are being established alongside long liquidations. This combination of technical selling and fresh short interest has created a self reinforcing downward pressure on prices.
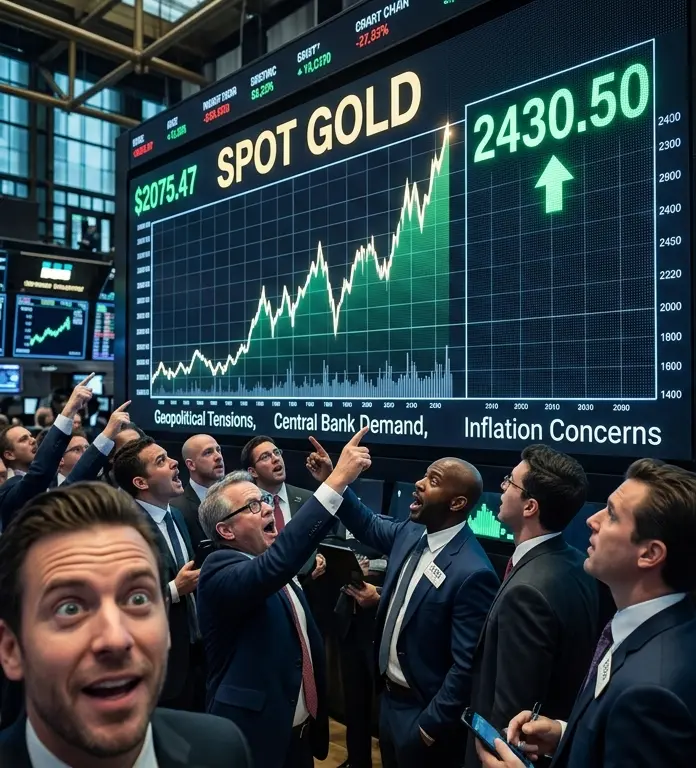
Fundamental Drivers Behind the Decline
Several interconnected factors have contributed to gold's breakdown below the 4000 support level. The primary driver has been the resurgence of the United States dollar, which has strengthened significantly following the Federal Reserve's hawkish stance during their June meeting. The Fed signaled that rate hikes remain on the table for 2026, contrary to market expectations of sustained dovish policy, triggering a repricing of interest rate expectations that has weighed heavily on non yielding assets like gold.
Rising United States Treasury yields have compounded the pressure on gold, with the benchmark 10 year yield trading near the 4.4 percent area, making fixed income investments more attractive relative to precious metals. The inverse relationship between gold prices and real yields has reasserted itself, with higher yields increasing the opportunity cost of holding gold.
Additionally, easing fears regarding oil supply disruptions following progress in United States Iran peace talks have reduced the immediate inflation shock premium that had been supporting gold prices. With crude oil prices under pressure and geopolitical risk premiums diminishing, gold has lost one of its key supportive narratives.
The shift in market focus from geopolitical hedging to interest rate and dollar sensitivity has fundamentally changed how gold trades, with the precious metal now behaving more as a rate and dollar asset rather than a pure safe haven hedge against geopolitical instability.
Institutional and Analyst Perspectives
Major financial institutions have responded to this decline by adjusting their gold price forecasts. ING has lowered its gold price forecast for the second half of 2026, citing surging momentum in the United States dollar and elevated bond yields as primary headwinds. However, analysts note that despite the challenging near term environment, gold's structural fundamentals remain intact, suggesting that this correction may prove temporary before prices stabilize and potentially resume their longer term uptrend.
Market sentiment surveys indicate a divergence between Wall Street and Main Street perspectives. While Wall Street bears have regained control following the Fed's hawkish outlook, Main Street sentiment has remained surprisingly resilient, with retail investors maintaining bullish positions despite gold's slide below 4200 dollars and now the 4000 level.
Analysts at major banks have maintained long term gold targets well above current levels, with some institutions projecting prices toward 6000 dollars by year end under specific macroeconomic scenarios. However, these targets appear increasingly unlikely in the near term as markets would need to fully price out rate hike expectations for such levels to be achieved.
The Road Ahead: Support Levels and Potential Scenarios
Looking forward, the technical landscape for gold presents several critical scenarios. In the immediate term, bears' next near term downside price objective is a sustained break below 4000 dollars, with deeper downside targets at 3997.98 dollars and subsequently 3886.46 dollars. A move toward the 3886 level would represent a more substantial correction of approximately 11 to 12 percent from recent highs, potentially attracting significant value oriented buying interest.
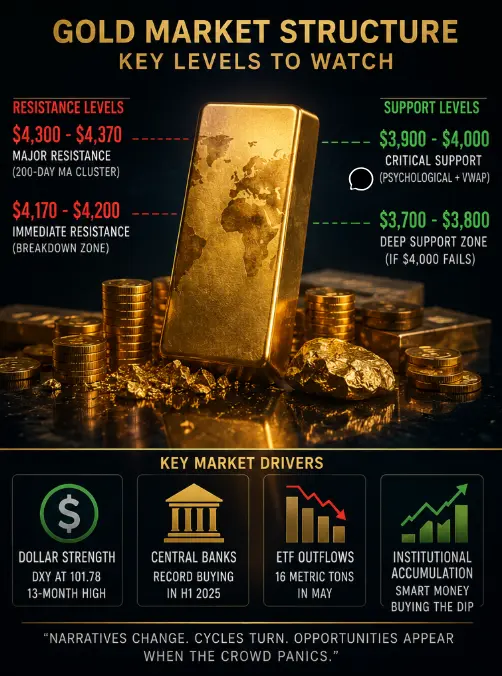
For bullish scenarios to regain traction, gold needs to reclaim the 4100 to 4180 dollar resistance zone, with a sustained move above this area targeting 4221 dollars and subsequently 4350 dollars. However, given the current technical damage and bearish momentum, such a recovery would require a fundamental catalyst, potentially in the form of renewed geopolitical tensions, weaker economic data prompting dovish Fed repricing, or a reversal in dollar strength.
The 3800 to 3900 dollar zone represents a critical longer term support area that aligns with previous consolidation zones and would likely attract substantial institutional buying interest if tested. Market participants should monitor volume characteristics during any further declines, as capitulation selling accompanied by extreme volume often marks important intermediate term bottoms.
Risk Management and Trading Considerations
For traders and investors navigating this environment, risk management has become paramount. The breakdown below 4000 has invalidated previous bullish structures, requiring a reassessment of position sizing and stop loss levels. Those maintaining long positions should consider whether their investment thesis remains intact or if the technical damage warrants reducing exposure.
Short term traders may find opportunities in the volatility, but should remain cognizant of the potential for sharp counter trend rallies within the broader downtrend. The gold market has demonstrated a tendency for sharp, short lived spikes even within corrective phases, making strict risk management essential.
Investors with longer term horizons may view this decline as a potential accumulation opportunity, particularly if prices approach the 3800 to 3900 dollar support zone. However, dollar cost averaging strategies should be employed with caution given the potential for further downside before a sustainable bottom forms.
Conclusion
The breakdown of spot gold below the 4000 dollar support level represents a significant technical event that has shifted market sentiment from cautiously optimistic to distinctly bearish in the near term. The confluence of dollar strength, rising yields, and diminishing geopolitical risk premiums has created a challenging environment for precious metals, with technical indicators confirming the deterioration in bullish momentum.
While the decline has been substantial, with prices falling approximately 8 to 9 percent from 2026 highs, the longer term structural bull market that has been in place since 2022 remains technically intact unless prices break below the 3800 dollar zone. Market participants should remain vigilant for signs of capitulation selling or bullish divergence that could signal an approaching bottom, while maintaining strict risk management protocols in this volatile environment.
The coming weeks will be critical in determining whether this breakdown below 4000 represents a temporary overshoot within a broader correction or the beginning of a more sustained downtrend. Key levels to monitor include the immediate support near 3997 dollars, the critical 3886 dollar support zone, and resistance levels at 4100 and 4180 dollars that would need to be reclaimed to restore bullish confidence.@Gate_Square
The precious metals market has witnessed a significant technical event as spot gold prices have decisively broken below the psychologically critical 4000 dollar support level, triggering widespread concern among investors and traders who have been monitoring this key threshold for months. This breakdown represents more than just a numerical breach, it signals a fundamental shift in market sentiment and structural dynamics that could have far reaching implications for the gold market in the coming weeks and months.
Understanding the Price Movement and Magnitude of Decline
Gold prices have experienced a dramatic descent from their recent highs, with the precious metal plunging by 73.15 dollars or approximately 1.75 percent to hit a daily low of 4090.93 dollars on June 23, 2026, before continuing the downward trajectory toward the 4000 level. This decline has been part of a broader correction that has seen gold retreat significantly from its record highs above 4380 dollars reached earlier in 2026. The magnitude of this decline represents one of the most substantial corrections in recent gold market history, with prices falling from peaks near 4380 dollars to levels testing the 4000 dollar psychological barrier.
The percentage decline from the 2026 highs to current levels represents a correction of approximately 8 to 9 percent, which while significant, remains within the bounds of a healthy pullback in the context of the broader bull market that has been in place since 2022. However, the breach of the 4000 level carries substantial technical significance that extends beyond simple percentage calculations, as this level has served as a critical support zone and psychological anchor for market participants.
Technical Analysis and Support Level Dynamics
From a technical perspective, the decline has driven gold back into a vital swing area between 4006.99 dollars and 4098.74 dollars, with prices stalling just above the 38.2 percent retracement level of 4079.35 dollars calculated from the September 2022 low. This retracement level represents a key Fibonacci support zone that has historically provided meaningful support during corrections within larger uptrends.
The 4000 dollar level itself represents far more than a round number, it serves as a critical psychological threshold that has been established through multiple tests over the past several months. Market technicians have identified this zone as a make or break level that would determine whether gold's rally was losing structural integrity or merely experiencing a temporary correction. The fact that sellers have managed to keep gold trading below its 200 day moving average for approximately 13 consecutive sessions indicates sustained selling pressure and weakening bullish momentum.
Technical analysis reveals that a break below 4006.99 dollars could trigger a cascade of selling as buyers who entered at higher levels convert into sellers, potentially accelerating downward momentum toward deeper support zones. The next significant support levels below 4000 include the 3997.98 dollar level, followed by more substantial support near 3886.46 dollars, which represents a deeper correction zone that could attract value oriented buyers.
Volume and Liquidity Considerations
Trading volume during this decline has been elevated, indicating that the breakdown below 4000 has occurred with meaningful participation rather than thin market conditions. The gold market maintains deep liquidity across multiple trading venues, with the London Bullion Market Association reporting substantial daily trading volumes that provide efficient price discovery and execution capabilities for market participants.
The transition between major trading sessions, including Tokyo, London, and New York, continues to dictate the rhythm of gold price volatility and market liquidity. High volume during this breakdown ensures tighter spreads and efficient execution for those looking to exit positions or establish new shorts. However, liquidity conditions can shift dramatically during off peak hours, potentially trapping traders in low volatility consolidation with wider spreads.
Market participants should note that gold futures volume on major exchanges such as the COMEX has shown increased activity during this decline, with open interest data suggesting that new short positions are being established alongside long liquidations. This combination of technical selling and fresh short interest has created a self reinforcing downward pressure on prices.
Fundamental Drivers Behind the Decline
Several interconnected factors have contributed to gold's breakdown below the 4000 support level. The primary driver has been the resurgence of the United States dollar, which has strengthened significantly following the Federal Reserve's hawkish stance during their June meeting. The Fed signaled that rate hikes remain on the table for 2026, contrary to market expectations of sustained dovish policy, triggering a repricing of interest rate expectations that has weighed heavily on non yielding assets like gold.
Rising United States Treasury yields have compounded the pressure on gold, with the benchmark 10 year yield trading near the 4.4 percent area, making fixed income investments more attractive relative to precious metals. The inverse relationship between gold prices and real yields has reasserted itself, with higher yields increasing the opportunity cost of holding gold.
Additionally, easing fears regarding oil supply disruptions following progress in United States Iran peace talks have reduced the immediate inflation shock premium that had been supporting gold prices. With crude oil prices under pressure and geopolitical risk premiums diminishing, gold has lost one of its key supportive narratives.
The shift in market focus from geopolitical hedging to interest rate and dollar sensitivity has fundamentally changed how gold trades, with the precious metal now behaving more as a rate and dollar asset rather than a pure safe haven hedge against geopolitical instability.
Institutional and Analyst Perspectives
Major financial institutions have responded to this decline by adjusting their gold price forecasts. ING has lowered its gold price forecast for the second half of 2026, citing surging momentum in the United States dollar and elevated bond yields as primary headwinds. However, analysts note that despite the challenging near term environment, gold's structural fundamentals remain intact, suggesting that this correction may prove temporary before prices stabilize and potentially resume their longer term uptrend.
Market sentiment surveys indicate a divergence between Wall Street and Main Street perspectives. While Wall Street bears have regained control following the Fed's hawkish outlook, Main Street sentiment has remained surprisingly resilient, with retail investors maintaining bullish positions despite gold's slide below 4200 dollars and now the 4000 level.
Analysts at major banks have maintained long term gold targets well above current levels, with some institutions projecting prices toward 6000 dollars by year end under specific macroeconomic scenarios. However, these targets appear increasingly unlikely in the near term as markets would need to fully price out rate hike expectations for such levels to be achieved.
The Road Ahead: Support Levels and Potential Scenarios
Looking forward, the technical landscape for gold presents several critical scenarios. In the immediate term, bears' next near term downside price objective is a sustained break below 4000 dollars, with deeper downside targets at 3997.98 dollars and subsequently 3886.46 dollars. A move toward the 3886 level would represent a more substantial correction of approximately 11 to 12 percent from recent highs, potentially attracting significant value oriented buying interest.
For bullish scenarios to regain traction, gold needs to reclaim the 4100 to 4180 dollar resistance zone, with a sustained move above this area targeting 4221 dollars and subsequently 4350 dollars. However, given the current technical damage and bearish momentum, such a recovery would require a fundamental catalyst, potentially in the form of renewed geopolitical tensions, weaker economic data prompting dovish Fed repricing, or a reversal in dollar strength.
The 3800 to 3900 dollar zone represents a critical longer term support area that aligns with previous consolidation zones and would likely attract substantial institutional buying interest if tested. Market participants should monitor volume characteristics during any further declines, as capitulation selling accompanied by extreme volume often marks important intermediate term bottoms.
Risk Management and Trading Considerations
For traders and investors navigating this environment, risk management has become paramount. The breakdown below 4000 has invalidated previous bullish structures, requiring a reassessment of position sizing and stop loss levels. Those maintaining long positions should consider whether their investment thesis remains intact or if the technical damage warrants reducing exposure.
Short term traders may find opportunities in the volatility, but should remain cognizant of the potential for sharp counter trend rallies within the broader downtrend. The gold market has demonstrated a tendency for sharp, short lived spikes even within corrective phases, making strict risk management essential.
Investors with longer term horizons may view this decline as a potential accumulation opportunity, particularly if prices approach the 3800 to 3900 dollar support zone. However, dollar cost averaging strategies should be employed with caution given the potential for further downside before a sustainable bottom forms.
Conclusion
The breakdown of spot gold below the 4000 dollar support level represents a significant technical event that has shifted market sentiment from cautiously optimistic to distinctly bearish in the near term. The confluence of dollar strength, rising yields, and diminishing geopolitical risk premiums has created a challenging environment for precious metals, with technical indicators confirming the deterioration in bullish momentum.
While the decline has been substantial, with prices falling approximately 8 to 9 percent from 2026 highs, the longer term structural bull market that has been in place since 2022 remains technically intact unless prices break below the 3800 dollar zone. Market participants should remain vigilant for signs of capitulation selling or bullish divergence that could signal an approaching bottom, while maintaining strict risk management protocols in this volatile environment.
The coming weeks will be critical in determining whether this breakdown below 4000 represents a temporary overshoot within a broader correction or the beginning of a more sustained downtrend. Key levels to monitor include the immediate support near 3997 dollars, the critical 3886 dollar support zone, and resistance levels at 4100 and 4180 dollars that would need to be reclaimed to restore bullish confidence.@Gate_Square