#TONUSDT #LABUSDT #USUSDT | 4H + 1D Analysis
Market focus today: RSI behavior, Bollinger Band reaction, volume confirmation, and high-probability trade setups. No blind entries — confirmation matters.
━━━━━━━━━━━━━━
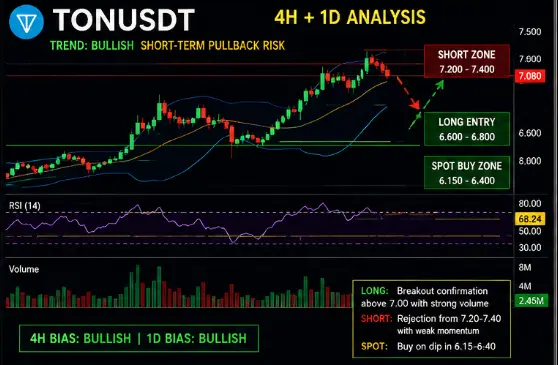
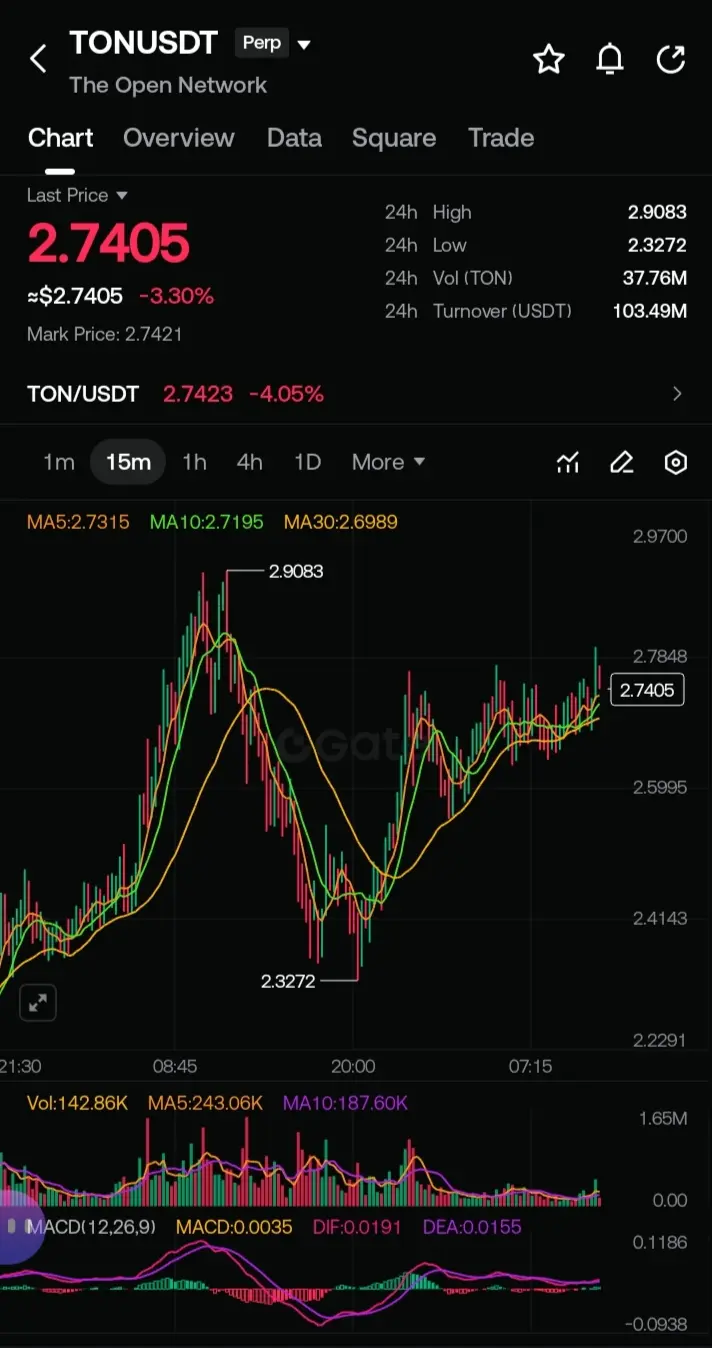
🔍 $TONUSDT Analysis (4H + 1D)
TON remains one of the strongest momentum coins, supported by ecosystem growth and strong trader interest. However, short-term overheating means chasing green candles could be risky.
📊 RSI:
• RSI above 70 = overbought zone, correction risk increases
• RSI between 50–65 = healthy bullish momentum
• RSI below 45 = weakness signal
📈 Bollinger Bands:
• Price near upper band = possible overextension
• Pullback toward middle band + bounce = healthier long setup
• Band squeeze = strong breakout possibility
📊 Volume:
• Strong green volume = buyers in control
• Weak breakout volume = fake breakout risk
• Sudden red volume increase = possible correction
🟢 LONG Setup:
Entry only after breakout confirmation with strong volume and bullish candle close.
🔴 SHORT Setup:
If resistance rejection appears and RSI starts cooling with selling pressure.
💰 SPOT Strategy:
Avoid FOMO buying. Better entry comes after pullback or consolidation.
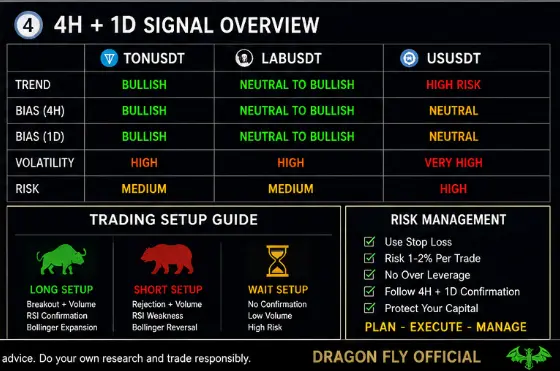
Bias: Bullish Long-Term | Short-Term Pullback Risk
━━━━━━━━━━━━━━
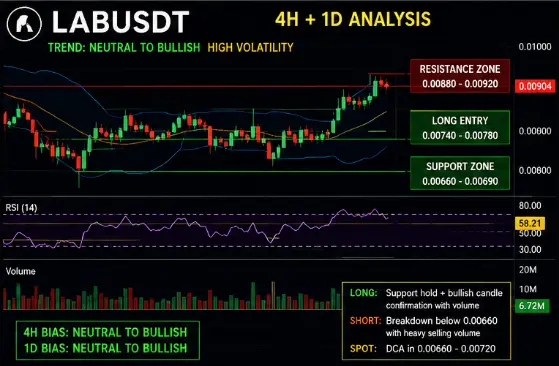
🔍 $LABUSDT Analysis (4H + 1D)
LAB is moving in a highly volatile structure. Fast upside momentum can also create sharp pullbacks, so patience matters.
📊 RSI:
• RSI above 68 = profit-taking zone risk
• RSI 50–60 = balanced momentum
• RSI below 45 = bearish pressure
📈 Bollinger Bands:
• Wide bands = volatility expansion
• Tight bands = breakout incoming
• Lower band hold = possible recovery signal
📊 Volume:
• Rising volume confirms trend
• Falling volume during price rise = weak momentum warning
🟢 LONG Setup:
Support hold + bullish candle + volume confirmation.
🔴 SHORT Setup:
Support breakdown with aggressive selling volume.
💰 SPOT Strategy:
Small DCA buying only. Avoid emotional entries after pumps.
Bias: Neutral to Bullish | High Volatility
━━━━━━━━━━━━━━
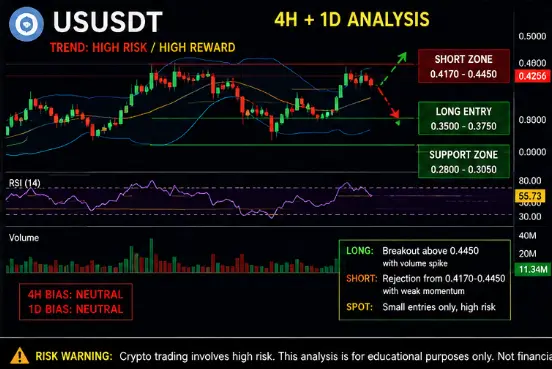
🔍 $USUSDT Analysis (4H + 1D)
USUSDT remains a speculative and high-volatility market. Proper risk management is essential.
📊 RSI:
• Above 70 = caution for longs
• Below 30 = bounce potential zone
• Neutral RSI = wait for confirmation
📈 Bollinger Bands:
• Tight bands = breakout expected
• Wide bands = heavy volatility
📊 Volume:
• Volume spike decides direction
• No volume = avoid entry
🟢 LONG Setup:
Breakout + volume + bullish candle close.
🔴 SHORT Setup:
Resistance rejection + weak momentum.
💰 SPOT Strategy:
Small entries only with proper risk control.
Bias: High Risk | High Reward
⚠️ Risk Warning:
No signal is 100% accurate. Always use stop-loss, avoid high leverage, and wait for 4H + 1D candle confirmation before entering any trade.
What’s your move today — LONG, SHORT, or WAIT?
Dragon Fly Official
#PolymarketHundredUWarGodChallenge
Market focus today: RSI behavior, Bollinger Band reaction, volume confirmation, and high-probability trade setups. No blind entries — confirmation matters.
━━━━━━━━━━━━━━
🔍 $TONUSDT Analysis (4H + 1D)
TON remains one of the strongest momentum coins, supported by ecosystem growth and strong trader interest. However, short-term overheating means chasing green candles could be risky.
📊 RSI:
• RSI above 70 = overbought zone, correction risk increases
• RSI between 50–65 = healthy bullish momentum
• RSI below 45 = weakness signal
📈 Bollinger Bands:
• Price near upper band = possible overextension
• Pullback toward middle band + bounce = healthier long setup
• Band squeeze = strong breakout possibility
📊 Volume:
• Strong green volume = buyers in control
• Weak breakout volume = fake breakout risk
• Sudden red volume increase = possible correction
🟢 LONG Setup:
Entry only after breakout confirmation with strong volume and bullish candle close.
🔴 SHORT Setup:
If resistance rejection appears and RSI starts cooling with selling pressure.
💰 SPOT Strategy:
Avoid FOMO buying. Better entry comes after pullback or consolidation.
Bias: Bullish Long-Term | Short-Term Pullback Risk
━━━━━━━━━━━━━━
🔍 $LABUSDT Analysis (4H + 1D)
LAB is moving in a highly volatile structure. Fast upside momentum can also create sharp pullbacks, so patience matters.
📊 RSI:
• RSI above 68 = profit-taking zone risk
• RSI 50–60 = balanced momentum
• RSI below 45 = bearish pressure
📈 Bollinger Bands:
• Wide bands = volatility expansion
• Tight bands = breakout incoming
• Lower band hold = possible recovery signal
📊 Volume:
• Rising volume confirms trend
• Falling volume during price rise = weak momentum warning
🟢 LONG Setup:
Support hold + bullish candle + volume confirmation.
🔴 SHORT Setup:
Support breakdown with aggressive selling volume.
💰 SPOT Strategy:
Small DCA buying only. Avoid emotional entries after pumps.
Bias: Neutral to Bullish | High Volatility
━━━━━━━━━━━━━━
🔍 $USUSDT Analysis (4H + 1D)
USUSDT remains a speculative and high-volatility market. Proper risk management is essential.
📊 RSI:
• Above 70 = caution for longs
• Below 30 = bounce potential zone
• Neutral RSI = wait for confirmation
📈 Bollinger Bands:
• Tight bands = breakout expected
• Wide bands = heavy volatility
📊 Volume:
• Volume spike decides direction
• No volume = avoid entry
🟢 LONG Setup:
Breakout + volume + bullish candle close.
🔴 SHORT Setup:
Resistance rejection + weak momentum.
💰 SPOT Strategy:
Small entries only with proper risk control.
Bias: High Risk | High Reward
⚠️ Risk Warning:
No signal is 100% accurate. Always use stop-loss, avoid high leverage, and wait for 4H + 1D candle confirmation before entering any trade.
What’s your move today — LONG, SHORT, or WAIT?
Dragon Fly Official
#PolymarketHundredUWarGodChallenge