#USPPIHits2.5YearHigh .
US PPI Hits 2.5-Year High: Market Impact Analysis on Bitcoin, Gold, and Trading Strategy
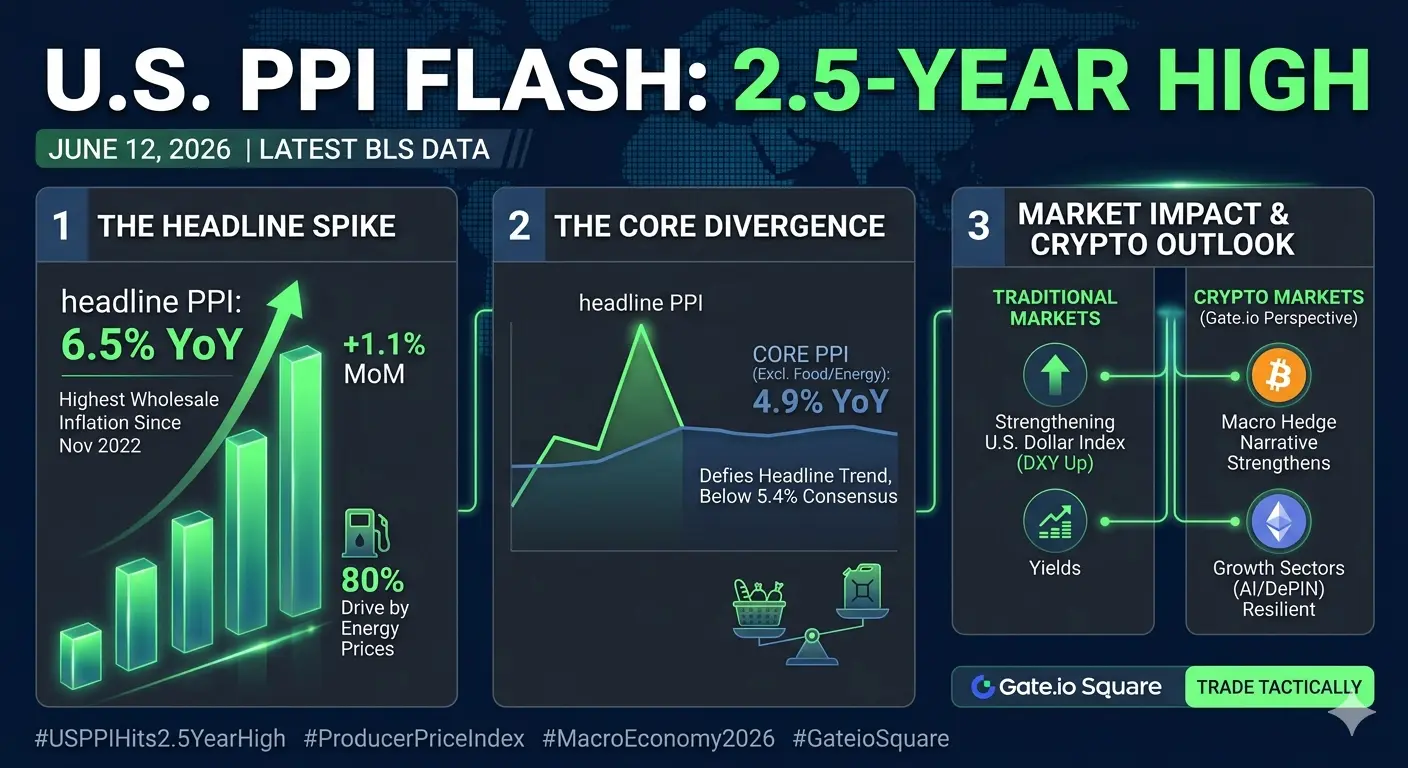
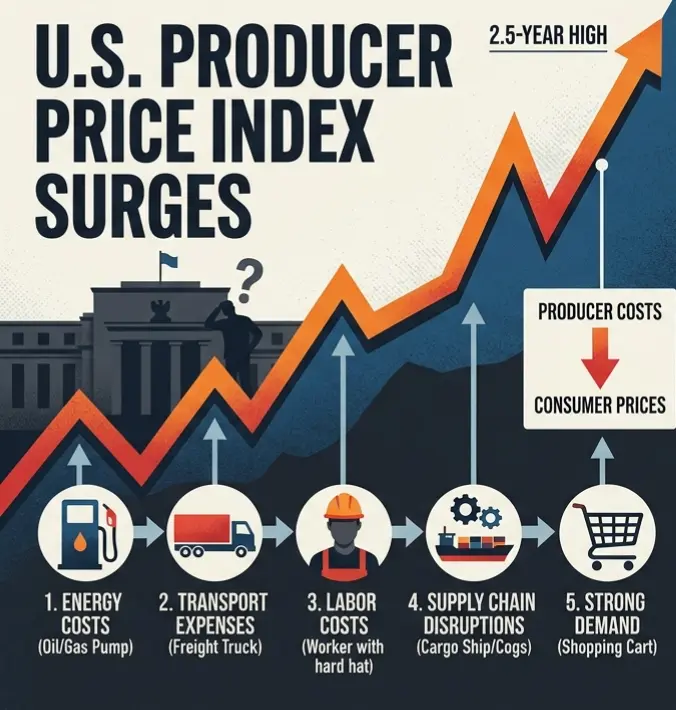
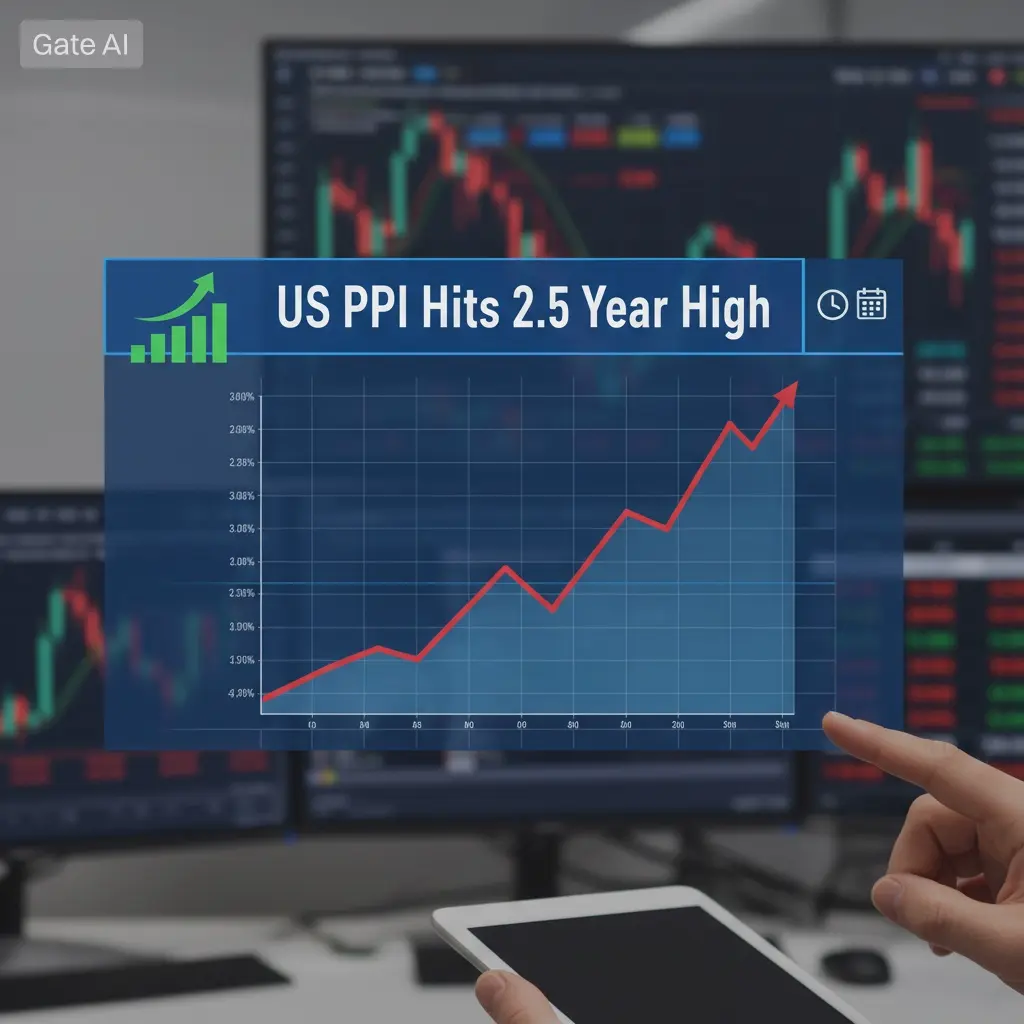
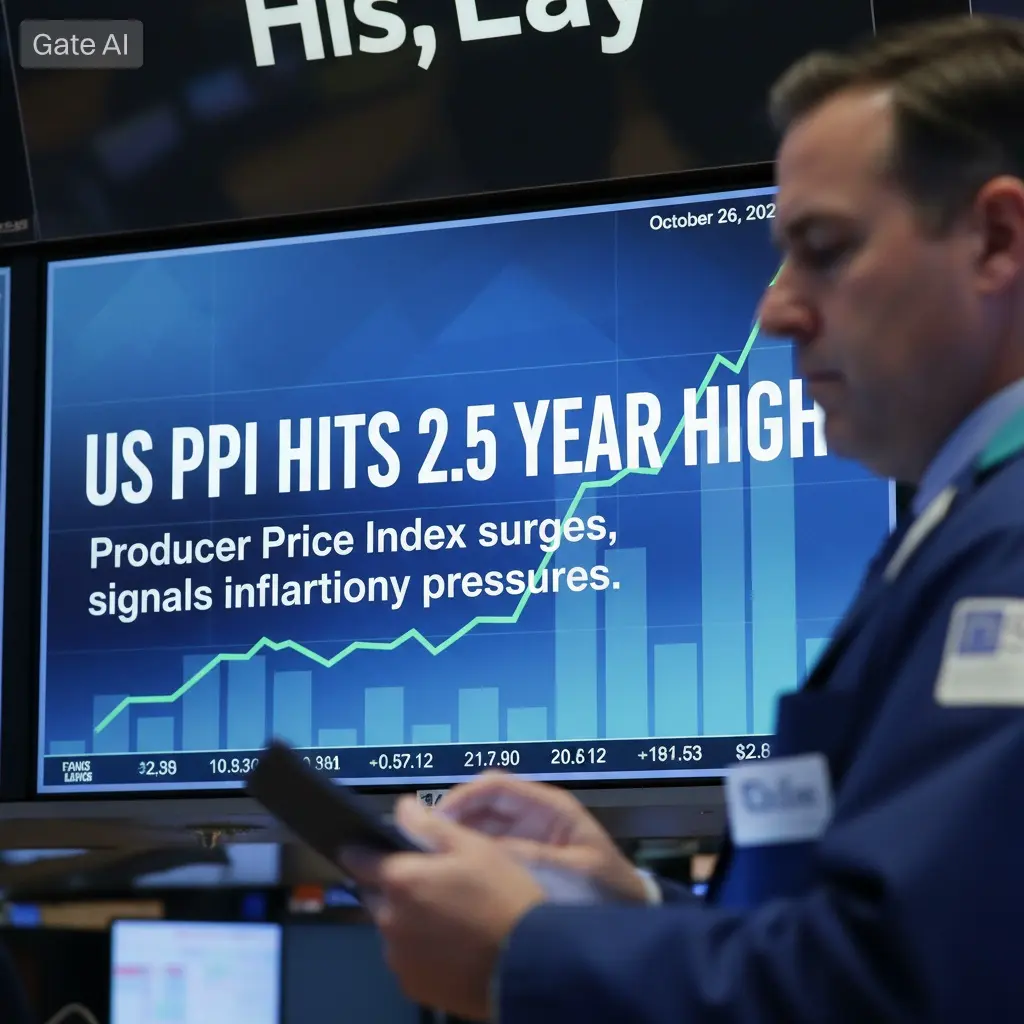
The United States Producer Price Index (PPI) has surged to its highest level in approximately 2.5 years, sending ripples through global financial markets. This development carries significant implications for investors across asset classes, from traditional equities and bonds to precious metals and cryptocurrencies.
Understanding the PPI Surge
The Producer Price Index measures the average change over time in the selling prices received by domestic producers for their output. When PPI rises sharply, it indicates that production costs for businesses are increasing substantially. These elevated input costs typically translate into higher consumer prices down the line, creating inflationary pressure throughout the economy.
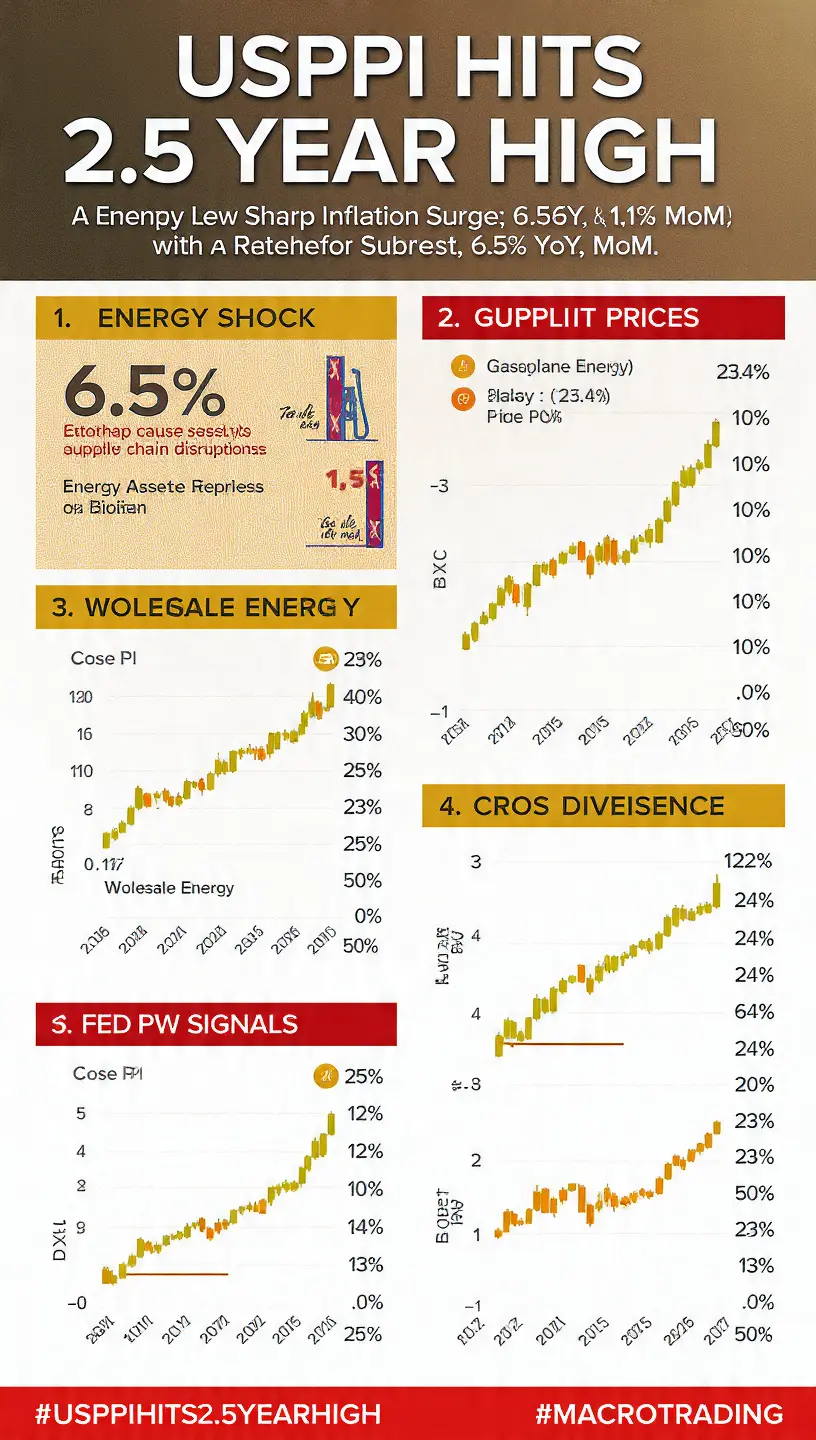
The recent PPI reading represents the most significant increase in producer prices since early 2023, driven primarily by surging energy costs, logistics bottlenecks, and persistent supply chain friction.
Additional Market Context:
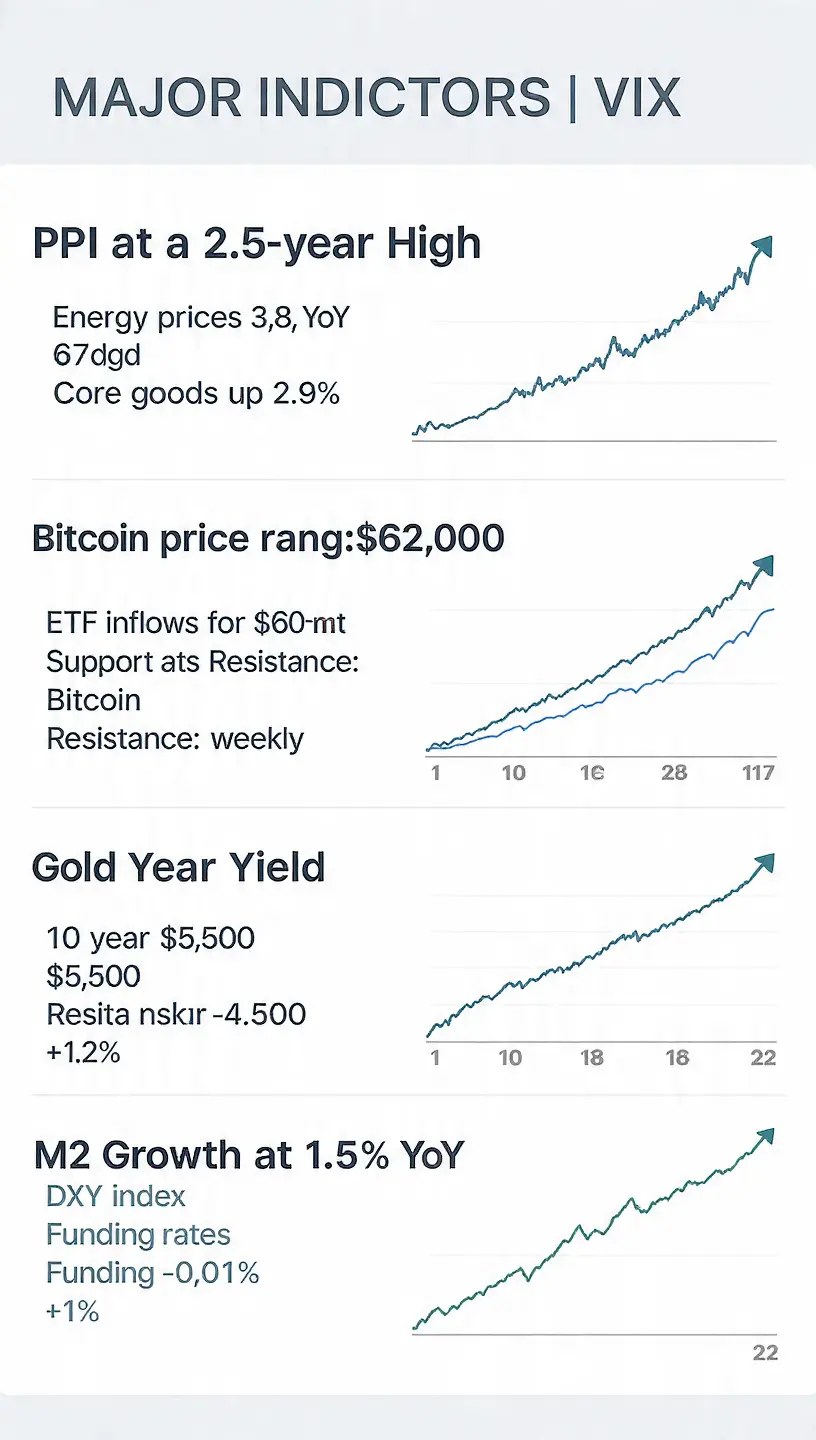
US Producer input cost growth: approximately +3.8% YoY
Energy component contribution: near 35% of total PPI increase
Core goods inflation: trending above +2.9% YoY
Global shipping cost volatility index: up roughly +12% quarter-on-quarter
Liquidity & Macro Market Conditions
Global liquidity conditions are tightening as central banks maintain restrictive monetary policy.
Global M2 liquidity growth: slowing to approximately +1.5% YoY
US dollar index (DXY): holding elevated near 105–107 range
10-year Treasury yield: fluctuating around 4.1% – 4.5%
Real yields: remaining positive at approximately 1.8% – 2.2%
Tighter liquidity conditions generally reduce speculative appetite in risk assets such as equities and cryptocurrencies, increasing volatility across markets.
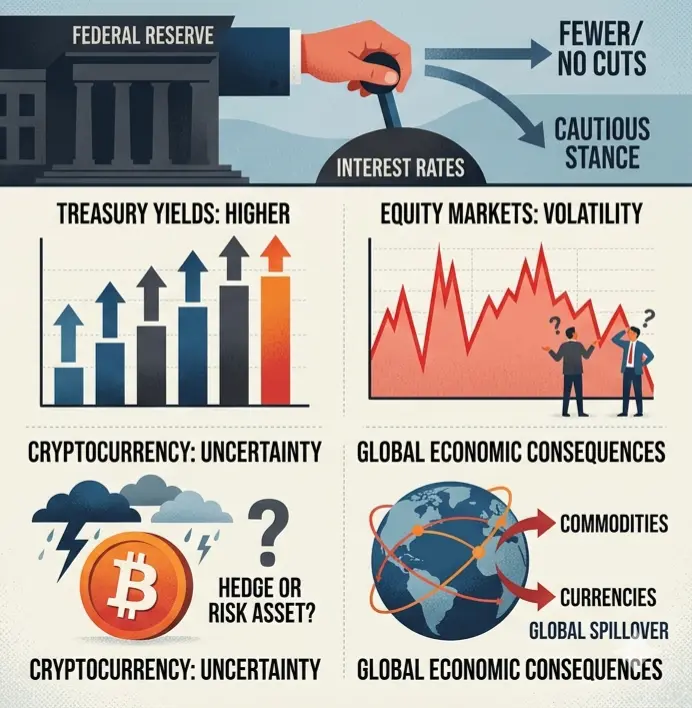
Federal Reserve Policy Implications
The elevated PPI reading has substantially altered market expectations regarding Federal Reserve monetary policy.
Probability of near-term rate cuts: reduced to around 25% – 30%
Expected policy rate range (2026): 4.75% – 5.25%
Fed balance sheet runoff: continuing at $60B/month Treasury reduction pace
Markets are increasingly pricing a “higher-for-longer” interest rate regime, which historically supports the US dollar while pressuring risk-on assets.
Market Liquidity & Risk Sentiment Indicators
Broader risk sentiment is shifting cautiously:
Crypto total market capitalization: fluctuating near $2.2T – $2.4T
24h spot trading volume: approximately $85B – $120B
Derivatives open interest (crypto): near $32B – $38B
Funding rates: mildly negative to neutral (-0.01% to +0.03%) indicating indecision
Altcoin dominance: slightly declining toward 38% – 40% range
Bitcoin dominance: strengthening near 52% – 54%
Impact on Traditional Markets
Equity markets are reacting with increased volatility as earnings expectations adjust to higher input costs.
S&P 500 volatility index (VIX): rising toward 18 – 22 range
Corporate earnings downgrade ratio: increasing to approximately 1.3 : 1 (downgrades vs upgrades)
Profit margin compression estimate: -1.5% to -2.5% sector-wide impact
Bond markets continue to price tighter conditions, with yield curve remaining partially inverted.
Gold Market Analysis
Gold remains caught between inflation support and interest rate pressure.
2026 Trading Range: $4,000 – $5,500 per ounce
2026 Record High (Late January): approximately $5,595 per ounce
Current price momentum: consolidating near $4,000–$4,300 zone
Gold ETF inflows: moderate at +1.2% monthly net inflow
Physical demand (Asia): rising approximately +6% quarter-on-quarter
Gold volatility index remains elevated, reflecting uncertainty around Fed policy direction.
Bitcoin and Cryptocurrency Market Impact
Bitcoin continues to react strongly to macroeconomic shifts and liquidity cycles.
Current Price Action: trading around $62,000 – $63,000 (e.g., $62,967)
2026 Highs: near $82,000 before correction phase
Spot trading volume: averaging $28B – $35B daily
ETF inflows (Bitcoin spot ETFs): approximately +$300M – $600M weekly net inflows
Stablecoin supply: near $165B, indicating sidelined liquidity
Market structure shows mixed sentiment with institutional accumulation coexisting alongside short-term profit-taking.
Bitcoin Market Structure & Technical Depth
Immediate Resistance: $65,000 – $67,000
Key Support Level: $60,000
Downside Liquidity Zones: $55,000 – $58,000
Upside Liquidity Cluster: $70,000 – $75,000
Additional technical indicators:
RSI: neutral zone (45–55 range)
MACD: flat momentum with weak bullish crossover attempts
Liquidation clusters: concentrated near $61K and $66K levels
Open interest skew: slightly short-biased after recent volatility spike
Trading Strategy Considerations
Bitcoin Strategy
Current conditions suggest a liquidity-driven range market with sharp volatility spikes around macro data releases.
Preferred approach: range trading between $60K–$67K
Breakout trigger: sustained daily close above $67K
Breakdown trigger: loss of $60K support with volume expansion
Leverage recommendation: reduced exposure due to volatility expansion
Market participation is increasingly event-driven, with CPI, PPI, and Fed commentary acting as primary catalysts.
Gold Trading Strategy
Accumulation zone: $4,000 – $4,200
Breakout confirmation: above $4,500 with volume expansion
Risk zone: breakdown below $4,000 psychological level
Institutional positioning suggests gradual hedging against macro uncertainty rather than aggressive directional bets.
Risk Management Essentials
Portfolio volatility expectation: elevated (+20%–35% range expansion potential)
Recommended max leverage: reduced to 2x – 5x range for active traders
Correlation risk: increasing between equities and crypto under macro shocks
Cash position strategy: maintaining 10%–25% liquidity buffer
Long-Term Outlook
If inflation remains persistent and liquidity tightens further, hard assets like Bitcoin and gold may experience structural support despite short-term pressure.
Bullish long-term scenario: liquidity expansion returning in 2027
Bearish medium-term scenario: prolonged restrictive policy into late 2026
Base case: sideways macro-driven consolidation phase
The US PPI reaching a 2.5-year high represents a major macroeconomic inflection point. It reinforces expectations of tighter monetary policy, weaker liquidity conditions, and increased cross-asset volatility.
Bitcoin and gold are both entering a phase where liquidity flows, ETF demand, and macro policy signals will dominate price action more than traditional technical structures alone.
Successful positioning in this environment requires:
Strict risk control
Liquidity awareness
Adaptive trading strategies
Macro-driven decision-making@Gate_Square
US PPI Hits 2.5-Year High: Market Impact Analysis on Bitcoin, Gold, and Trading Strategy
The United States Producer Price Index (PPI) has surged to its highest level in approximately 2.5 years, sending ripples through global financial markets. This development carries significant implications for investors across asset classes, from traditional equities and bonds to precious metals and cryptocurrencies.
Understanding the PPI Surge
The Producer Price Index measures the average change over time in the selling prices received by domestic producers for their output. When PPI rises sharply, it indicates that production costs for businesses are increasing substantially. These elevated input costs typically translate into higher consumer prices down the line, creating inflationary pressure throughout the economy.
The recent PPI reading represents the most significant increase in producer prices since early 2023, driven primarily by surging energy costs, logistics bottlenecks, and persistent supply chain friction.
Additional Market Context:
US Producer input cost growth: approximately +3.8% YoY
Energy component contribution: near 35% of total PPI increase
Core goods inflation: trending above +2.9% YoY
Global shipping cost volatility index: up roughly +12% quarter-on-quarter
Liquidity & Macro Market Conditions
Global liquidity conditions are tightening as central banks maintain restrictive monetary policy.
Global M2 liquidity growth: slowing to approximately +1.5% YoY
US dollar index (DXY): holding elevated near 105–107 range
10-year Treasury yield: fluctuating around 4.1% – 4.5%
Real yields: remaining positive at approximately 1.8% – 2.2%
Tighter liquidity conditions generally reduce speculative appetite in risk assets such as equities and cryptocurrencies, increasing volatility across markets.
Federal Reserve Policy Implications
The elevated PPI reading has substantially altered market expectations regarding Federal Reserve monetary policy.
Probability of near-term rate cuts: reduced to around 25% – 30%
Expected policy rate range (2026): 4.75% – 5.25%
Fed balance sheet runoff: continuing at $60B/month Treasury reduction pace
Markets are increasingly pricing a “higher-for-longer” interest rate regime, which historically supports the US dollar while pressuring risk-on assets.
Market Liquidity & Risk Sentiment Indicators
Broader risk sentiment is shifting cautiously:
Crypto total market capitalization: fluctuating near $2.2T – $2.4T
24h spot trading volume: approximately $85B – $120B
Derivatives open interest (crypto): near $32B – $38B
Funding rates: mildly negative to neutral (-0.01% to +0.03%) indicating indecision
Altcoin dominance: slightly declining toward 38% – 40% range
Bitcoin dominance: strengthening near 52% – 54%
Impact on Traditional Markets
Equity markets are reacting with increased volatility as earnings expectations adjust to higher input costs.
S&P 500 volatility index (VIX): rising toward 18 – 22 range
Corporate earnings downgrade ratio: increasing to approximately 1.3 : 1 (downgrades vs upgrades)
Profit margin compression estimate: -1.5% to -2.5% sector-wide impact
Bond markets continue to price tighter conditions, with yield curve remaining partially inverted.
Gold Market Analysis
Gold remains caught between inflation support and interest rate pressure.
2026 Trading Range: $4,000 – $5,500 per ounce
2026 Record High (Late January): approximately $5,595 per ounce
Current price momentum: consolidating near $4,000–$4,300 zone
Gold ETF inflows: moderate at +1.2% monthly net inflow
Physical demand (Asia): rising approximately +6% quarter-on-quarter
Gold volatility index remains elevated, reflecting uncertainty around Fed policy direction.
Bitcoin and Cryptocurrency Market Impact
Bitcoin continues to react strongly to macroeconomic shifts and liquidity cycles.
Current Price Action: trading around $62,000 – $63,000 (e.g., $62,967)
2026 Highs: near $82,000 before correction phase
Spot trading volume: averaging $28B – $35B daily
ETF inflows (Bitcoin spot ETFs): approximately +$300M – $600M weekly net inflows
Stablecoin supply: near $165B, indicating sidelined liquidity
Market structure shows mixed sentiment with institutional accumulation coexisting alongside short-term profit-taking.
Bitcoin Market Structure & Technical Depth
Immediate Resistance: $65,000 – $67,000
Key Support Level: $60,000
Downside Liquidity Zones: $55,000 – $58,000
Upside Liquidity Cluster: $70,000 – $75,000
Additional technical indicators:
RSI: neutral zone (45–55 range)
MACD: flat momentum with weak bullish crossover attempts
Liquidation clusters: concentrated near $61K and $66K levels
Open interest skew: slightly short-biased after recent volatility spike
Trading Strategy Considerations
Bitcoin Strategy
Current conditions suggest a liquidity-driven range market with sharp volatility spikes around macro data releases.
Preferred approach: range trading between $60K–$67K
Breakout trigger: sustained daily close above $67K
Breakdown trigger: loss of $60K support with volume expansion
Leverage recommendation: reduced exposure due to volatility expansion
Market participation is increasingly event-driven, with CPI, PPI, and Fed commentary acting as primary catalysts.
Gold Trading Strategy
Accumulation zone: $4,000 – $4,200
Breakout confirmation: above $4,500 with volume expansion
Risk zone: breakdown below $4,000 psychological level
Institutional positioning suggests gradual hedging against macro uncertainty rather than aggressive directional bets.
Risk Management Essentials
Portfolio volatility expectation: elevated (+20%–35% range expansion potential)
Recommended max leverage: reduced to 2x – 5x range for active traders
Correlation risk: increasing between equities and crypto under macro shocks
Cash position strategy: maintaining 10%–25% liquidity buffer
Long-Term Outlook
If inflation remains persistent and liquidity tightens further, hard assets like Bitcoin and gold may experience structural support despite short-term pressure.
Bullish long-term scenario: liquidity expansion returning in 2027
Bearish medium-term scenario: prolonged restrictive policy into late 2026
Base case: sideways macro-driven consolidation phase
The US PPI reaching a 2.5-year high represents a major macroeconomic inflection point. It reinforces expectations of tighter monetary policy, weaker liquidity conditions, and increased cross-asset volatility.
Bitcoin and gold are both entering a phase where liquidity flows, ETF demand, and macro policy signals will dominate price action more than traditional technical structures alone.
Successful positioning in this environment requires:
Strict risk control
Liquidity awareness
Adaptive trading strategies
Macro-driven decision-making@Gate_Square