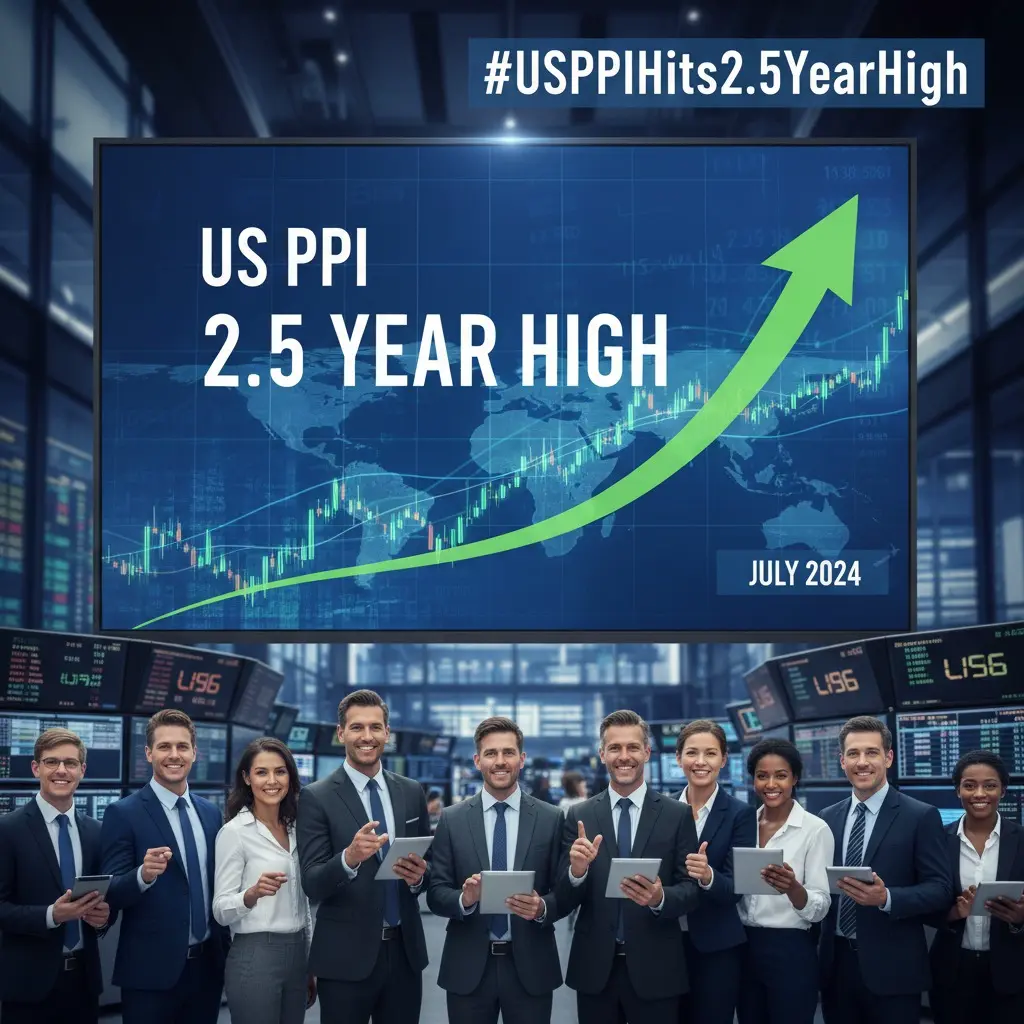


#USPPIHits2.5YearHigh
The United States Producer Price Index (PPI) has surged to its highest level in nearly 2.5 years, creating significant uncertainty across global financial markets. Producer inflation is one of the most closely watched economic indicators because it reflects rising costs at the manufacturing level before they reach consumers. When PPI increases sharply, investors begin pricing in tighter monetary policy, higher interest rates, reduced liquidity, and slower economic growth.
For cryptocurrency markets, this macroeconomic shift is particularly important. Bitcoin, Ethereum, Solana, and the broader digital asset ecosystem have become increasingly correlated with liquidity conditions, Federal Reserve policy, Treasury yields, and institutional capital flows. The latest PPI data suggests inflation remains persistent, potentially delaying interest-rate cuts and keeping financial conditions restrictive for longer than expected.
Understanding the Latest PPI Data
The latest US Producer Price Index registered approximately 6.5% year-over-year, marking its strongest reading in around 2.5 years. On a monthly basis, producer prices increased close to 0.8%, while goods inflation accelerated by 2.8%, accounting for nearly 80% of the overall increase.
Energy prices, transportation costs, manufacturing expenses, and supply chain disruptions remain the biggest contributors to rising producer inflation. Historically, elevated PPI eventually feeds into Consumer Price Index (CPI) data, increasing the likelihood that inflation remains above the Federal Reserve's long-term target.
Higher producer inflation means businesses face rising costs, which are often passed on to consumers through higher prices, creating another wave of inflationary pressure.
Federal Reserve Policy and Market Expectations
The Federal Reserve now faces an increasingly difficult balancing act between controlling inflation and supporting economic growth.
Markets previously expected multiple interest-rate cuts during 2026, but the latest inflation data has significantly reduced those expectations. Investors are now pricing in a much higher probability that rates remain elevated for an extended period or even increase further if inflation continues accelerating.
Higher interest rates directly affect:
Consumer borrowing
Corporate financing
Mortgage rates
Treasury yields
Equity valuations
Cryptocurrency liquidity
Every additional 25 basis point (0.25%) increase reduces speculative liquidity and increases the attractiveness of traditional fixed-income investments.
Global Liquidity Conditions
Liquidity remains the single most important driver of cryptocurrency prices.
When central banks tighten monetary policy:
Money supply growth slows
Institutional leverage decreases
Venture capital investment declines
Stablecoin creation slows
Exchange liquidity weakens
Trading activity becomes more volatile
Global crypto market capitalization currently fluctuates around $3.8 trillion to over $4.2 trillion, while total daily trading volume often ranges between $180 billion and $250 billion during active market sessions.
Periods of declining liquidity generally lead to wider bid-ask spreads, thinner order books, and larger price swings.
Bitcoin Market Analysis
Bitcoin continues to dominate the digital asset ecosystem with approximately 58%–62% market dominance.
Average daily spot and derivatives trading volume frequently ranges between:
$45 billion – $80 billion
Bitcoin futures open interest often exceeds:
$35 billion – $45 billion
Large institutional participation means macroeconomic news rapidly affects price action.
Negative funding rates combined with rising open interest frequently indicate aggressive short positioning. If buying pressure suddenly appears, these positions can trigger powerful short squeezes resulting in 5%–10% intraday rallies.
Conversely, declining liquidity alongside rising leverage can create liquidation cascades that accelerate downside moves.
Ethereum Market Structure
Ethereum remains the second-largest cryptocurrency by market capitalization.
Its average daily trading volume typically ranges between:
$20 billion – $40 billion
ETH derivatives contribute another:
$15 billion – $25 billion
Institutional demand continues growing through staking, DeFi, tokenization, and ETF-related interest.
However, elevated Treasury yields reduce demand for risk assets, causing Ethereum to underperform during periods of monetary tightening.
Long-term fundamentals remain supported by ecosystem expansion and continuous network upgrades.
Solana Liquidity Analysis
Solana has become one of the fastest-growing blockchain ecosystems but also one of the most volatile.
Average daily trading volume often ranges between:
$5 billion – $12 billion
During bullish cycles, Solana can outperform Bitcoin by:
15%–30%
During bearish macroeconomic conditions, corrections of:
20%–35%
are not uncommon due to thinner liquidity and speculative positioning.
Developer growth and ecosystem expansion continue supporting long-term adoption despite short-term volatility.
Stablecoin Liquidity
Stablecoins represent available buying power waiting to enter crypto markets.
Combined market capitalization of USDT, USDC, and other stablecoins exceeds:
$250 billion
When stablecoin supply expands:
Exchange liquidity improves
Institutional buying increases
Spot demand strengthens
Market recoveries accelerate
When supply contracts, liquidity tightens and rallies become harder to sustain.
Trading Volume Analysis
Trading volume provides one of the clearest indicators of market conviction.
Current crypto markets regularly process:
$180B–$250B daily total volume
Bitcoin:
$45B–$80B daily volume
Ethereum:
$20B–$40B daily volume
Solana:
$5B–$12B daily volume
Derivatives account for roughly:
55%–65% of total crypto activity
Spot markets represent:
35%–45%
Higher volume during rallies confirms institutional participation, while weak volume often signals unsustainable moves.
Open Interest and Leverage
Open interest has become a critical indicator for predicting volatility.
Bitcoin futures:
$35B–$45B open interest
Ethereum futures:
$18B–$25B
Combined crypto derivatives:
Frequently exceed $100B
Rapid increases in open interest without corresponding spot buying often indicate excessive leverage, increasing liquidation risk.
Funding Rates
Funding rates reveal trader positioning.
Positive funding:
Long traders pay shorts
Bullish sentiment dominates
Negative funding:
Shorts pay longs
Bearish positioning increases
Short squeeze probability rises
Historically, deeply negative funding combined with strong spot buying has preceded significant Bitcoin rallies.
Institutional ETF Flows
Spot ETF activity has become one of the strongest liquidity drivers.
Daily ETF inflows or outflows can exceed:
Hundreds of millions of dollars
Large positive inflows generally strengthen support levels.
Sustained outflows reduce buying pressure and often coincide with corrections.
Institutional participation continues increasing despite short-term macroeconomic uncertainty
Whale Activity
Large holders continue influencing market direction.
Professional traders monitor:
Wallet accumulation
Exchange inflows
Exchange outflows
OTC transactions
Custodian balances
Heavy exchange withdrawals often indicate long-term accumulation.
Large exchange deposits may signal upcoming selling pressure.
Liquidation Analysis
Liquidations amplify volatility.
During major macro events, forced liquidations frequently exceed:
$500 million
$1 billion
Occasionally over $2 billion within 24 hours
Long liquidations accelerate crashes.
Short liquidations fuel explosive rallies.
Monitoring liquidation heatmaps helps identify potential reversal zones.
Dollar Index and Treasury Yields
A stronger US Dollar generally pressures cryptocurrencies.
Higher Treasury yields above:
4%–5%
make government bonds more attractive than speculative assets.
As capital rotates toward fixed income, crypto demand often weakens temporarily.
Risk Management Strategy
Professional investors should monitor:
PPI
CPI
Federal Reserve meetings
Treasury yields
DXY
ETF flows
Open interest
Funding rates
Stablecoin supply
Exchange liquidity
Position sizing and disciplined risk management become essential during inflation-driven volatility.
Avoid excessive leverage and focus on long-term accumulation during periods of panic.
Long-Term Outlook
Although elevated producer inflation creates short-term pressure, crypto markets remain fundamentally driven by adoption and liquidity cycles.
If inflation moderates and the Federal Reserve eventually pivots toward easing, trillions of dollars in sidelined capital could re-enter risk assets.
Bitcoin, Ethereum, and Solana would likely benefit from:
Improved liquidity
Stronger ETF demand
Lower Treasury yields
Increased institutional participation
Renewed retail confidence
Until then, traders should closely monitor macroeconomic data, trading volumes, funding rates, liquidity conditions, and institutional flows, as these metrics often provide earlier signals of market direction than price action alone.@Gate_Square