

【 Monthly strong rebound, is a new wave of BTC rally coming? 】
Starting in May, what new changes have appeared in Bitcoin's trend for this new month? Let's analyze together.
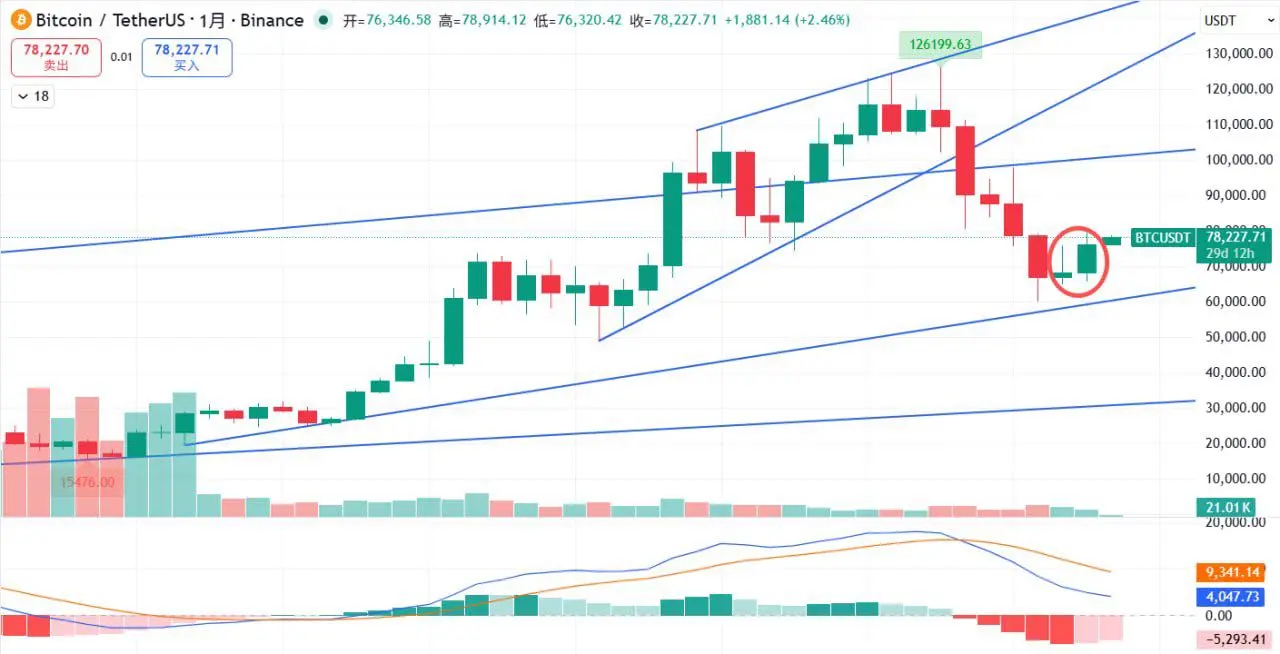
First, the monthly chart has closed, and from the monthly perspective, Bitcoin is looking quite bullish. The April candlestick has completely engulfed the March upper shadow, forming a bullish engulfing pattern, which is a strong bullish signal. Plus, the MACD histogram is shrinking, and since the monthly cycle is quite large, we can judge that May will be a good month, at least not experiencing the previous sharp decline. It will likely see a narrowing of the decline and a start of an upward move.
But here, a reminder: this is only the end of a downward trend, not a complete trend reversal. Looking at the MACD, it is still some distance from the zero line. Additionally, considering the previous bear market timing and decline patterns as "carving a boat to seek a sword," a comprehensive judgment suggests that after the rebound, there will still be a final dip structure before a reasonable upward trend.
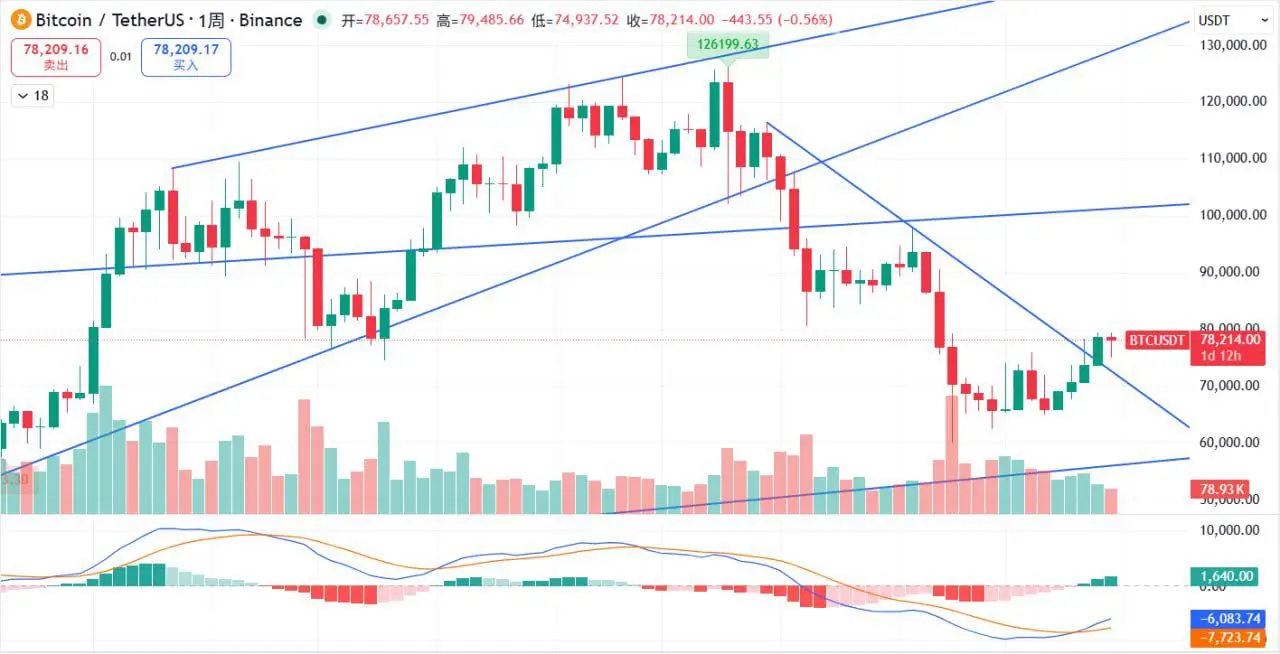
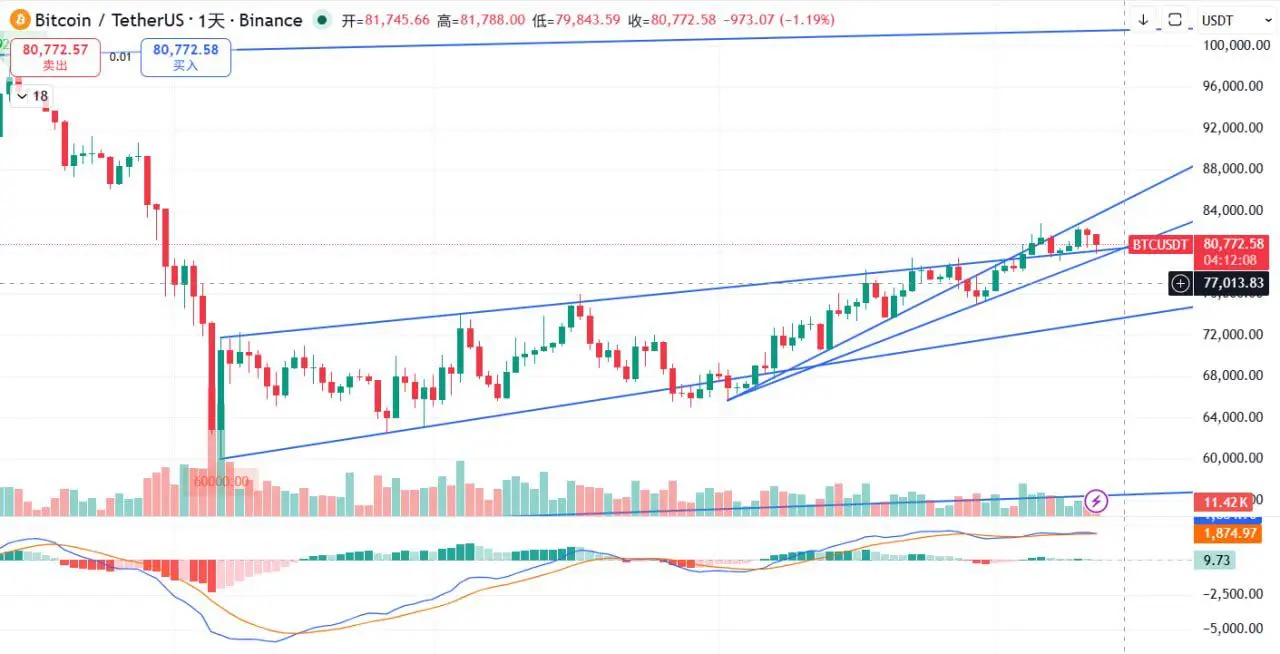
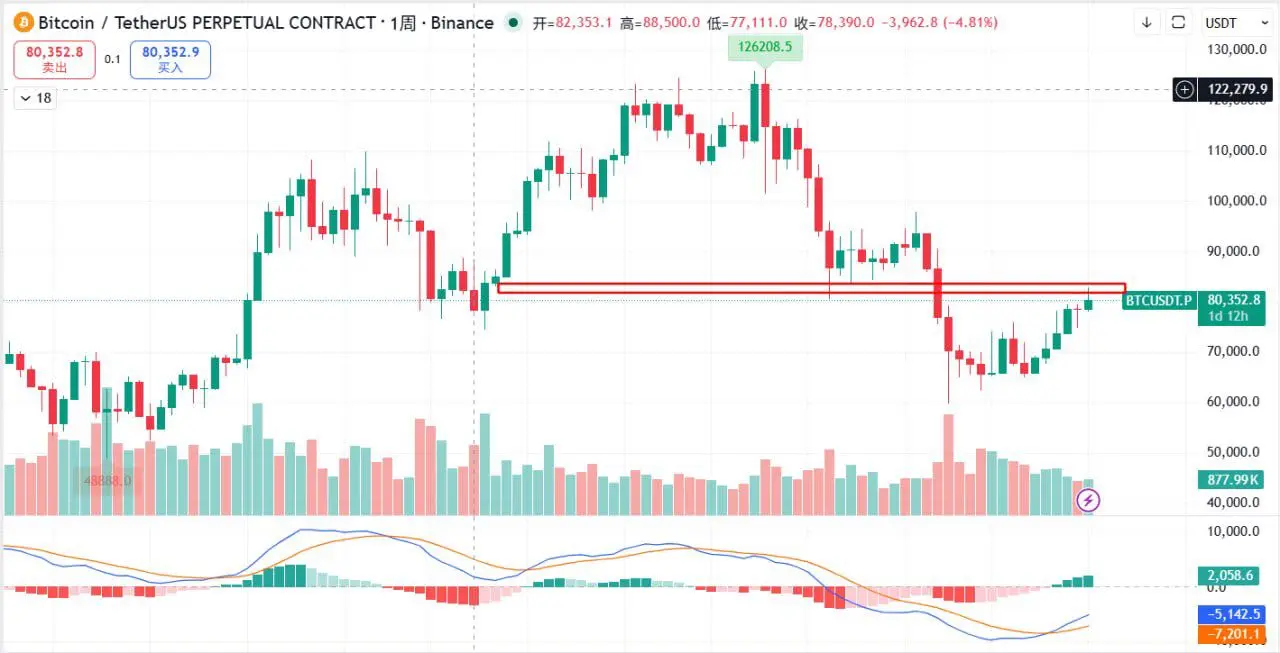
From the weekly chart, a double bottom pattern has formed, the neckline has been broken and stabilized, and the downward trendline has been broken and stabilized, indicating potential for further upward movement.
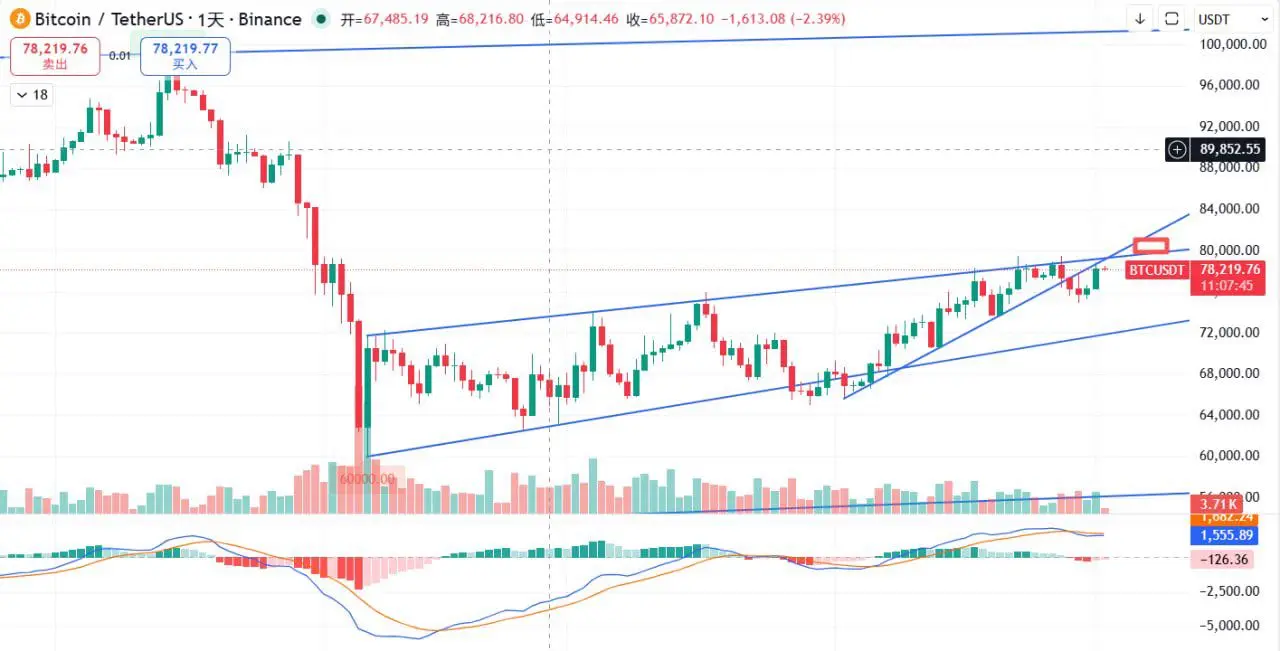
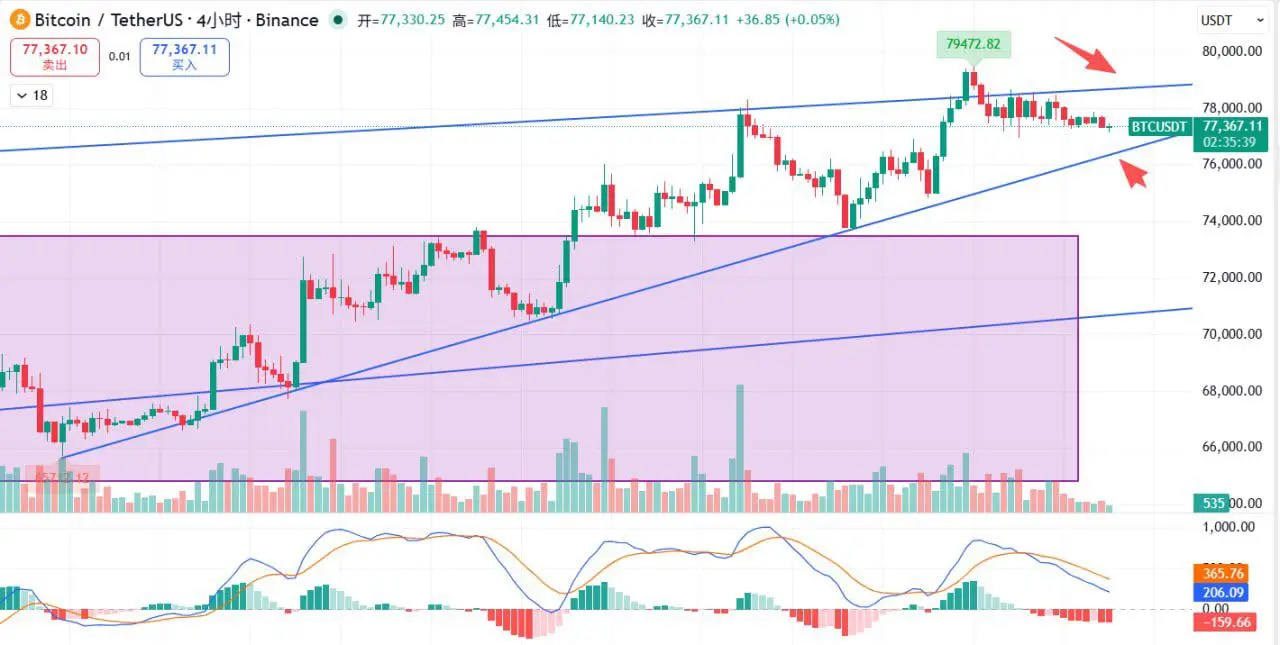
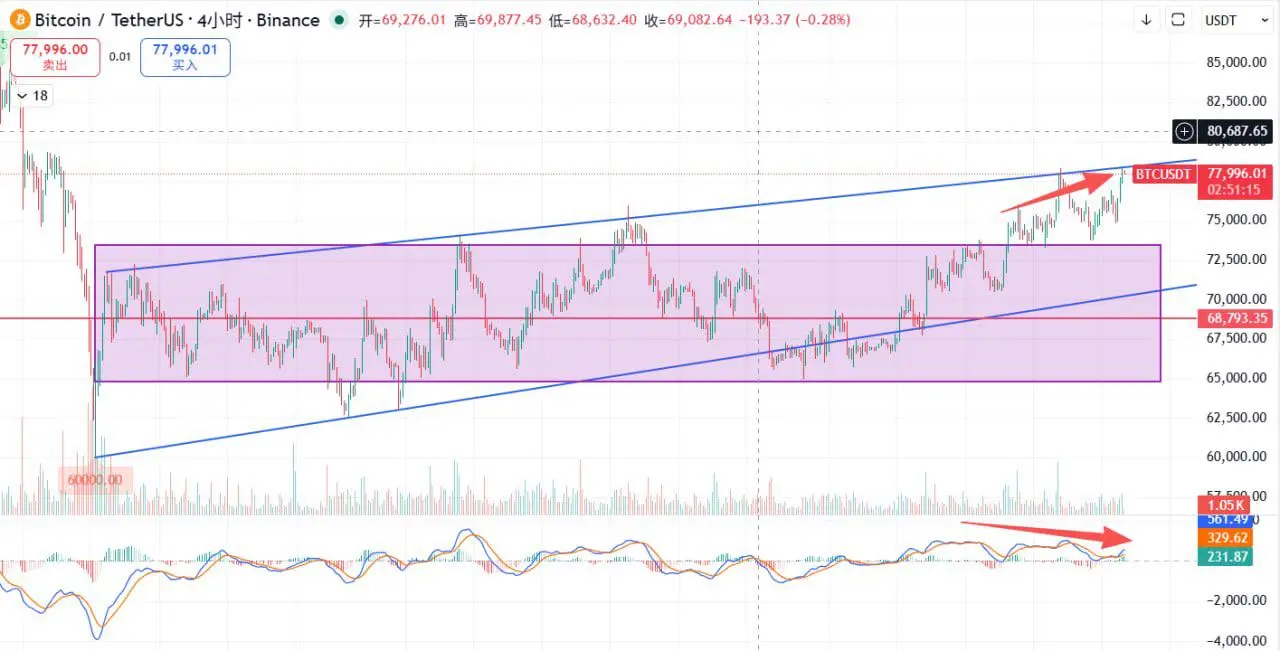
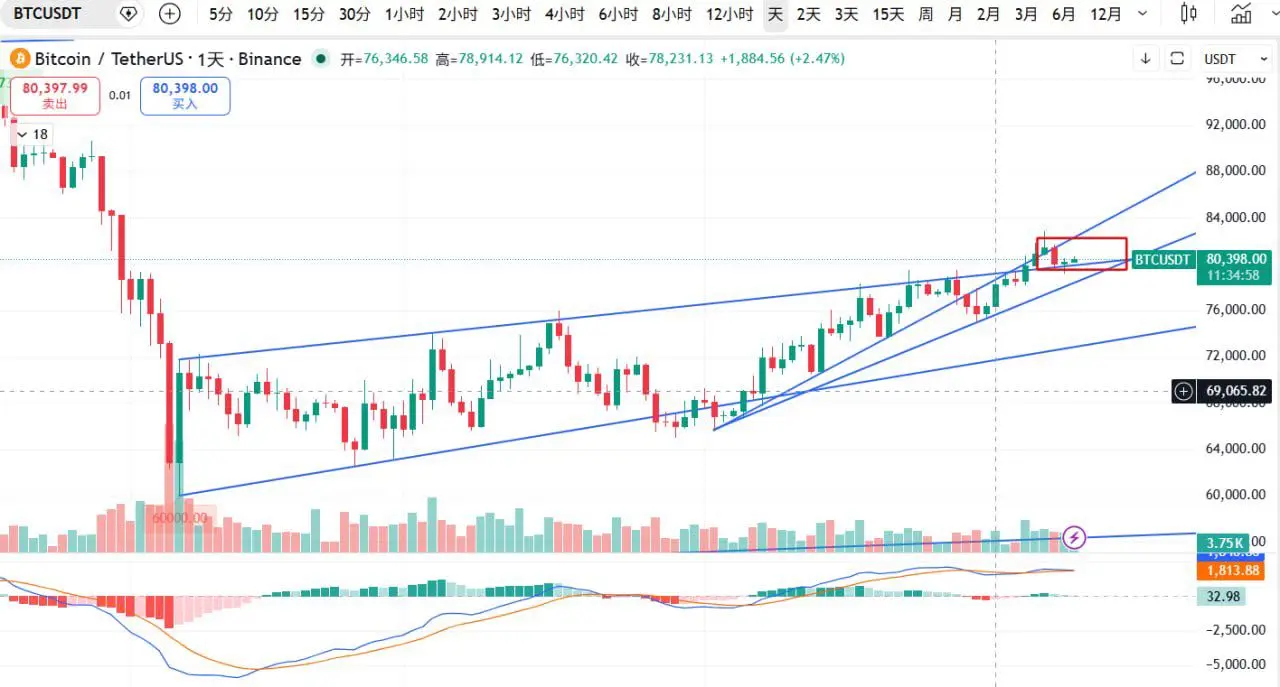
On the daily chart, Bitcoin has once again reached the upper edge of the flag pattern, which may face some resistance here, requiring some consolidation. Due to the improvement of the larger cycle pattern, the outlook remains optimistic for a breakout, heading towards the CME gap pressure we have mentioned multiple times!
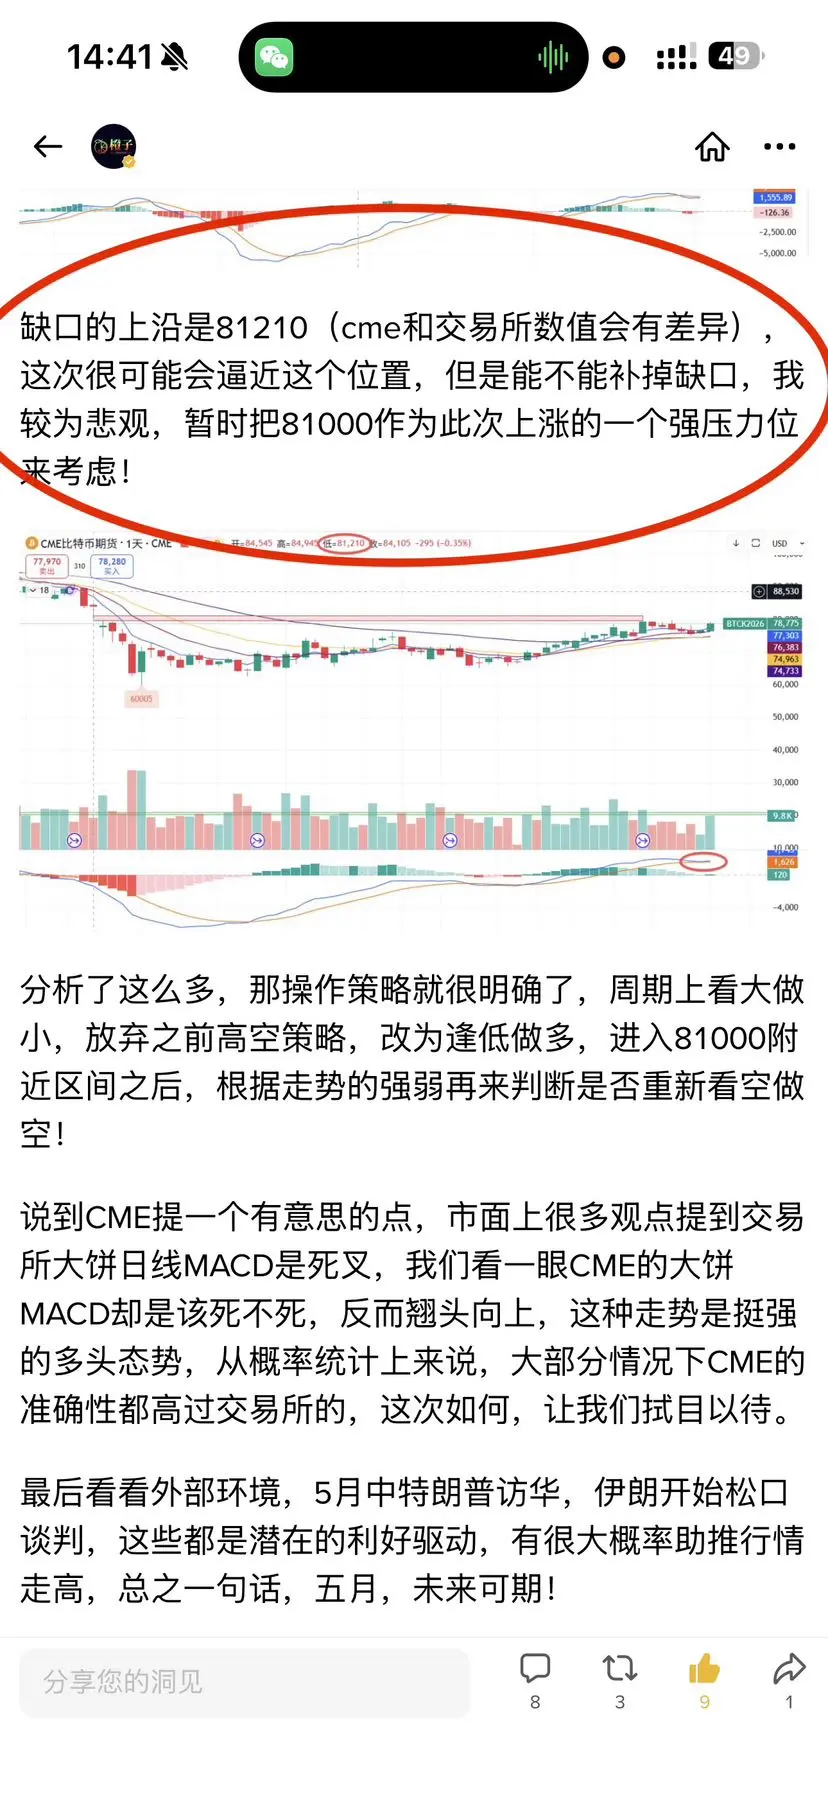
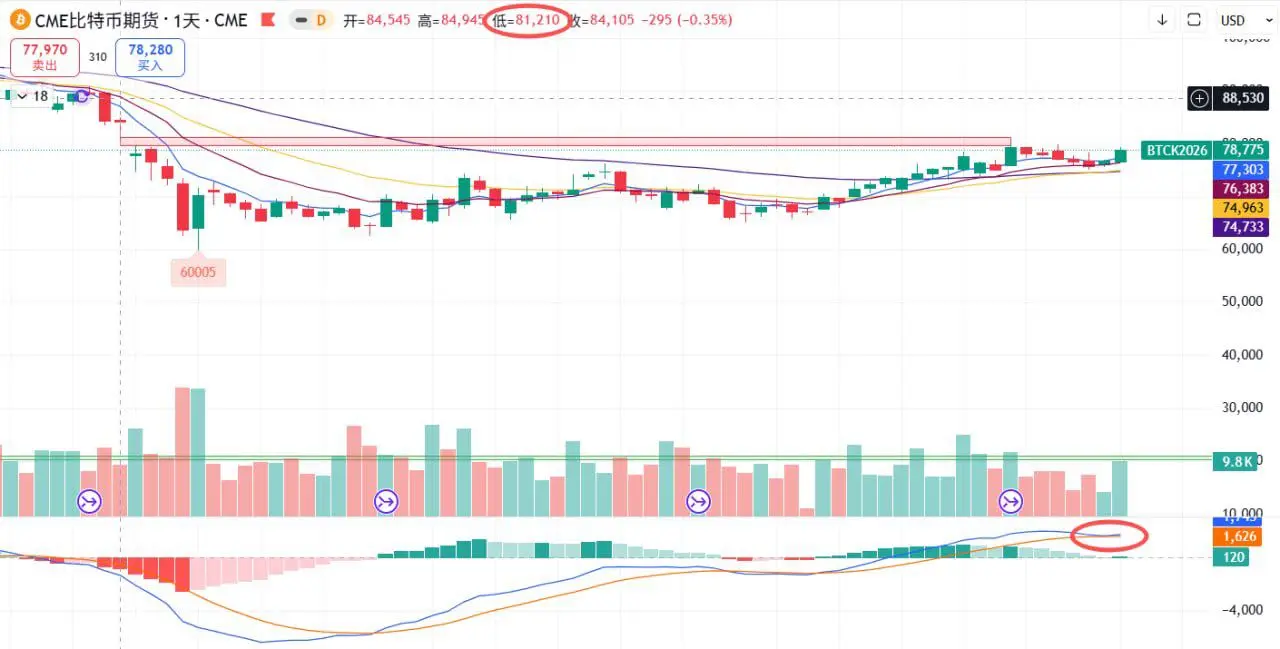
The upper edge of the gap is at 81,210 (CME and exchange values may differ). This time, it is very likely to approach this level, but whether the gap will be filled is uncertain. I am somewhat pessimistic about that, temporarily considering 81,000 as a strong resistance level for this rally.
Having analyzed so much, the trading strategy is quite clear: on a cycle basis, go for smaller timeframes; abandon the previous high-altitude short strategy and switch to buying on dips. After entering the 81,000 zone, judge whether to re-enter short positions based on the strength of the trend.
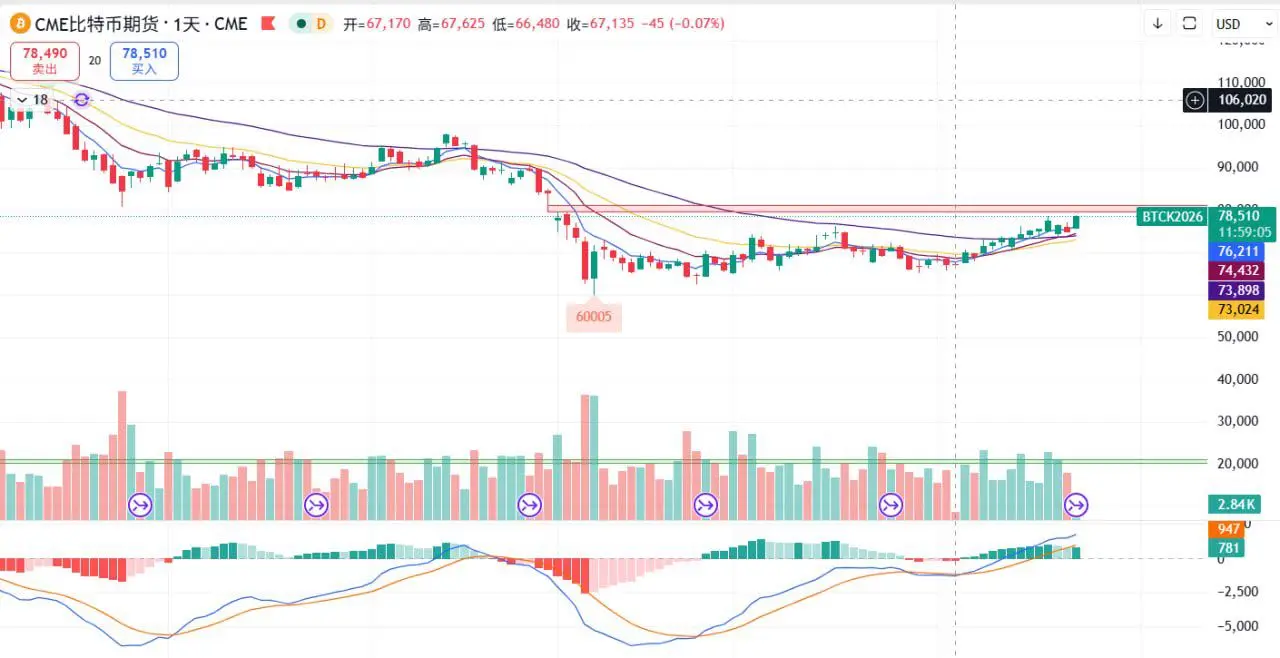
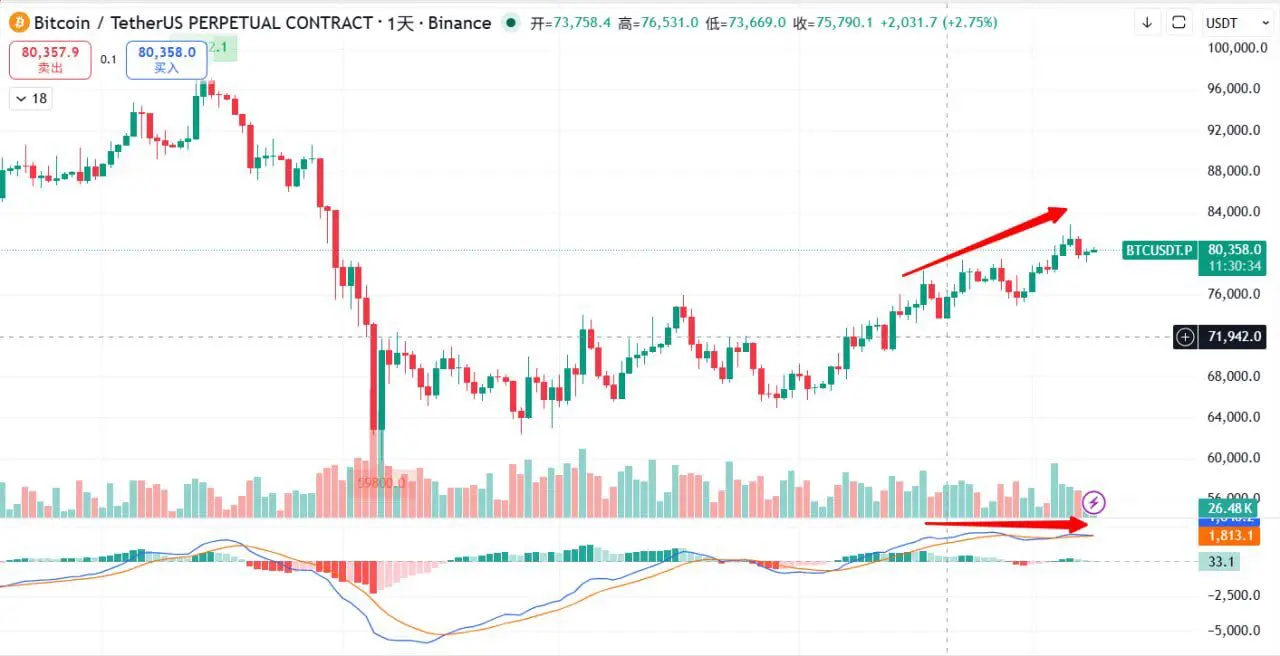
Regarding CME, here's an interesting point: many market opinions mention that the daily MACD of the exchange's Bitcoin is a death cross. However, looking at CME's Bitcoin MACD, it is not dead but instead turning upward. This indicates a strong bullish trend. Statistically, CME's signals are often more accurate than the exchange's. Let's wait and see how this develops.
Finally, looking at the external environment: in May, Trump visits China, and Iran begins to loosen negotiations. These are potential positive drivers that could boost the market. In summary, May looks promising for the future!
Starting in May, what new changes have appeared in Bitcoin's trend for this new month? Let's analyze together.
First, the monthly chart has closed, and from the monthly perspective, Bitcoin is looking quite bullish. The April candlestick has completely engulfed the March upper shadow, forming a bullish engulfing pattern, which is a strong bullish signal. Plus, the MACD histogram is shrinking, and since the monthly cycle is quite large, we can judge that May will be a good month, at least not experiencing the previous sharp decline. It will likely see a narrowing of the decline and a start of an upward move.
But here, a reminder: this is only the end of a downward trend, not a complete trend reversal. Looking at the MACD, it is still some distance from the zero line. Additionally, considering the previous bear market timing and decline patterns as "carving a boat to seek a sword," a comprehensive judgment suggests that after the rebound, there will still be a final dip structure before a reasonable upward trend.
From the weekly chart, a double bottom pattern has formed, the neckline has been broken and stabilized, and the downward trendline has been broken and stabilized, indicating potential for further upward movement.
On the daily chart, Bitcoin has once again reached the upper edge of the flag pattern, which may face some resistance here, requiring some consolidation. Due to the improvement of the larger cycle pattern, the outlook remains optimistic for a breakout, heading towards the CME gap pressure we have mentioned multiple times!
The upper edge of the gap is at 81,210 (CME and exchange values may differ). This time, it is very likely to approach this level, but whether the gap will be filled is uncertain. I am somewhat pessimistic about that, temporarily considering 81,000 as a strong resistance level for this rally.
Having analyzed so much, the trading strategy is quite clear: on a cycle basis, go for smaller timeframes; abandon the previous high-altitude short strategy and switch to buying on dips. After entering the 81,000 zone, judge whether to re-enter short positions based on the strength of the trend.
Regarding CME, here's an interesting point: many market opinions mention that the daily MACD of the exchange's Bitcoin is a death cross. However, looking at CME's Bitcoin MACD, it is not dead but instead turning upward. This indicates a strong bullish trend. Statistically, CME's signals are often more accurate than the exchange's. Let's wait and see how this develops.
Finally, looking at the external environment: in May, Trump visits China, and Iran begins to loosen negotiations. These are potential positive drivers that could boost the market. In summary, May looks promising for the future!