Summary
-
The crypto market shifted from an early May rally to a mid-month pullback, followed by low volatility consolidation toward month end. BTC, ETH, and SOL all established local highs during the first half of the month before entering correction mode. Weaker ETF inflows, combined with persistently high perpetual futures activity, created a market structure characterized by weak spot demand and leverage driven price discovery.
-
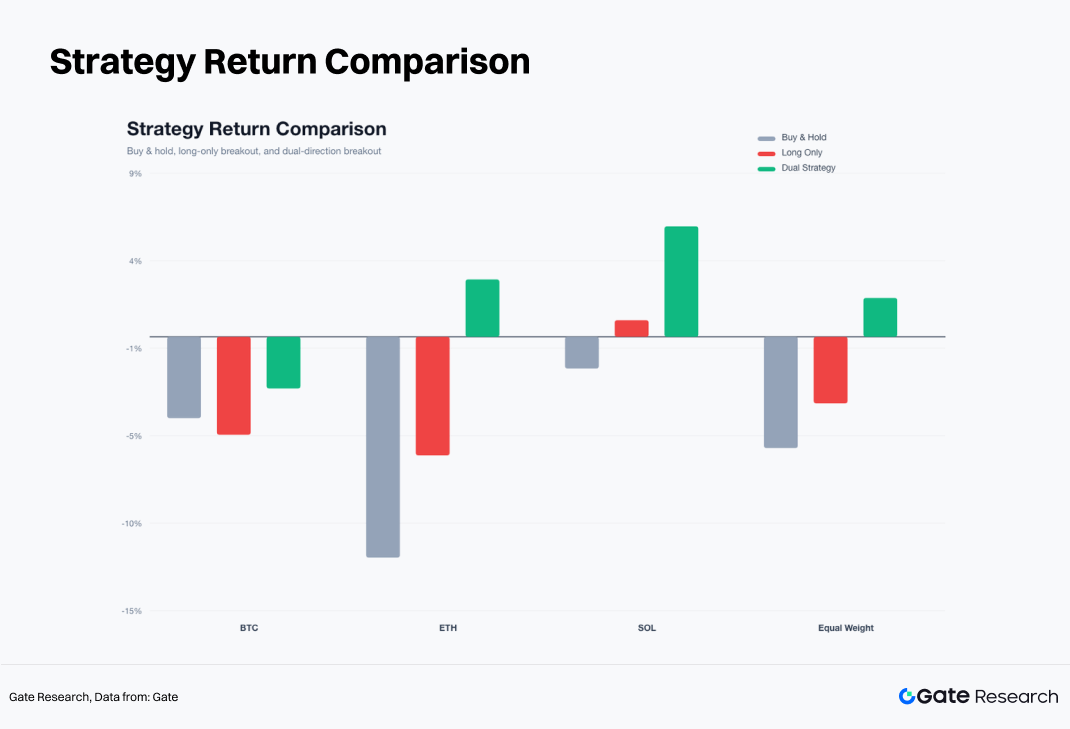
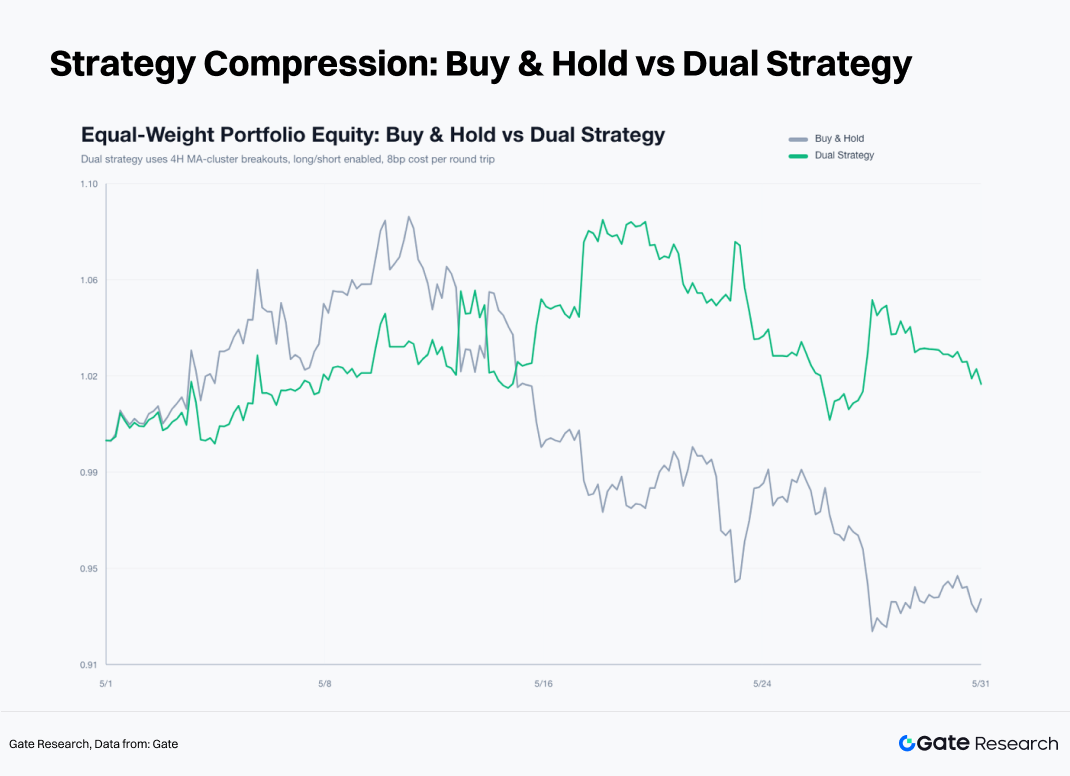
The long short moving average cluster breakout strategy delivered the strongest performance. An equal weighted buy and hold portfolio across BTC, ETH, and SOL returned approximately -6.09%, while the long only strategy returned -3.65%. The long short version generated a gain of approximately +2.11%. Most profits came from short trend trades in ETH and SOL, confirming that May's market environment was better suited to two sided trends following strategies.
-
In a low volatility compression environment, disciplined execution outperformed discretionary decision making. The EMA12 exit rule effectively limited losses from false breakouts, while the 3R take profit mechanism preserved gains from trend expansion. With the market still in a directional decision phase, identifying market regimes, managing risk, and systematically executing both long and short signals provided a more effective framework than chasing momentum based on subjective judgment.
The defining feature of the crypto market in May was the divergence between spot demand and leveraged trading activity following the early month rally. BTC, ETH, and SOL all established local highs in the first half of May before entering a period of correction and low volatility consolidation. BTC declined from a 4 hour closing price of $77,117.4 at the beginning of the month to $73,684.0 at month end, delivering a monthly return of -4.45%. ETH fell from $2,283.02 to $2,007.0, posting a monthly return of -12.09%. SOL declined from $83.90 to $82.44, for a monthly return of -1.74%. While SOL's monthly closing loss appeared modest, it reached an intramonth high of $98.40 before retracing to around $80.00, indicating that realized trading volatility was far greater than the headline monthly return suggests.
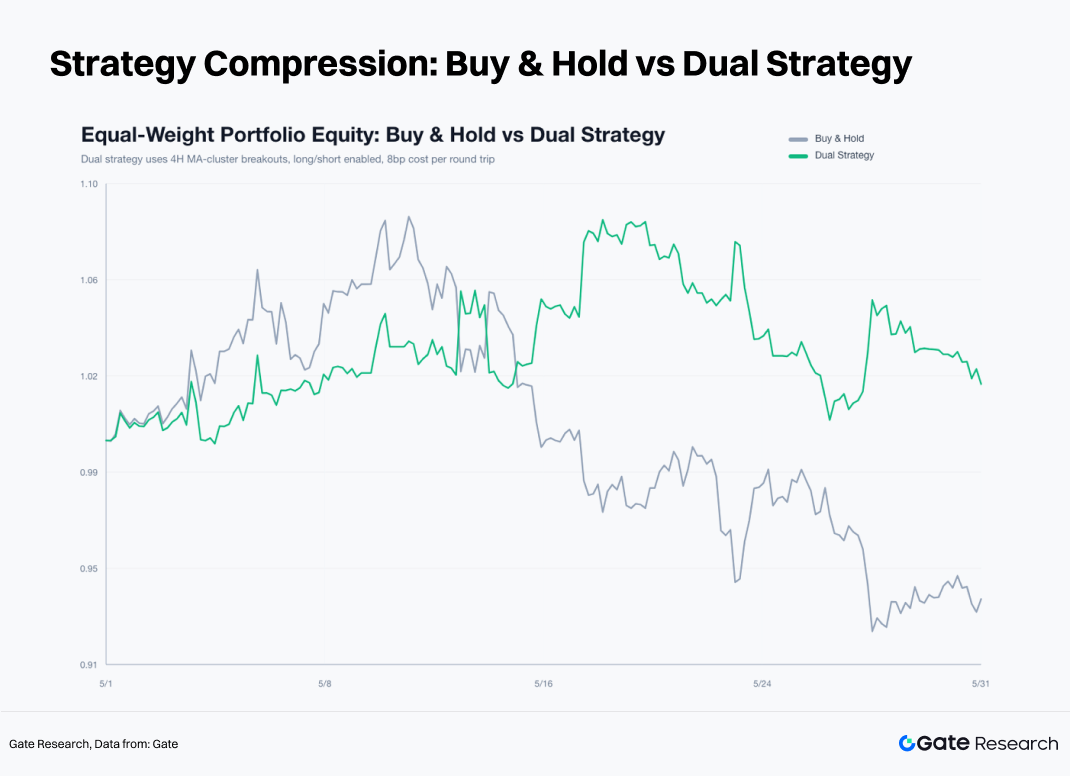
The strategy backtest results were equally clear. An equal weighted buy and hold portfolio across the three assets returned approximately -6.09%. The long only moving average cluster breakout strategy returned about -3.65%, while the long short version generated a gain of +2.11%. Relative to buy and hold, the long short strategy delivered approximately 8.2% of excess return. Most of the profits came from downside trend legs that emerged after mid May, with ETH and SOL contributing the largest share of gains.
The most effective trading framework in May followed a simple process: first identify moving average cluster compression, then allow the market to choose direction through either an upside or downside breakout. Failed signals were managed using the EMA12 exit rule, a fixed 2.5% stop loss limited downside risk on each trade, and a 3R take profit target preserved gains from sustained trends. This framework was well suited to May's market structure, which featured low win rates, high reward to risk ratios, and performance concentrated in a small number of trend legs.
The performance of U.S. equities reinforced this conclusion. AI related large cap stocks continued to benefit from strong earnings and favorable industry fundamentals. Nvidia reported robust quarterly results, with Q1 FY2027 revenue reaching approximately $81.6 billion, and once again approached the $5 trillion market capitalization milestone. Meanwhile, BTC's correlation with the S&P 500 remained elevated. Public data shows that the 30 day correlation reached roughly 0.74 at points during 2026 and remained around 0.6 near the end of May. Crypto assets did not decouple from the broader U.S. risk asset framework during the month. Persistent BTC ETF outflows, weakening demand for ETH ETFs, and a rising share of perpetual futures activity collectively caused crypto markets to underperform major U.S. technology stocks.
1. Market Structure: Early Rally, Mid Month Weakness, and Late Month Compression
The first phase unfolded between May 1 and May 6. BTC advanced from $77,117.4 to $82,828.2, ETH rose from $2,283.02 to $2,423.99, and SOL continued higher until reaching $98.40 on May 11. During this period, short term moving average clusters trended upward while volatility remained within a manageable range, reflecting a market recovery phase. SOL displayed the strongest upside elasticity, indicating that investors were willing to take on greater risk exposure early in the month.
The second phase began on May 7. BTC failed to establish a sustained foothold above $82,000, ETH could not maintain levels above $2,400, and SOL formed its monthly peak near $98. Breakout signals began to fail with increasing frequency, and repeated exits were triggered as prices retreated toward the EMA12. Long positions in BTC entered after May 14 were stopped out, ETH long signals consistently failed after May 6, and SOL entered a clearly defined downtrend after May 15.
The third phase extended from May 22 to the end of the month. BTC drifted toward the $73,000 area, ETH approached $2,000, and SOL retraced to around $82. Price fluctuations narrowed, moving average cluster widths contracted, and the market entered a new compression phase characterized by declining volatility and reduced directional conviction.
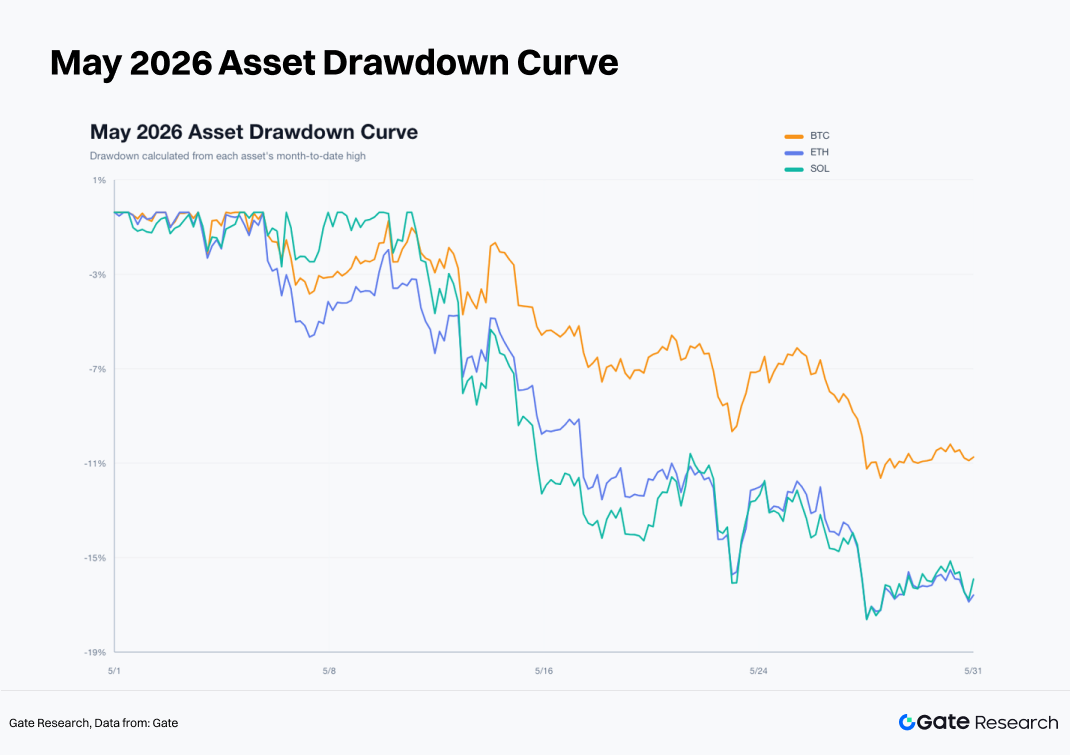
The magnitude of the monthly drawdowns further reinforced the distinct roles of each asset. BTC experienced a peak to trough decline of approximately 12.5% during the month, compared with 18.8% for ETH and 18.7% for SOL. BTC functioned as the market's risk anchor, while ETH and SOL acted as amplifiers of risk appetite. Once BTC began to weaken, ETH and SOL corrected more aggressively, suggesting that long exposure to higher beta assets should be reduced when market conditions deteriorate.
2. Capital Flows: Stablecoin Liquidity Remains Intact While ETF Demand Weakens
As of May 31, total stablecoin market capitalization stood at approximately $320 billion, while DeFi TVL was around $251 billion. Underlying dollar liquidity remained intact, with no signs of a systemic liquidity withdrawal. Centralized exchanges recorded roughly $124.2 billion in 24 hour spot trading volume and approximately $894.4 billion in perpetual futures volume. Perpetual trading activity was therefore about 7.2 times larger than spot volume, indicating that price discovery was increasingly being driven by derivatives markets.
ETF flows became a significant source of pressure during the second half of May. According to public reports, spot BTC ETFs recorded net outflows for nine consecutive trading days, totaling approximately $2.8 billion. At one point, daily net outflows reached roughly $649 million, including about $448 million from BlackRock's IBIT alone. ETH ETFs also faced persistent pressure, with approximately $241 million in net outflows during the final week of May.
However, capital was not exiting the crypto market entirely. Alternative asset ETFs tied to tokens such as SOL and XRP recorded modest inflows, while emerging narratives around products such as HYPE ETFs also attracted attention. Capital rotated away from mainstream BTC and ETH ETFs toward thematic ETFs and higher beta opportunities. This suggests that the primary issue was not a broad withdrawal of capital, but rather weakening demand for core spot exposure alongside increased participation in sector rotation and short term trading opportunities.
Derivatives market data reinforced this view. Aggressive buy/sell ratios for BTC, ETH, and SOL all remained below 1, indicating slightly stronger selling pressure than buying pressure. Funding rates hovered around 0.01%, far from levels associated with excessive positioning or overcrowding. The market exhibited a classic late cycle pattern: active leverage driven trading, insufficient spot participation, weak aggressive buying, and breakout attempts that frequently devolved into false signals.
3. Equity Linkage: AI Leaders Support the Nasdaq While Crypto ETFs Create Headwinds
Crypto market performance in May must also be viewed through the lens of broader U.S. equity risk appetite. BTC maintained a relatively high correlation with the S&P 500, with the 30 day correlation reaching approximately 0.74 at points during 2026 and remaining near 0.6 at the end of May. From a broader perspective, BTC continued to behave as a high beta risk asset rather than an independent safe haven.
The primary source of strength in U.S. equities came from AI related companies and mega cap technology stocks. Nvidia reported strong quarterly results in May, generating approximately $81.6 billion in Q1 FY2027 revenue. Its share price briefly reached new all time highs and once again approached the $5 trillion market capitalization milestone. Strong earnings from AI leaders helped sustain risk appetite within the Nasdaq. In contrast, crypto assets lacked a comparable earnings driven anchor and remained heavily influenced by ETF flows, derivatives positioning, and liquidity expectations.
This divergence across asset classes directly influenced strategy performance during May. While major technology stocks benefited from earnings driven demand, BTC and ETH ETFs experienced sustained outflows, reflecting a reallocation of capital within the broader risk asset universe. Traditional investors continued to favor AI leaders with clearer earnings visibility, reducing their willingness to allocate capital to BTC ETFs. Without strong spot demand, crypto breakout attempts frequently turned into short lived rallies followed by sharp reversals.
The macroeconomic calendar also constrained risk budgets throughout the month. Key releases included Non Farm Payrolls (NFP), CPI, PPI, the second estimate of GDP, and PCE inflation data. Employment, inflation, and growth figures directly influenced Treasury yields, the U.S. dollar, and Nasdaq valuations, which in turn affected ETF flows and perpetual funding conditions in crypto markets. By month end, market participants were already focusing on upcoming June catalysts, including employment reports, ISM surveys, JOLTS data, ADP employment figures, FOMC developments, and major options expirations. The low volatility compression observed in crypto markets around these events can reasonably be attributed to position reduction and declining risk budgets ahead of key macro catalysts.
4. Volatility: Short Term Compression Emerges While Price Strength Remains Weak
At the end of May, BTC's realized 4 hour volatility stood at approximately 0.46% on a 7 day basis and 0.64% on a 30 day basis. ETH recorded roughly 0.70% and 0.81%, while SOL registered approximately 0.76% and 1.00%, respectively. Across all three assets, short term volatility fell below medium term volatility, indicating that the market had entered a low volatility compression regime.
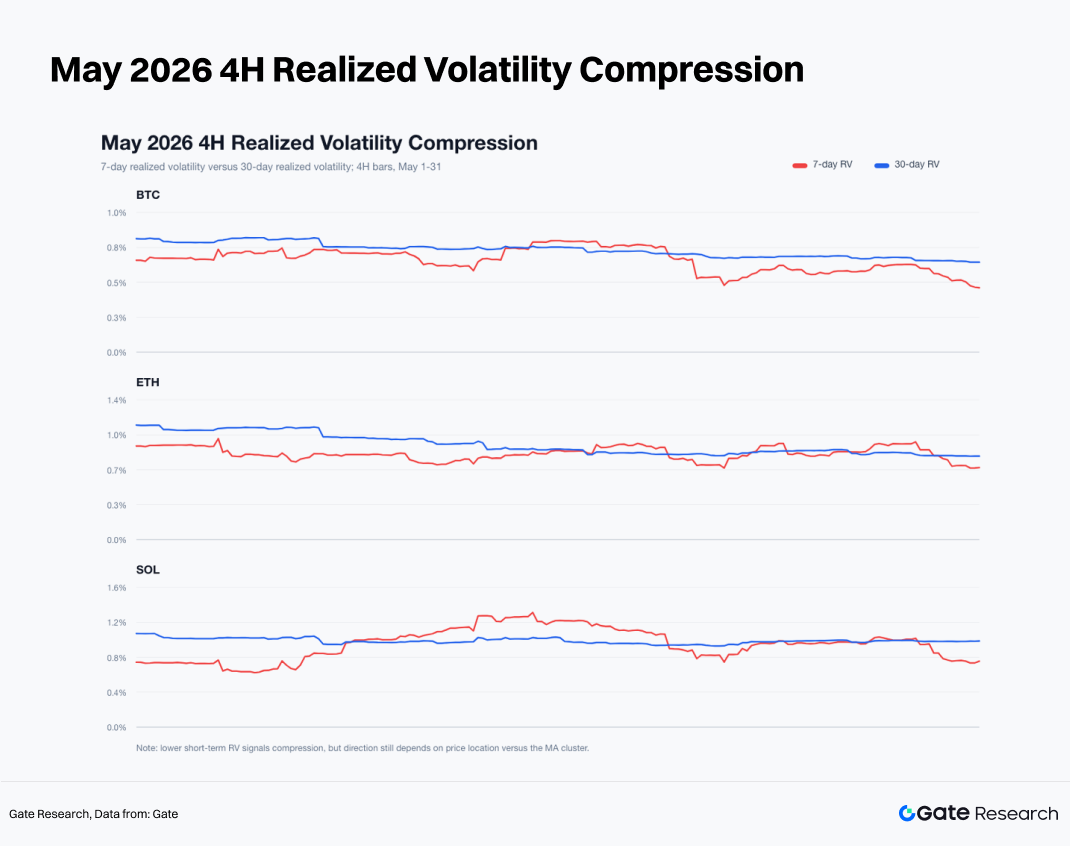
Low volatility compression signals that the market is approaching a directional decision point, but it does not imply that an upside breakout is imminent. At the end of May, BTC closed at $73,684.0, while its EMA12 stood near $73,776.35. ETH closed at $2,007.0 versus an EMA12 of approximately $2,016.34. SOL closed at $82.44, slightly above its EMA12 level of $82.39. BTC and ETH remained within weak trading ranges, while SOL had only just recovered back to its EMA12. Overall, price strength remained insufficient, suggesting that the low volatility environment was more consistent with post decline consolidation than with the early stages of a bullish breakout.
Moving average cluster width data painted a similar picture. At month end, the cluster width measured approximately 0.57% for BTC, 0.63% for ETH, and 0.58% for SOL, all well below the strategy's 2.2% compression threshold. Such conditions naturally generate frequent breakout signals. May's results demonstrated that once moving average clusters compress, traders must be prepared to participate in both upside and downside breakouts. Restricting trades to bullish breakouts alone would have systematically missed the most profitable downtrend opportunities during the month.
5. Strategy Backtest: The 4H Moving Average Cluster Compression Breakout System
The strategy is built around a moving average cluster composed of six moving averages: EMA6, EMA12, EMA24, SMA6, SMA12, and SMA24. Cluster width is calculated as the difference between the highest and lowest values among the six averages, divided by the current closing price.
A long position is opened at the next 4 hour candle open when the previous candle's cluster width is below 2.2% and the current candle closes above the upper boundary of the cluster. Conversely, a short position is opened at the next 4 hour candle open when the previous candle's cluster width is below 2.2% and the current candle closes below the lower boundary of the cluster.
Exit rules are fixed. Long positions are closed when price falls below the EMA12, while short positions are closed when price rises above the EMA12. Each trade carries a fixed stop loss of 2.5% and a take profit target of 3R, equivalent to 7.5%. If both the stop loss and take profit are triggered within the same candle, the stop loss takes precedence. A round trip transaction cost of 8 basis points is deducted from each trade. Any open positions remaining at month end are closed at the final 4 hour closing price.
This report evaluates two versions of the strategy. The long only version trades only upside breakouts, while the long short version trades both upside and downside breakouts. Results from May show that the long short version was significantly better aligned with prevailing market conditions.
5.1 Long Only Strategy: Breakout Quality Deteriorates
The long only strategy largely failed during May. BTC executed 11 trades, generating a return of -5.36%, with an 18.2% win rate and a maximum drawdown of -10.08%. ETH completed 10 trades, returning -6.49%, with a 10.0% win rate and a maximum drawdown of -10.64%. SOL executed 11 trades, returning +0.91%, with an 18.2% win rate and a maximum drawdown of -7.11%.
BTC's profits were concentrated in two trades at the beginning of the month. A position entered on May 1 and exited on May 4 generated a net gain of +2.09%, while a trade entered on May 4 and exited on May 7 returned +0.92%. Thereafter, signal quality deteriorated, culminating in a long position entered on May 14 that was stopped out for a net loss of -2.58%.
ETH delivered the weakest performance among the three assets. A trade entered on May 1 and exited on May 5 generated a gain of +3.17%, but all nine subsequent long trades ended in losses. Most upside breakouts in ETH represented weak rebounds rather than genuine trend expansion.
SOL was the only asset that remained marginally profitable under the long only framework, though gains were highly concentrated. A trade entered on May 5 and exited on May 8 returned +3.95%, while another entered on May 8 reached the 3R take profit target on May 10, generating a gain of +7.42%. Most remaining signals resulted in losses. As a result, SOL was the only asset to finish the month with a positive return under the long only approach.
The long short strategy delivered a substantial improvement in results. BTC returned -2.83%, ETH returned +3.14%, and SOL returned +6.05%. An equal weighted portfolio across the three assets generated a gain of +2.11%, compared with approximately -6.09% for an equal weighted buy and hold portfolio over the same period.
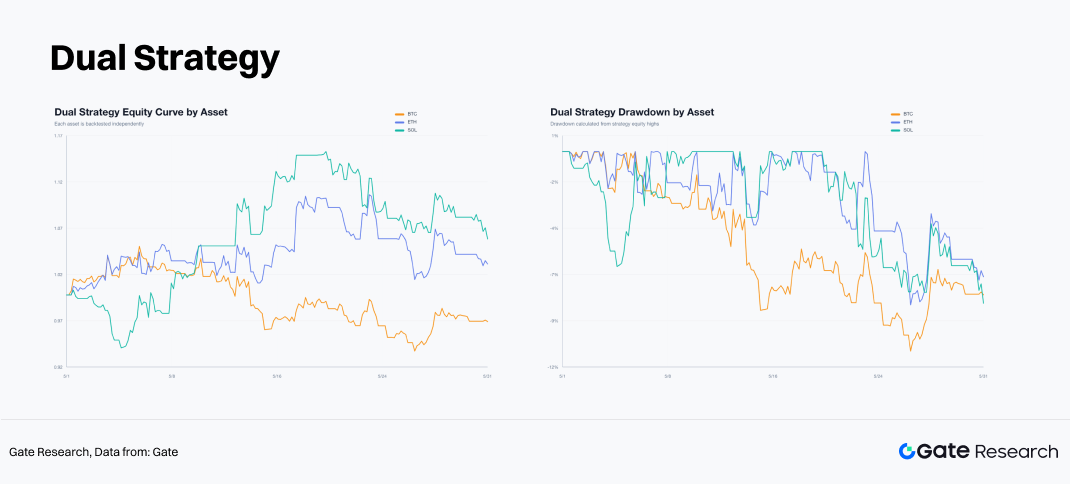
BTC remained unprofitable under the long short framework, although losses were significantly smaller than under the long only approach. The strategy executed 18 trades in BTC, with a win rate of 22.2% and a maximum drawdown of -10.74%. Two short positions contributed the majority of profits: a short entered on May 15 and closed on May 20 generated a net return of +2.35%, while another short entered on May 26 and exited on May 30 returned +3.42%. BTC produced a high number of false signals during mid May, and repeated shifts between long and short positions created performance drag.
ETH generated a return of +3.14% under the long short strategy, completing 18 trades with a 38.9% win rate and a maximum drawdown of -8.26%. The most important trade was a short position opened on May 15 that reached the 3R take profit target on May 17, generating a net gain of +8.03%. Another short entered on May 26 and closed on May 29 returned +2.68%. Long signals in ETH largely failed throughout the month, while short trend trades accounted for the majority of overall profits.
SOL delivered the strongest performance among the three assets, returning +6.05% across 22 trades. The strategy achieved a 22.7% win rate and a maximum drawdown of -8.17%. Unlike ETH, SOL provided profitable opportunities on both the long and short sides. A long position entered on May 8 reached the 3R take profit target at 16:00 on May 10, generating a net return of +7.42%. A short position opened on May 15 also reached the 3R target on May 17, producing a gain of +8.03%. SOL exhibited the strongest trend responsiveness during the month, but it also generated the highest level of trading noise.
5.3 Trade Distribution: A Low Win Rate Structure Driven by a Few Large Winners
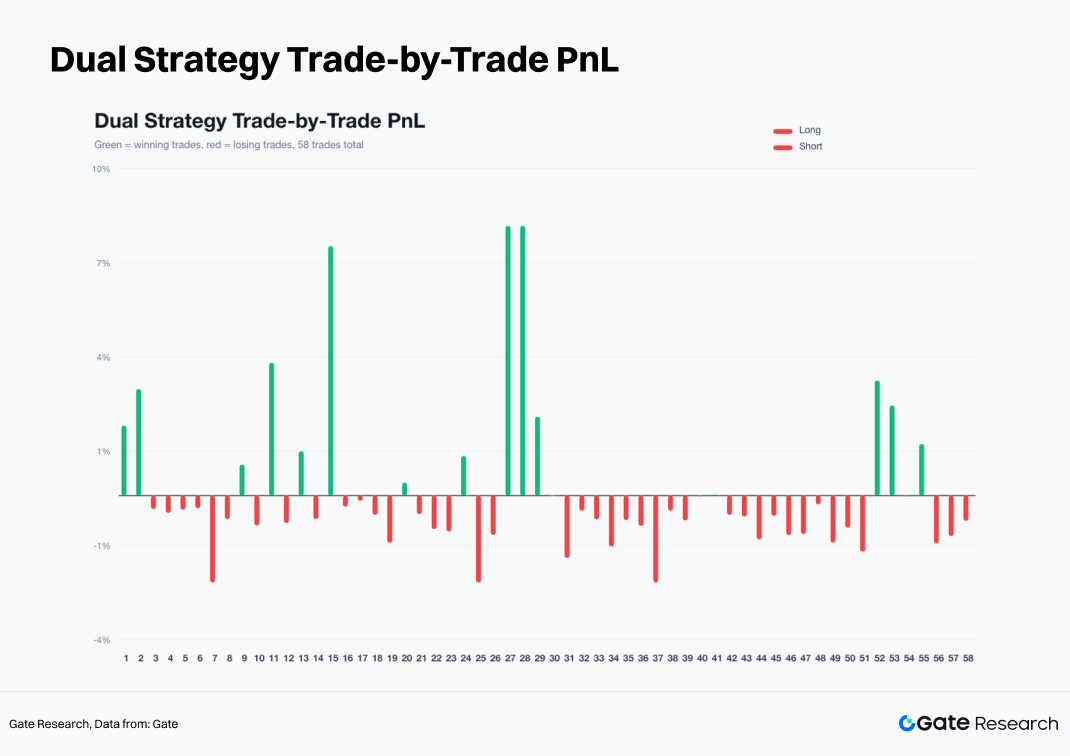
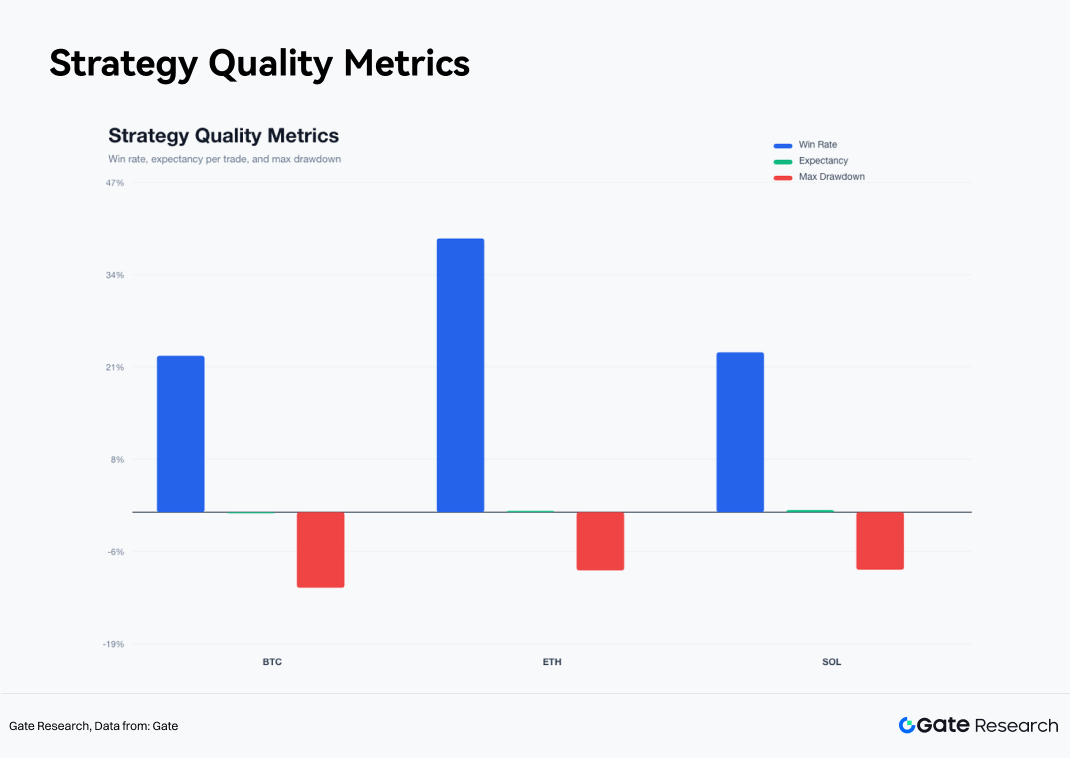
Across all 58 trades executed by the long short strategy, profitable trades were relatively rare. BTC achieved a win rate of 22.2%, ETH recorded 38.9%, and SOL posted 22.7%. The strategy's overall profitability was driven by a small number of large trend trades, while losses were contained through the EMA12 exit rule and the fixed 2.5% stop loss. This distribution highlights a classic trend following profile: a low win rate offset by a favorable reward to risk structure, where a handful of outsized winners account for the majority of returns.
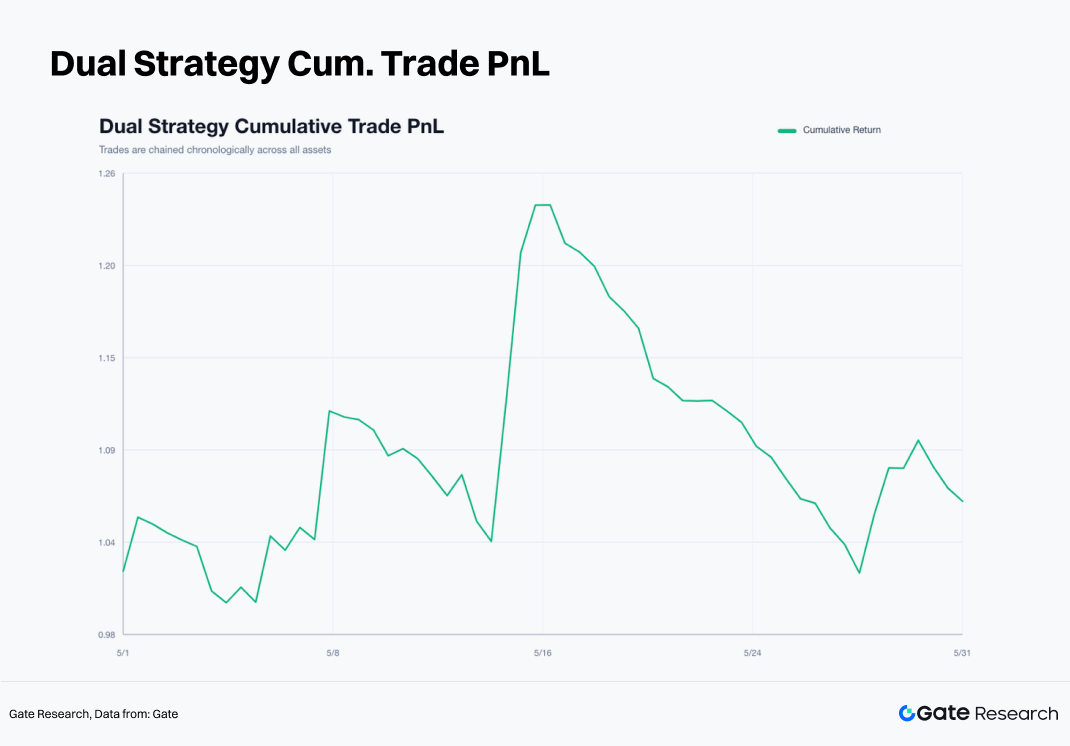
The cumulative return curve on a trade by trade basis shows that strategy performance advanced gradually during early May, accelerated in mid May as short positions in ETH and SOL generated substantial gains, and continued to improve in late May with additional contributions from BTC and SOL shorts. Most losses occurred during periods of repeated reversals, when the market frequently switched between bullish and bearish signals.
The system exhibits the characteristics of a classic trend following strategy: a low win rate combined with a high reward to risk ratio. It performs best in environments with clear directional trend legs and is less effective during periods of persistent choppy or range bound price action.
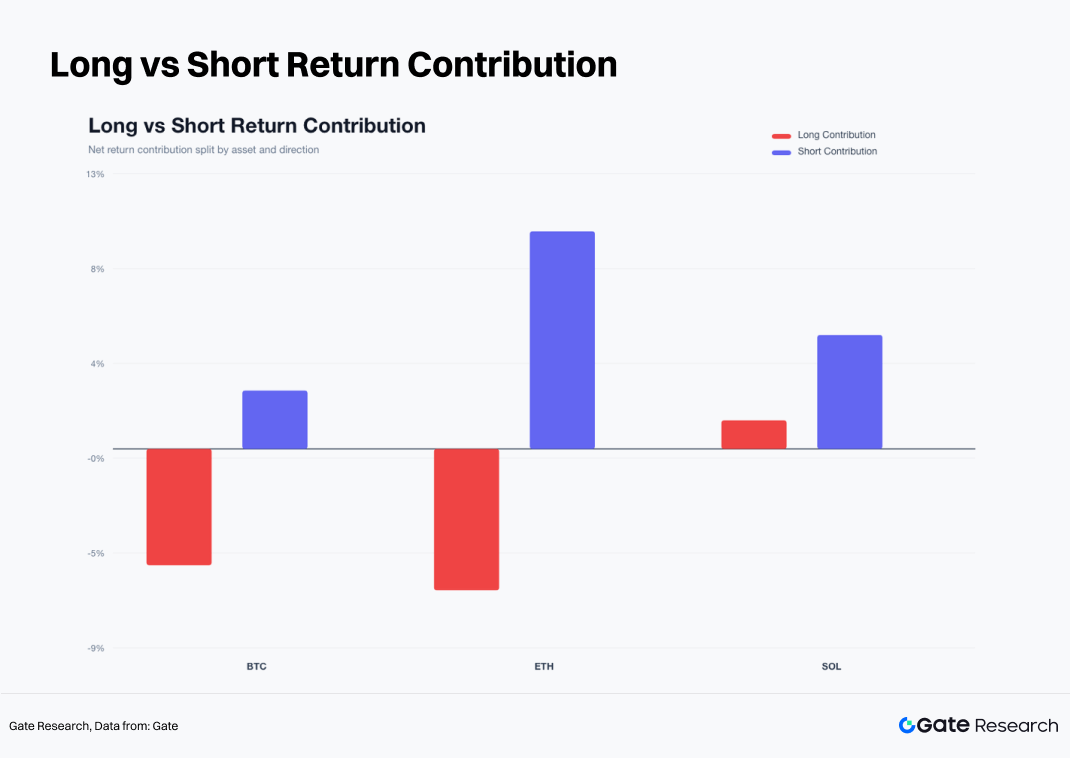
A breakdown of long and short contributions provides a clearer view of the sources of returns during the month. For BTC, long trades made a negative contribution, while short trades contributed positively. ETH also saw negative contributions from long positions, while short positions generated significantly positive returns. SOL was the only asset with positive contributions from both long and short trades, although the contribution from shorts was more consistent. The dominant theme of May was the downtrend that followed the failure of the early month rally.
Win rate, expected return per trade, and maximum drawdown metrics all point to the same conclusion: SOL delivered the highest expected value per trade, followed by ETH, while BTC ranked the weakest. BTC exhibited the highest frequency of false breakouts, ETH showed cleaner directional trends, and SOL offered the strongest price elasticity and trend potential.
5.4 Exit Mechanism: EMA12 Filters Noise, 3R Preserves Trend Profits
Analysis of exit reasons shows that EMA12 based exits accounted for the largest share of all trade closures. A significant number of trades were not terminated by the stop loss; instead, they were exited as prices retreated back toward the EMA12 following failed breakouts. The EMA12 rule effectively reduced holding time for invalid signals and prevented losses from expanding after breakout attempts lost momentum.
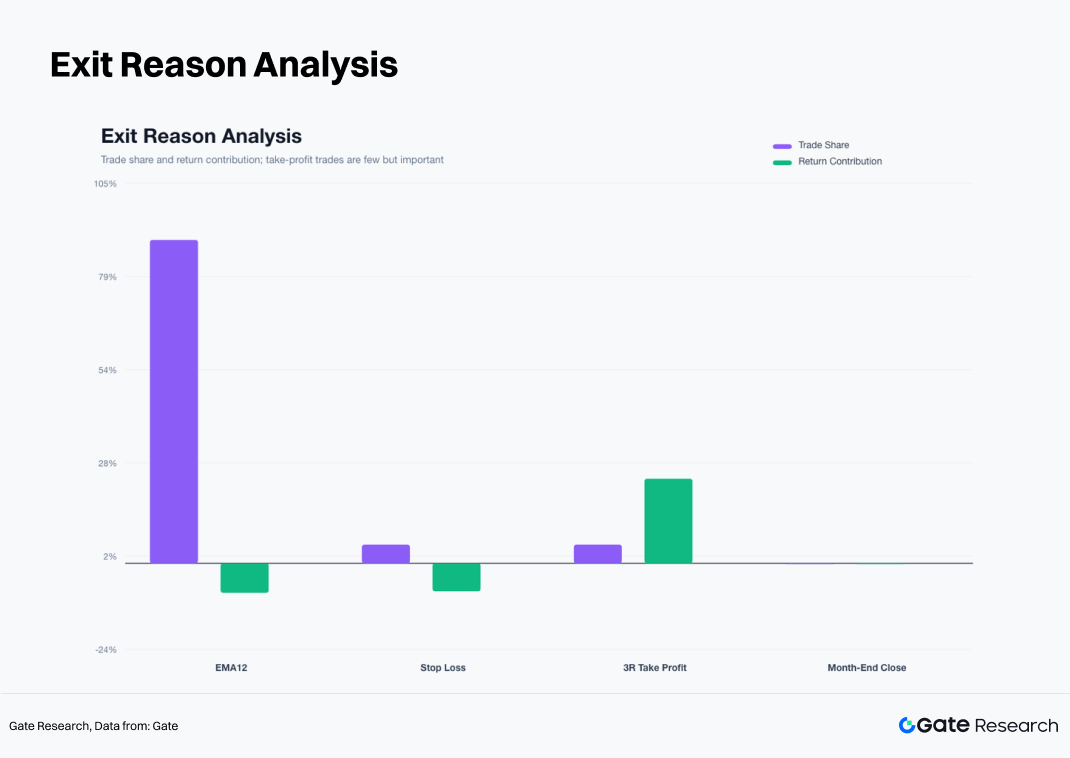
The number of stop loss exits was relatively limited, although losses were concentrated when they occurred. In contrast, trades that reached the 3R take profit target were rare, yet they contributed a disproportionately large share of total profits. This pattern is consistent with the characteristics of trend following strategies: most trades result in small gains or small losses, while a handful of trend trades generate the majority of returns. Had the 3R take profit rule been removed in May, many of the largest gains in ETH and SOL would have been cut short. Conversely, removing the EMA12 exit rule would have led to larger losses during choppy market conditions.
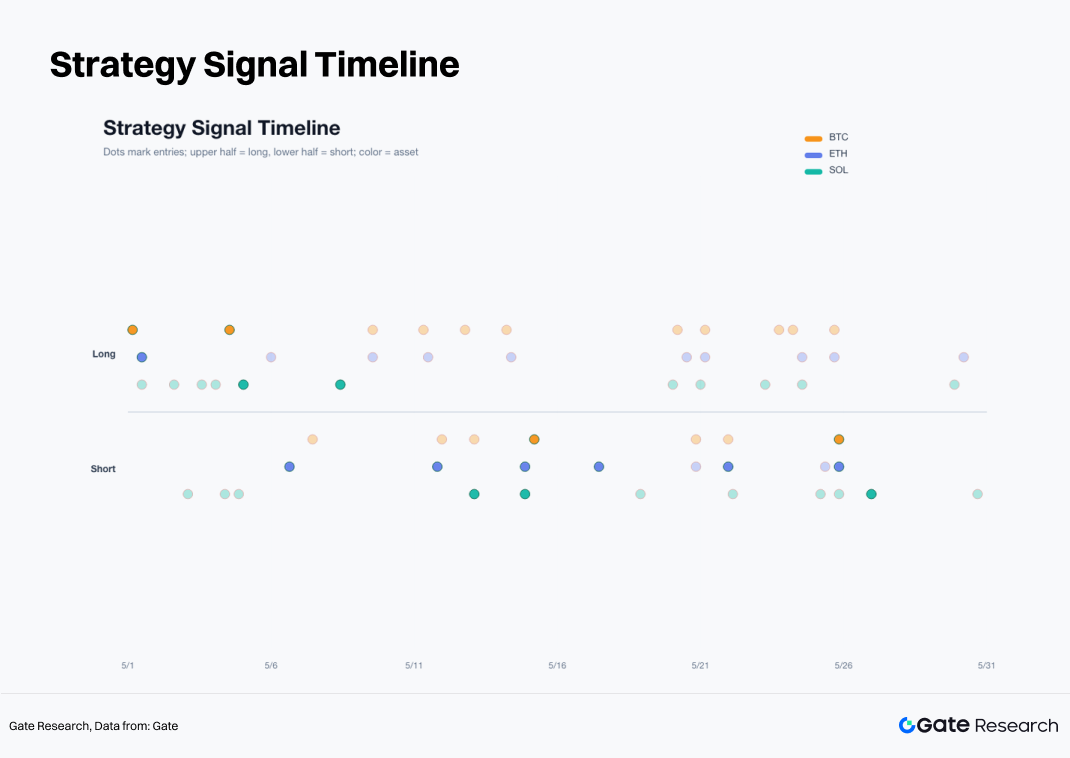
The signal timeline also reflects the evolution of market conditions throughout the month. Long signals were concentrated in early May, short signals began to increase during mid May, and both long and short signals appeared intermittently in late May. A high frequency of signals does not necessarily imply a high frequency of opportunities. The most effective trades were concentrated within relatively short periods when market direction was clear and trends were well defined.
The report also tested an enhanced filtering version of the strategy. The conditions included: 7-day volatility no higher than 1.15 times 30-day volatility, trading volume no lower than 0.9 times the average volume of the previous 20 bars (1 bar = 4 hours), long entries occurring near the 20-bar high, and short entries occurring near the 20-bar low. This version performed worse. The enhanced long-short strategy returned -3.40% for BTC, -5.03% for ETH, and -2.58% for SOL, with the equal-weighted three-asset portfolio returning -3.63%.
The reason for the underperformance is that high-volume breakouts in May often occurred near local tops. An enhanced long signal in BTC entered at $80,322.9 on May 4 and triggered a stop loss within four hours, resulting in a net loss of -2.58%. An enhanced long signal in ETH entered at $2,410.39 on May 6 and triggered a stop loss within the same bar, also resulting in a net loss of -2.58%. The enhanced long signal in SOL on May 4 similarly triggered a stop loss.
Higher trading volume reflects participation, but not capital quality. In May, volume expansions were driven more by rotation near local tops, leveraged liquidations, and short-term chasing activity. Effective filters should incorporate ETF flows, spot trading share, aggressive buy/sell ratios, perpetual futures trading share, and U.S. equity risk sentiment. Price and volume can identify volatility, but they cannot identify trend sponsorship.
5.6 Asset-Level Conclusions
BTC is the market regime anchor. BTC posted a smaller monthly decline than ETH and experienced a more manageable drawdown. The BTC long-short strategy returned -2.83%, indicating that BTC itself was not the best-performing asset in May. It is more useful as a gauge of market risk budgets. If BTC fails to reclaim the EMA12 and 30-period moving average zone, long exposure to ETH and SOL should be reduced.
ETH is the primary weak-trend asset. ETH declined 12.09% during the month, and long breakout signals had an extremely low win rate. The long-short strategy relied on short-side profits. After failing near $2,400, ETH successively broke below $2,300, $2,200, and $2,100. A recovery of the $2,100–$2,200 range is required before long exposure can be reassessed.
SOL is a trading asset. SOL's monthly closing decline was only -1.74%, but its intramonth price path was highly volatile. The SOL long-short strategy returned +6.05%, significantly outperforming BTC and ETH. SOL is well suited for trend-following strategies but not for passive holding. A low win rate, high elasticity, and returns concentrated in a small number of trend trades were SOL's defining characteristics in May.
5.7 Strategy Framework for June
The long-short 4H moving-average cluster breakout system will remain the core framework for June. Pure long positioning should be assigned a lower weight. BTC serves as the market regime filter, while ETH and SOL act as return-generating assets after relative strength confirmation.
If BTC reclaims the EMA12 and 30-period moving average zone, ETF outflows slow, and the aggressive buy/sell ratio rises back above 1, the weighting of long signals can be increased. If BTC remains below the $74,000–$76,000 range, the market should still be viewed as being in a weak recovery phase.
The U.S. equity filter should remain in place. If the Nasdaq and AI leaders remain strong while BTC ETF outflows slow, it would signal an improvement in cross-asset risk budgets. If the Nasdaq remains strong but BTC ETF outflows continue, capital is still favoring U.S. technology leaders with stronger earnings visibility, and crypto upside breakouts should be treated cautiously. If both U.S. equities and crypto weaken simultaneously, short signals in ETH and SOL should receive higher priority.
Position sizing rules remain fully systematic. Per-trade risk stays at 2.5%, take-profit remains at 3R, and the EMA12 exit rule remains unchanged. Breakout signals alone should not trigger oversized positions. When spot demand is weak, ETF outflows persist, perpetual trading share remains elevated, and aggressive buying is insufficient, upside breakout signals should be de-emphasized while downside breakout signals should be given greater weight.
6. Conclusion
The crypto market completed a transition from recovery to deterioration during May. BTC, ETH, and SOL all rallied early in the month, trend quality weakened after mid-month, and the market entered a low-volatility compression phase by month-end. Stablecoin and DeFi liquidity remained intact, but demand for mainstream ETFs weakened, derivatives activity gained influence, and price discovery became increasingly driven by leveraged markets.
The strategy results provide a clear answer. Buy-and-hold delivered the weakest performance, while the long-only breakout strategy failed to adapt to the deterioration in trend quality after mid-May. The long-short moving-average cluster breakout strategy delivered the best results. The equal-weighted three-asset buy-and-hold portfolio returned approximately -6.09%, compared with -3.65% for the long-only strategy and +2.11% for the long-short strategy. Returns came primarily from the short-side trend legs in ETH and SOL, as well as SOL's long-side trend leg in early May.
U.S. equities provide a more complete explanation for these outcomes. AI technology leaders continued to benefit from earnings-driven support, with Nvidia and other large-cap names sustaining risk appetite in equities. Meanwhile, BTC and ETH ETFs experienced persistent outflows, weakening demand for mainstream crypto assets. BTC maintained a relatively high correlation with the S&P 500, indicating that the crypto market remained influenced by U.S. risk budgets and macro interest-rate expectations.
The focus for June is not to predict direction in advance. A more effective approach is to identify market regimes, execute both long and short signals, control per-trade risk, and preserve trend profits. Following moving-average cluster compression, both upside and downside breakouts can produce valid trading opportunities. The EMA12 exit mechanism protects the strategy from prolonged exposure to false breakouts, while the 3R take-profit rule allows a small number of large winners to offset numerous small losses. Under current market conditions, a disciplined long-short system remains superior to discretionary momentum chasing.
Source:
Gate Research is a comprehensive blockchain and cryptocurrency research platform that provides deep content for readers, including technical analysis, market insights, industry research, trend forecasting, and macroeconomic policy analysis.
Disclaimer
Investing in cryptocurrency markets involves high risk. Users are advised to conduct their own research and fully understand the nature of the assets and products before making any investment decisions. Gate is not responsible for any losses or damages arising from such decisions.