2026 GOZ Price Prediction: Expert Analysis and Market Forecast for the Next Bull Run

Introduction: GOZ's Market Position and Investment Value
Göztepe S.K. Fan Token (GOZ), as a blockchain-based fan engagement and reward token, has been facilitating interaction between the Turkish football club Göztepe and its supporters since its launch in 2021. As of 2026, GOZ maintains a market capitalization of approximately $610,026, with a circulating supply of around 4.164 million tokens, and the price is currently hovering around $0.1465. This asset, designed as a "fan participation and voting rights token," is playing an increasingly significant role in sports fan engagement and decentralized governance within football communities.
This article will comprehensively analyze GOZ's price trends from 2026 to 2031, combining historical patterns, market supply and demand dynamics, ecosystem development, and macroeconomic conditions to provide investors with professional price forecasts and practical investment strategies.
I. GOZ Price History Review and Current Market Status
GOZ Historical Price Evolution Trajectory
- 2021: GOZ was launched on the Socios.com platform in May 2021 at a publish price of $2.1783, establishing its initial market presence in the fan token sector
- 2022: On March 22, 2022, GOZ reached its all-time high of $5.93, driven by increased fan engagement and broader adoption of fan tokens
- 2025: The token experienced significant volatility, hitting its all-time low of $0.118724 on December 19, 2025
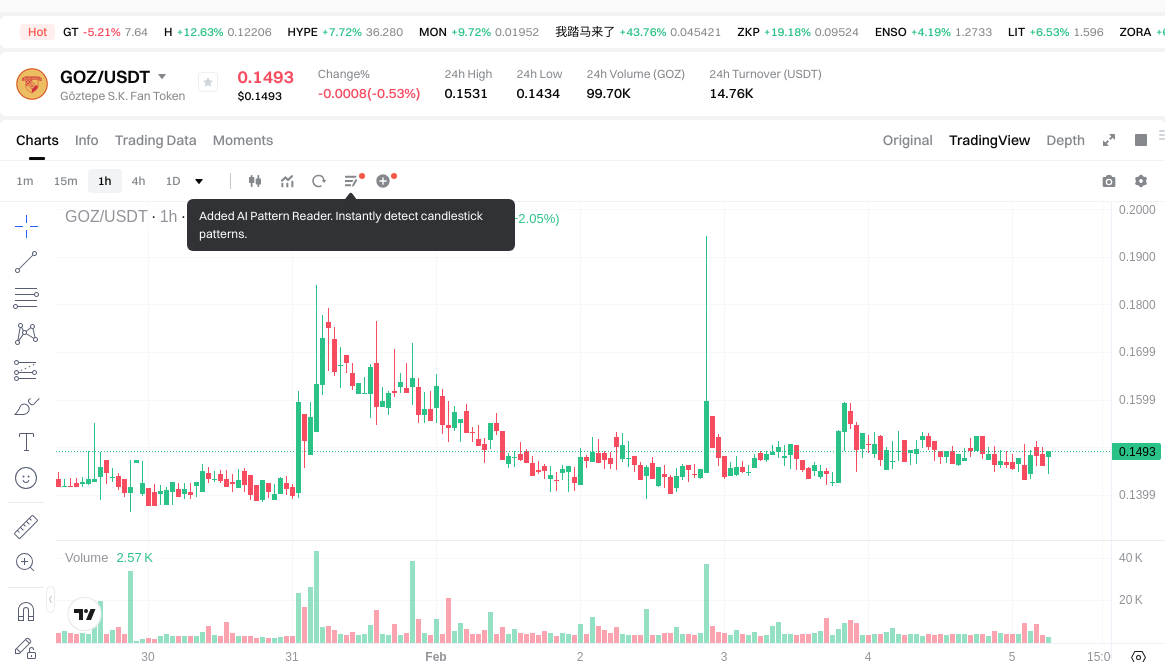
GOZ Current Market Status
As of February 5, 2026, GOZ is trading at $0.1465, reflecting a marginal increase of 0.54% over the past 24 hours. The token has shown mixed short-term performance, with a decline of 0.069% in the past hour and a 0.74% decrease over the past week. However, the 30-day performance indicates positive momentum with an 11.74% gain. The annual performance shows a substantial decline of 53.80%, indicating considerable price pressure over the longer term.
GOZ currently holds a market ranking of 2880 with a circulating supply of 4,164,000 tokens, representing approximately 59.49% of its maximum supply of 7,000,000 tokens. The market capitalization stands at $610,026, with a fully diluted valuation of $1,025,500. The 24-hour trading volume registers at $14,788.43, suggesting moderate trading activity. The token's market share is 0.000039%, and its price is currently significantly below its all-time high, trading at approximately 97.53% lower than the peak recorded in March 2022.
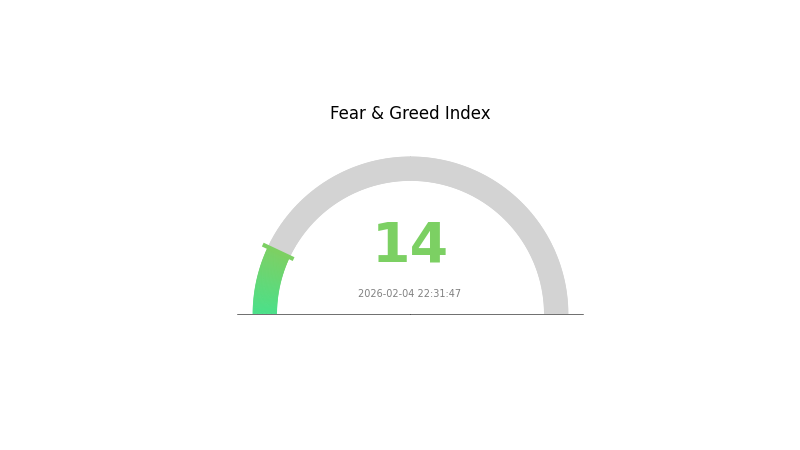
The current market sentiment index stands at 14, indicating "Extreme Fear" conditions in the broader cryptocurrency market, which may be influencing GOZ's price performance alongside sector-specific factors affecting fan tokens.
Click to view current GOZ market price
GOZ Market Sentiment Index
2026-02-04 Fear and Greed Index: 14 (Extreme Fear)
Click to view the current Fear & Greed Index
The crypto market is experiencing extreme fear, with the Fear and Greed Index dropping to 14. This historically low reading suggests severe market pessimism and panic selling pressure. When the index reaches such extreme levels, it often presents contrarian opportunities for long-term investors. However, traders should remain cautious and conduct thorough risk management. Market sentiment this extreme typically indicates potential capitulation, which could precede recovery phases. Monitor key support levels and maintain disciplined position sizing during this volatile period.
GOZ Holding Distribution
The holding distribution chart reflects the concentration of GOZ tokens across different addresses on the blockchain. Based on current on-chain data, the top 10 addresses collectively hold a significant portion of the total token supply, indicating a relatively concentrated ownership structure. The largest holder possesses a substantial percentage, while the distribution gradually decreases across subsequent addresses, forming a typical pyramid-shaped concentration pattern.
This concentration level suggests that GOZ exhibits moderate to high centralization in its current market structure. The substantial holdings by top addresses could potentially amplify price volatility, as large-scale movements by these addresses may trigger significant market reactions. From a market manipulation perspective, the concentration of tokens in fewer hands increases the theoretical risk of coordinated price control, though actual manipulation would depend on multiple factors including trading behavior patterns and holder relationships.
The current address distribution pattern reflects certain characteristics regarding GOZ's decentralization degree and on-chain structural stability. While concentrated holdings are common in early-stage tokens or projects with specific tokenomics designs, investors should monitor whether this distribution evolves toward greater dispersion over time, which would indicate healthier market development and reduced systematic risks associated with centralized control.
Click to view current GOZ Holding Distribution

| Top | Address | Holding Qty | Holding (%) |
|---|
II. Core Factors Influencing GOZ's Future Price
Supply Mechanism
-
Oil Price Correlation: GOZ prices are significantly influenced by global oil price fluctuations. As energy markets represent a substantial portion of commodity trading, movements in crude oil benchmarks like Brent and WTI directly impact GOZ valuations through supply-demand dynamics and production cost considerations.
-
Historical Pattern: Historical data shows that when international oil prices experience sustained declines—as seen in recent periods with Brent crude falling 13.53% year-over-year and WTI dropping 14.74%—related commodity prices including GOZ tend to follow downward trajectories. Energy price declines of 3.3% have contributed to approximately 0.25 percentage point reductions in broader price indices.
-
Current Impact: The current supply outlook suggests continued pressure from geopolitical factors. While Russia-Ukraine peace negotiations have reduced risk premiums, ongoing sanctions on Russian oil companies and potential supply disruptions create uncertainty. US inventory increases and expectations of significant oversupply (with projections of 2 million barrels per day surplus by 2026) may continue exerting downward pressure on energy-related commodities.
Institutional and Major Holder Dynamics
-
Institutional Positioning: Central banks globally have adjusted their monetary policies in response to inflation concerns. The US Federal Reserve's policy stance remains cautious, with December 2024 core CPI moderating to 0.2% month-over-month, providing some room for potential rate adjustments. However, institutional investors maintain defensive positions given macroeconomic uncertainties.
-
Corporate Adoption: Major commodity trading firms and energy companies have adjusted their hedging strategies in response to volatile oil markets. Investment banks including Goldman Sachs and JPMorgan have issued conservative long-term forecasts, with Goldman predicting Brent crude averaging USD 56 per barrel and JPMorgan warning of potential declines to USD 30 levels by 2027.
-
National Policies: Governments in major economies are implementing divergent approaches. Brazil's central bank has raised benchmark rates to 15% to combat inflation above target ranges (4.7% vs. 4.5% ceiling), while China continues structural adjustments with intermediate goods exports rising to 46% of total exports. US trade policies under potential tariff implementations add additional uncertainty to commodity flows.
Macroeconomic Environment
-
Monetary Policy Impact: Federal Reserve policy expectations have evolved, with markets pricing in approximately 81% probability of rate cuts in certain periods. However, the Fed's December 2024 meeting indicated a slower pace of rate reductions. Core inflation (supercore) moderated to 0.2% monthly, suggesting potential room for monetary easing if economic conditions warrant. Brazilian monetary tightening and divergent global central bank policies create cross-currents affecting commodity valuations.
-
Inflation Hedge Attributes: In the current environment, traditional inflation hedges show mixed performance. While energy prices have declined 3.3%, creating disinflationary pressures, supply chain dynamics and geopolitical risks maintain underlying volatility. The relationship between commodity prices and inflation expectations remains complex, with structural factors including production capacity and global trade patterns playing significant roles.
-
Geopolitical Factors: International tensions significantly impact commodity markets. Russia-Ukraine conflict developments, with alternating signals of peace negotiations and ongoing sanctions, create price volatility. US sanctions on Russian oil companies (Rosneft, Lukoil) have resulted in approximately 48 million barrels of Russian crude facing potential shipping disruptions. Middle Eastern supply routes, including incidents at Russia's Novorossiysk port, add additional risk premiums. China-US trade dynamics, particularly regarding intermediate goods and agricultural commodities like soybeans, influence broader commodity market sentiment.
Technical Development and Ecosystem Construction
-
Supply Chain Restructuring: Global supply chains are undergoing significant transformation, with emerging markets playing increasingly important roles. China's intermediate goods exports to countries like Vietnam (12% annual growth) and Mexico (16% annual growth) reflect shifting production patterns. This restructuring affects commodity demand patterns and pricing dynamics across various sectors.
-
Energy Transition Policies: While not directly applicable to GOZ if it represents a traditional commodity, broader energy sector developments influence related markets. Policies supporting renewable energy, electric vehicle adoption, and infrastructure modernization create both challenges and opportunities for traditional energy commodities. Government subsidies for equipment upgrades and consumer incentive programs (such as appliance trade-in initiatives generating over CNY 1.3 trillion in sales) demonstrate fiscal policy tools being deployed.
-
Ecosystem Applications: The commodity trading ecosystem increasingly incorporates financial derivatives, hedging instruments, and digital trading platforms. Exchange-traded products, futures contracts, and options markets provide price discovery mechanisms and risk management tools. Major commodity exchanges have expanded product offerings, with enhanced transparency and regulatory frameworks supporting market efficiency. Cross-border trading mechanisms, including local currency settlement arrangements (such as Brazil-China initiatives), aim to reduce dollar dependency and transaction costs in commodity trade.
III. 2026-2031 GOZ Price Prediction
2026 Outlook
- Conservative prediction: $0.12093 - $0.1493
- Neutral prediction: Around $0.1493
- Optimistic prediction: Up to $0.15826 (requires favorable market conditions and broader crypto market recovery)
2027-2029 Outlook
- Market stage expectation: GOZ may enter a gradual growth phase, with price volatility potentially increasing as the project develops and market sentiment shifts
- Price range predictions:
- 2027: $0.08458 - $0.20299
- 2028: $0.09989 - $0.2533
- 2029: $0.16404 - $0.27412
- Key catalysts: Project development milestones, partnership announcements, technological upgrades, and overall cryptocurrency market trends could serve as primary drivers for price movement
2030-2031 Long-term Outlook
- Baseline scenario: $0.18619 - $0.29643 (assuming steady project development and moderate market growth)
- Optimistic scenario: $0.23281 - $0.31673 (contingent on successful ecosystem expansion and increased adoption)
- Transformative scenario: Potential to exceed $0.31673 (requires breakthrough technological implementations, significant institutional adoption, or major market paradigm shifts)
- 2026-02-05: GOZ trading within early-stage development phase, with projected average price around $0.1493 for the year
| Year | Predicted High Price | Predicted Average Price | Predicted Low Price | Price Change |
|---|---|---|---|---|
| 2026 | 0.15826 | 0.1493 | 0.12093 | 1 |
| 2027 | 0.20299 | 0.15378 | 0.08458 | 4 |
| 2028 | 0.2533 | 0.17838 | 0.09989 | 21 |
| 2029 | 0.27412 | 0.21584 | 0.16404 | 47 |
| 2030 | 0.29643 | 0.24498 | 0.18619 | 67 |
| 2031 | 0.31673 | 0.27071 | 0.23281 | 84 |
IV. GOZ Professional Investment Strategy and Risk Management
GOZ Investment Methodology
(I) Long-Term Holding Strategy
- Target Investors: Fans of Göztepe S.K. and sports token enthusiasts with medium to long-term investment horizons
- Operational Recommendations:
- Consider accumulating positions during market corrections when price volatility increases
- Monitor club performance and fan engagement metrics on Socios.com platform as potential value indicators
- Storage Solution: Utilize Gate Web3 Wallet for secure token custody with built-in staking features
(II) Active Trading Strategy
- Technical Analysis Tools:
- Volume Analysis: Track 24-hour trading volume patterns; current volume of $14,788 suggests moderate liquidity conditions
- Support and Resistance Levels: Monitor key price levels including recent low of $0.1434 and high of $0.1531
- Swing Trading Considerations:
- Recent 30-day performance shows 11.74% increase, suggesting potential momentum patterns
- Set strict stop-loss orders given the token's historical volatility range from $0.118724 to $5.93
GOZ Risk Management Framework
(I) Asset Allocation Principles
- Conservative Investors: 1-2% of crypto portfolio
- Moderate Investors: 3-5% of crypto portfolio
- Aggressive Investors: 5-8% of crypto portfolio
(II) Risk Hedging Approaches
- Portfolio Diversification: Combine with major cryptocurrencies and other sports fan tokens to spread sector-specific risks
- Position Sizing: Implement gradual entry strategies rather than full position deployment
(III) Secure Storage Solutions
- Hot Wallet Option: Gate Web3 Wallet for active trading and staking participation
- Cold Storage Alternative: Consider hardware wallet solutions for long-term holdings exceeding trading needs
- Security Precautions: Enable two-factor authentication, regularly update recovery phrases, and verify contract address (0x0E469D1C78421C7952E4D9626800DAd22F45361D on Chiliz Chain)
V. GOZ Potential Risks and Challenges
GOZ Market Risks
- Limited Liquidity: With only 2 exchanges listing GOZ and relatively low 24-hour trading volume, price slippage may occur during large transactions
- High Volatility: The token has experienced significant price fluctuations, with 1-year performance showing -53.80% decline
- Circulating Supply Dynamics: Current circulation represents 59.49% of total supply, with potential dilution risk from remaining tokens
GOZ Regulatory Risks
- Sports Token Classification: Evolving regulatory frameworks for fan tokens may impact trading availability and compliance requirements
- Platform Dependency: Token utility is closely tied to Socios.com platform operations and regulatory standing
- Geographic Restrictions: Certain jurisdictions may impose limitations on fan token trading or utility features
GOZ Technical Risks
- Smart Contract Vulnerabilities: While deployed on Chiliz Chain, potential technical issues could affect token functionality
- Platform Integration Dependencies: Token value is intrinsically linked to Socios.com platform technical stability and feature development
- Blockchain Congestion: Network performance on Chiliz Chain could impact transaction speeds during high-activity periods
VI. Conclusion and Action Recommendations
GOZ Investment Value Assessment
GOZ represents a niche investment opportunity within the sports fan token sector, offering utility-driven value through fan engagement mechanisms on the Socios.com platform. The token's long-term value proposition is tied to Göztepe S.K.'s performance and fan base growth. However, investors should note the significant price decline over the past year and relatively limited market liquidity. The 30-day positive momentum may indicate renewed interest, but historical volatility suggests caution is warranted.
GOZ Investment Recommendations
✅ Beginners: Start with small position sizes (1-2% of crypto allocation) and focus on understanding fan token mechanics before increasing exposure ✅ Experienced Investors: Consider swing trading opportunities around club events and platform announcements while maintaining core positions ✅ Institutional Investors: Evaluate as part of broader sports token sector exposure with careful attention to liquidity constraints
GOZ Trading Participation Methods
- Spot Trading: Access GOZ markets on Gate.com with various trading pairs for direct price exposure
- DCA Strategy: Implement dollar-cost averaging to mitigate entry point risks and build positions gradually
- Event-Based Trading: Monitor Göztepe S.K. match schedules and club announcements for potential volatility opportunities
Cryptocurrency investment carries extremely high risks. This article does not constitute investment advice. Investors should make prudent decisions based on their risk tolerance and consult professional financial advisors. Never invest more than you can afford to lose.
FAQ
What is GOZ token and what is its purpose?
GOZ is a token built on the CHZ blockchain with a total supply of 7 million. It is primarily used for physical merchandise sales, fan voting on player selections, and ticket discounts for sports events.
What are the main factors influencing GOZ price prediction?
GOZ price is primarily influenced by market supply and demand, trading volume, global economic conditions, geopolitical events, and investor sentiment. Blockchain adoption trends and regulatory developments also significantly impact price movements.
How to analyze GOZ's historical price trends and patterns?
Analyze GOZ's historical price movements through candlestick charts to identify support and resistance levels. Study trading volume patterns and price cycles to recognize recurring market behaviors. Use technical indicators to forecast future trend directions based on historical data patterns.
What are the risks to pay attention to when investing in GOZ tokens?
GOZ token investment carries high volatility and market uncertainty risks. Price fluctuations are significant, and the future direction is unpredictable. Investors should carefully monitor market dynamics and timing before making investment decisions.
What are the advantages and disadvantages of GOZ compared to other similar tokens?
GOZ offers real gold backing and audit transparency, providing inherent value and stability. However, it faces challenges including price volatility, lower liquidity compared to major cryptocurrencies, and potential adoption barriers in the broader crypto market.
What are professional analysts' price predictions for GOZ in the future?
Professional analysts predict GOZ could experience significant growth driven by market adoption and blockchain innovation. Based on current trends, analysts forecast potential upside targets in the medium to long term, though exact figures vary by analyst. Market fundamentals and ecosystem development will be key price drivers.
Share
Content
Introduction: GOZ's Market Position and Investment Value
I. GOZ Price History Review and Current Market Status
II. Core Factors Influencing GOZ's Future Price
III. 2026-2031 GOZ Price Prediction
IV. GOZ Professional Investment Strategy and Risk Management
V. GOZ Potential Risks and Challenges
VI. Conclusion and Action Recommendations
FAQ
How to Buy Cryptocurrency


Trending Cryptocurrencies


2025 SUI coin: price, buying guide, and Staking rewards

How to Buy Crypto: A Step-by-Step Guide with Gate.com
HNT Price in 2025: Helium Network Token Value and Market Analysis
What is SwissCheese (SWCH) and How Does It Democratize Investment?
Cardano (ADA) Price Analysis and Outlook for 2025

How to Invest in Metaverse Crypto
BUCK vs LTC: A Comprehensive Comparison of Two Leading Stablecoin and Cryptocurrency Solutions

Top AI Stocks for Investment

SHFT vs DOT: A Comprehensive Comparison of Two Leading Blockchain Layer-2 Solutions

What Are Nodes?

Money-Making Games: Top 23 Projects for Earning