This comprehensive analysis examines OpenLeverage (OLE) token's price dynamics and investment potential from 2026 to 2031. As a permissionless DeFi lending and margin trading protocol, OLE currently trades at $0.001507 with a market cap of $284,266. The article evaluates key factors influencing OLE's price, including token supply mechanisms, macroeconomic conditions, and market sentiment amid extreme fear (Fear Index: 6). Price forecasts range from $0.00146-$0.00166 in 2026 to potentially $0.0034 by 2031. The analysis provides professional investment strategies, risk management frameworks, and security recommendations for OLE trading on Gate.com, while highlighting significant risks including limited liquidity, low market capitalization, and regulatory uncertainties inherent to DeFi protocols.
Introduction: OLE's Market Position and Investment Value
OpenLeverage (OLE), as a permissionless lending and margin trading protocol enabling traders to efficiently and securely long or short any trading pair on DEX, has made notable progress since its inception. As of February 2026, OLE maintains a market capitalization of approximately $284,266, with a circulating supply of around 188.63 million tokens, and its price stands at approximately $0.001507. This asset, recognized as a decentralized leverage trading solution, is playing an increasingly important role in the DeFi margin trading sector.
This article will comprehensively analyze OLE's price trends from 2026 to 2031, combining historical patterns, market supply and demand dynamics, ecosystem development, and macroeconomic conditions to provide investors with professional price forecasts and practical investment strategies.
I. OLE Price History Review and Market Status
OLE Historical Price Evolution Trajectory
- 2022: OpenLeverage reached a notable price level during the initial development phase, with the token trading at elevated levels in early July
- 2022-2026: The token experienced significant price fluctuations as the DeFi lending and margin trading protocol evolved across multiple blockchain networks
- 2026: Market conditions led to price adjustments, with the token experiencing downward pressure across various timeframes
OLE Current Market Situation
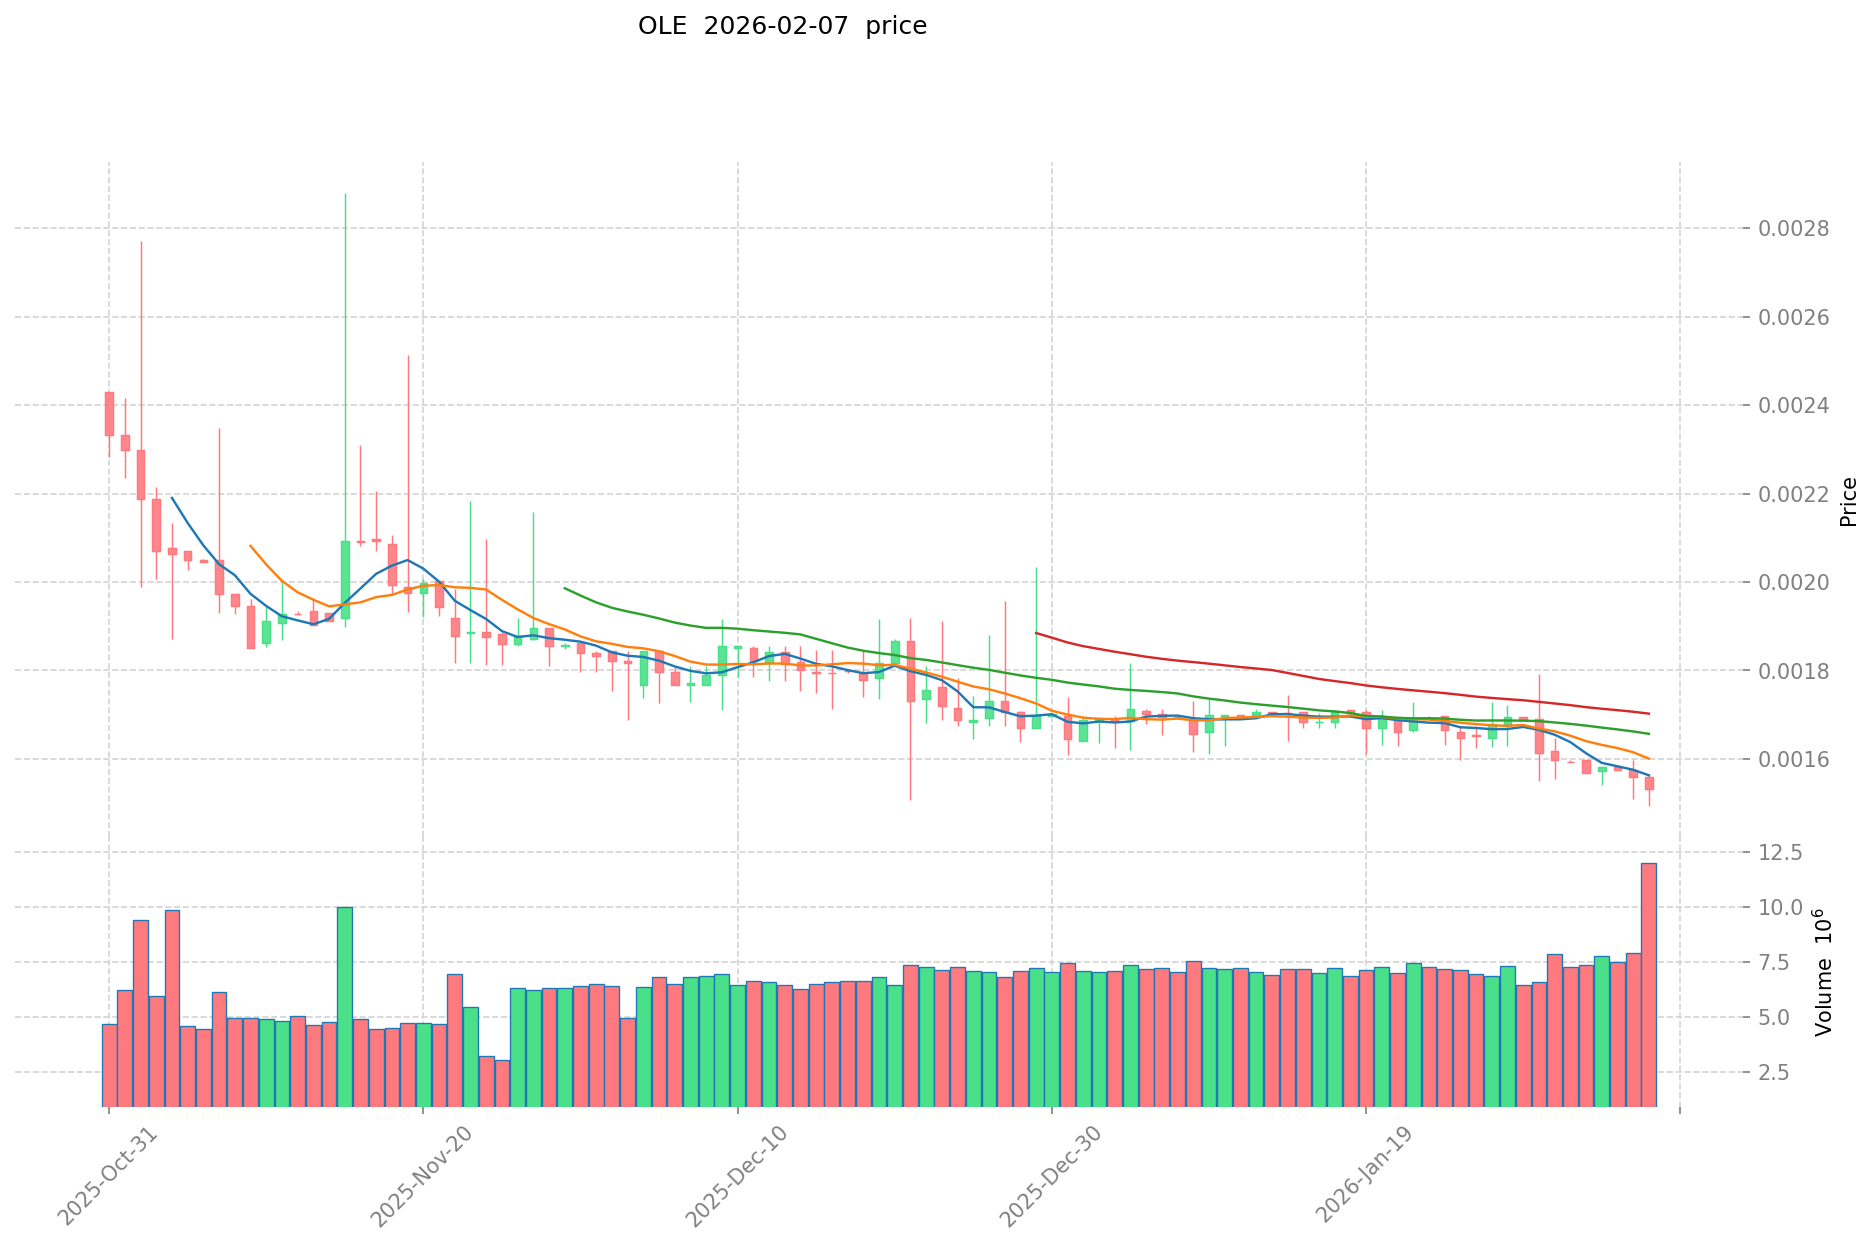
As of February 7, 2026, OLE is trading at $0.001507, with a 24-hour trading volume of $20,513.29. The token has shown mixed short-term performance, with a 0.33% increase over the past hour, while experiencing declines of 1.95% in the last 24 hours and 6.63% over the past week. The 30-day performance indicates a 10.78% decrease.
The current market capitalization stands at $284,266.27, with a circulating supply of 188,630,573 OLE tokens, representing 18.86% of the total supply of 1 billion tokens. The fully diluted market cap is calculated at $1,507,000. The token's market dominance is currently at 0.000060%.
The 24-hour price range has fluctuated between $0.001465 and $0.001562. The crypto market sentiment index currently registers at 6, indicating an extreme fear environment in the broader market. OLE is available for trading on Gate.com and maintains contract addresses on both Ethereum and BSC networks.
Click to view current OLE market price
OLE Market Sentiment Indicator
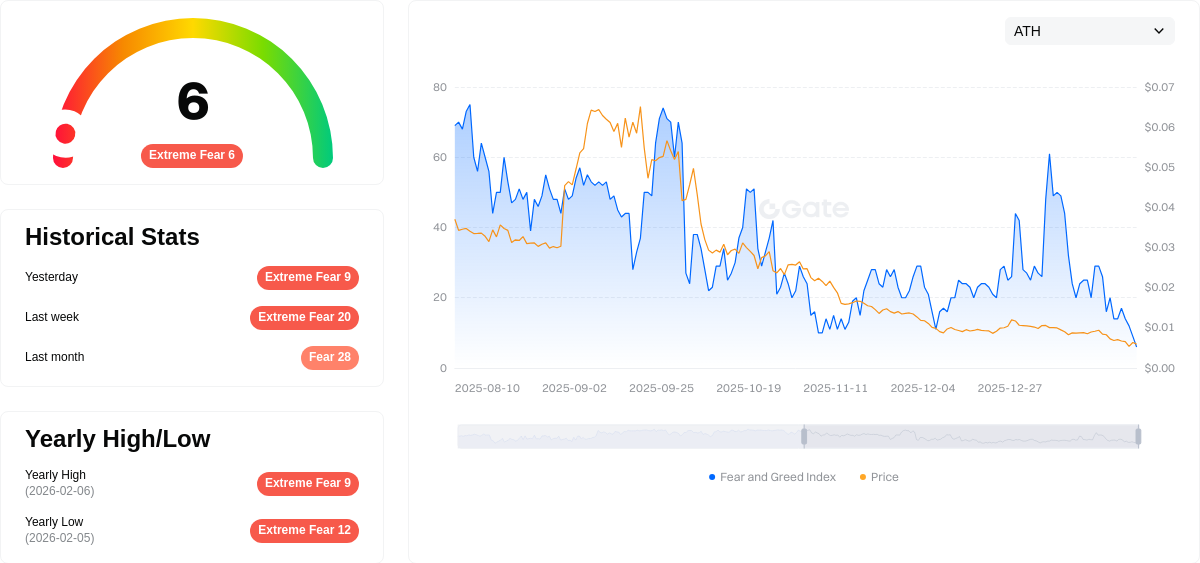
2026-02-07 Fear and Greed Index: 6 (Extreme Fear)
Click to view current Fear & Greed Index
The crypto market is experiencing extreme fear with an index reading of 6. This indicates heightened market pessimism and risk aversion among investors. When fear reaches such extreme levels, it often signals potential capitulation in the market. However, contrarian traders view extreme fear as potential accumulation opportunities, as historically, such conditions have preceded significant market recoveries. Investors should exercise caution and conduct thorough research before making trading decisions during periods of extreme market fear.
OLE Holding Distribution
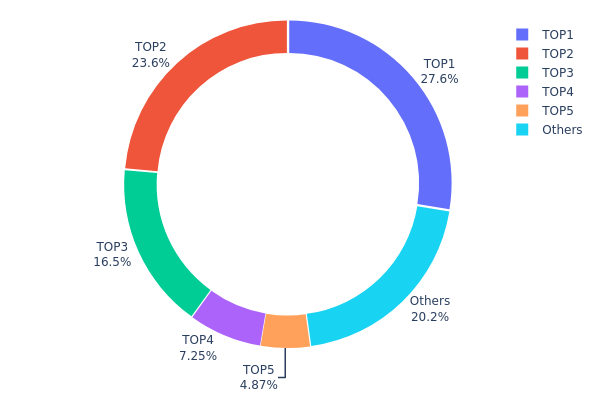
The holding distribution chart reflects the percentage of total token supply held by the top addresses on-chain. This metric serves as a critical indicator of decentralization level and potential market manipulation risks. A highly concentrated distribution suggests that a small number of addresses control the majority of circulating supply, which may lead to increased price volatility and reduced market stability.
According to the current data, the top 5 addresses collectively hold 79.75% of OLE's total supply, indicating a notably high concentration level. The largest holder (0x511d...c27e20) alone controls 27.59% of the supply, followed by the second and third addresses holding 23.57% and 16.47% respectively. This pattern demonstrates that approximately 80% of tokens are concentrated in just five wallets, while the remaining addresses share only 20.25% of the supply.
Such extreme concentration presents significant structural concerns for market health. The dominance of top holders creates asymmetric market power, where large-scale sell-offs from any major address could trigger substantial price corrections. Additionally, this distribution pattern suggests limited token circulation among retail participants and may indicate that OLE remains in early development stages with tokens potentially locked in project treasury, team allocations, or early investor wallets. From a decentralization perspective, this concentration level raises questions about governance fairness and long-term sustainability of the ecosystem.
Click to view current OLE Holding Distribution
| Top |
Address |
Holding Qty |
Holding (%) |
| 1 |
0x511d...c27e20 |
126289.10K |
27.59% |
| 2 |
0x6974...bfc524 |
107874.80K |
23.57% |
| 3 |
0xff4e...ec6cc3 |
75377.22K |
16.47% |
| 4 |
0xcffa...290703 |
33193.39K |
7.25% |
| 5 |
0x4634...eb9758 |
22288.35K |
4.87% |
| - |
Others |
92553.02K |
20.25% |
II. Core Factors Influencing OLE's Future Price
Supply Mechanism
- Token Supply Structure: OLE has a maximum supply of 1,000,000,000 tokens with a current circulating supply of 188,630,580 OLE, representing approximately 18.86% of the total supply.
- Historical Pattern: The gradual release of tokens from the remaining supply could create selling pressure if not matched by corresponding demand growth.
- Current Impact: With over 80% of tokens still not in circulation, future unlocking schedules may influence price volatility depending on release timing and market absorption capacity.
Macroeconomic Environment
- Monetary Policy Impact: Ole Hansen, Chief Commodities Strategist at Saxo Bank, noted that momentum has become a significant factor affecting price movements, with fear of missing out (FOMO) psychology playing a notable role as prices break through historical highs.
- Inflation Hedge Attribute: In the current macroeconomic environment characterized by inflation concerns, digital assets may serve as alternative stores of value, though OLE's specific performance in this context requires further observation.
- Geopolitical Factors: Global geopolitical tensions and policy uncertainties can drive investors toward alternative assets, potentially benefiting cryptocurrency markets broadly.
Market Sentiment and Speculation
- Overall Crypto Market Trends: OLE's price performance is closely tied to the broader cryptocurrency market's fundamental trends and investor sentiment.
- Project Fundamentals: Whether the project's current market capitalization appears overvalued and whether the token price sits at an appropriate entry point requires comprehensive evaluation.
- Volatility Considerations: As noted by market strategists, when volatility rises, market makers naturally widen bid-ask spreads and reduce balance sheet usage, making liquidity weakest precisely when markets need it most. This self-reinforcing volatility risk applies across crypto assets including OLE.
- Trading Venue Selection: Investors need to choose platforms offering worry-free secure transactions, convenient interfaces, and high liquidity. Gate.com provides such infrastructure for OLE trading.
- Market Liquidity: Daily trading volumes and liquidity depth directly impact price stability and execution quality for OLE transactions.
Investment Considerations
- Comprehensive Assessment Required: Whether OLE is worth investing in requires continuously evaluating various market factors, including overall crypto market trends, project fundamental information, current market cap valuation levels, and current price positioning.
- Dynamic Adjustment: If project fundamentals suddenly change or prices reach excessive levels, investors need to adjust their investment strategies and trading operations accordingly.
- Risk Management: Given the inherent volatility in cryptocurrency markets, proper risk assessment and position sizing remain essential for OLE investments.
III. 2026-2031 OLE Price Forecast
2026 Outlook
- Conservative forecast: $0.00146 - $0.00151
- Neutral forecast: $0.00151
- Optimistic forecast: Up to $0.00166
2027-2029 Outlook
- Market phase expectation: The token may experience gradual growth as adoption potentially increases and market conditions evolve
- Price range forecast:
- 2027: $0.00104 - $0.00236
- 2028: $0.00158 - $0.00203
- 2029: $0.00176 - $0.0023
- Key catalysts: Market maturation, potential ecosystem development, and broader cryptocurrency market trends could serve as primary drivers
2030-2031 Long-term Outlook
- Baseline scenario: $0.00204 - $0.00292 (assuming steady market conditions and moderate adoption growth)
- Optimistic scenario: $0.00254 - $0.0034 (contingent upon favorable regulatory developments and increased platform utility)
- Transformative scenario: Potentially reaching the upper range of $0.0034 (dependent on significant technological breakthroughs and mass market adoption)
- February 7, 2026: OLE trading within the $0.00146 - $0.00166 range (early-stage valuation phase)
| Year |
Predicted High Price |
Predicted Average Price |
Predicted Low Price |
Price Change |
| 2026 |
0.00166 |
0.00151 |
0.00146 |
0 |
| 2027 |
0.00236 |
0.00158 |
0.00104 |
5 |
| 2028 |
0.00203 |
0.00197 |
0.00158 |
30 |
| 2029 |
0.0023 |
0.002 |
0.00176 |
32 |
| 2030 |
0.00292 |
0.00215 |
0.00204 |
42 |
| 2031 |
0.0034 |
0.00254 |
0.00195 |
68 |
IV. OLE Professional Investment Strategies and Risk Management
OLE Investment Methodology
(I) Long-term Holding Strategy
- Target Audience: Investors who believe in the development potential of decentralized margin trading protocols and have a medium to long-term investment horizon
- Operational Recommendations:
- Consider dollar-cost averaging (DCA) to accumulate positions during market downturns to reduce timing risk
- Monitor protocol development milestones, including trading volume growth on Ethereum, BNB Chain, and KCC deployments
- Store assets using Gate Web3 Wallet with hardware wallet integration for enhanced security
(II) Active Trading Strategy
- Technical Analysis Tools:
- Volume Analysis: Monitor the $20,513 24-hour trading volume as liquidity indicator for entry/exit timing
- Support/Resistance Levels: Track 24-hour range ($0.001465 - $0.001562) to identify breakout opportunities
- Swing Trading Key Points:
- Be aware of relatively low liquidity with only one exchange listing, which may result in higher slippage
- Consider the 18.86% market cap to FDV ratio when evaluating potential dilution from token unlocks
OLE Risk Management Framework
(I) Asset Allocation Principles
- Conservative Investors: 1-2% of crypto portfolio
- Aggressive Investors: 3-5% of crypto portfolio
- Professional Investors: Up to 8% with appropriate hedging strategies
(II) Risk Hedging Solutions
- Portfolio Diversification: Combine OLE holdings with established DeFi blue-chips to reduce protocol-specific risk
- Position Sizing: Given the token's low market cap ($284,266) and limited exchange availability, maintain smaller position sizes
(III) Secure Storage Solutions
- Software Wallet Recommendation: Gate Web3 Wallet supports both Ethereum and BNB Chain contracts (0x1b6e9c73bee68102d9dd4a2627f97bff4183ab0a and 0xB7E2713CF55cf4b469B5a8421Ae6Fc0ED18F1467)
- Cold Storage Solution: For long-term holdings, consider hardware wallet integration with multi-signature setup
- Security Precautions: Never share private keys, enable two-factor authentication, and verify contract addresses on Etherscan or BscScan before transactions
V. OLE Potential Risks and Challenges
OLE Market Risks
- Extreme Volatility: The token has experienced a 75.13% decline over the past year, indicating substantial price volatility and market uncertainty
- Limited Liquidity: With only 529 holders and trading on a single exchange, liquidity constraints may lead to significant price slippage during large transactions
- Low Market Capitalization: At approximately $284,266 market cap, the token is highly susceptible to price manipulation and extreme volatility
OLE Regulatory Risks
- DeFi Protocol Scrutiny: Margin trading protocols may face increasing regulatory attention as authorities examine leveraged crypto trading activities
- Multi-chain Compliance: Operating across Ethereum, BNB Chain, and KCC may expose the protocol to varying regulatory requirements across different jurisdictions
- Token Classification Uncertainty: Evolving regulatory frameworks may impact the classification and tradability of governance and utility tokens
OLE Technical Risks
- Smart Contract Vulnerabilities: Despite security audits from PeckShield, Code4rena, and CertiK, complex DeFi protocols remain susceptible to undiscovered vulnerabilities
- Cross-chain Bridge Risks: Multi-chain deployment introduces additional attack vectors through bridge infrastructure connecting different blockchains
- Protocol Dependency: The protocol's reliance on DEX liquidity pools means any issues with underlying DEX platforms could impact OpenLeverage functionality
VI. Conclusion and Action Recommendations
OLE Investment Value Assessment
OpenLeverage (OLE) represents a specialized DeFi protocol focused on permissionless margin trading across multiple blockchains. While the protocol has achieved over $700 million in trading volume and maintains partnerships with notable entities like Binance Labs, the token faces significant challenges including limited liquidity, low market capitalization, and substantial price decline over the past year. The 18.86% circulating supply ratio suggests potential future dilution. Investors should view OLE as a high-risk, speculative asset suitable only for those with deep understanding of DeFi protocols and high risk tolerance.
OLE Investment Recommendations
✅ Beginners: Not recommended due to extreme volatility, limited liquidity, and complex protocol mechanics. If interested in margin trading protocols, start with established platforms and educational research
✅ Experienced Investors: Consider small allocation (1-3% of crypto portfolio) only after thorough due diligence on protocol mechanics, smart contract audits, and competitive landscape. Monitor trading volume and holder growth as key metrics
✅ Institutional Investors: Evaluate protocol fundamentals, assess market fit for decentralized margin trading, and consider pilot allocation with appropriate risk controls and liquidity management strategies
OLE Trading Participation Methods
- Spot Trading on Gate.com: Purchase OLE directly through the Gate.com trading platform with USDT or other supported pairs
- Contract Address Verification: Use verified contract addresses on Ethereum (0x1b6e9c73bee68102d9dd4a2627f97bff4183ab0a) or BNB Chain (0xB7E2713CF55cf4b469B5a8421Ae6Fc0ED18F1467) for decentralized wallet interactions
- Gate Web3 Wallet Integration: Utilize Gate Web3 Wallet for seamless interaction with OLE tokens across supported chains while maintaining self-custody
Cryptocurrency investment carries extremely high risks, and this article does not constitute investment advice. Investors should make prudent decisions based on their own risk tolerance and are advised to consult professional financial advisors. Never invest more than you can afford to lose.
FAQ
What is OLE and what is its purpose?
OLE is a cryptocurrency token designed for decentralized finance(DeFi)protocols. It serves as a utility token for governance, staking, and accessing platform features within the OLE ecosystem, enabling users to participate in yield farming and liquidity provision.
OLE price prediction uses technical analysis tools like moving averages and RSI indicators. Monitor real-time price data, market capitalization, and trading volume trends. Analyze historical price patterns and market sentiment to forecast future price movements effectively.
What are the main factors affecting OLE price?
OLE price is primarily influenced by token unlock events, circulating supply, and market demand. Investor sentiment, market trends, and protocol adoption also significantly impact price movements.
What are the risks and limitations of OLE price predictions?
OLE price predictions face inherent limitations due to high market volatility and unpredictable factors. Historical data cannot guarantee future performance. Market conditions change rapidly, making accurate forecasting challenging. Predictions should be considered as reference only, not as investment guarantees.
What are the advantages of OLE compared to other cryptocurrencies?
OLE offers high-leverage trading functionality and deep integration with major platforms, enabling users to easily conduct leveraged cryptocurrency trading and earn passive income through advanced security features and enhanced user experience.
* The information is not intended to be and does not constitute financial advice or any other recommendation of any sort offered or endorsed by Gate.