2026 TANSSI Price Prediction: Expert Analysis and Market Forecast for the Next Generation Blockchain Network


Introduction: TANSSI's Market Position and Investment Value
TANSSI (TANSSI), as a blockchain infrastructure solution designed to enable rapid appchain deployment, has been gaining attention since its launch in 2025, particularly within the RWA (Real World Assets) and PayFi verticals. As of February 2026, TANSSI's market capitalization stands at approximately $397,116, with a circulating supply of around 346.77 million tokens, and the price hovering around $0.0011452. This asset, positioned as a protocol that empowers teams to launch appchains in minutes with Ethereum-grade security, is playing an increasingly significant role in decentralized infrastructure development.
This article will comprehensively analyze TANSSI's price trajectory from 2026 to 2031, combining historical patterns, market supply-demand dynamics, ecosystem development, and macroeconomic conditions to provide investors with professional price forecasts and practical investment strategies.
I. TANSSI Price History Review and Market Status
TANSSI Historical Price Evolution Trajectory
- August 2025: TANSSI reached its historical high price of $0.08848, marking a significant milestone in the early stage of the project's market launch
- October 2025: Market experienced a significant correction phase, with the price declining to its historical low of $0.00006, representing a substantial downward movement
- Early 2026: The token continued to face price pressure, with a 30-day decline of 91.67%, reflecting challenging market conditions
TANSSI Current Market Dynamics
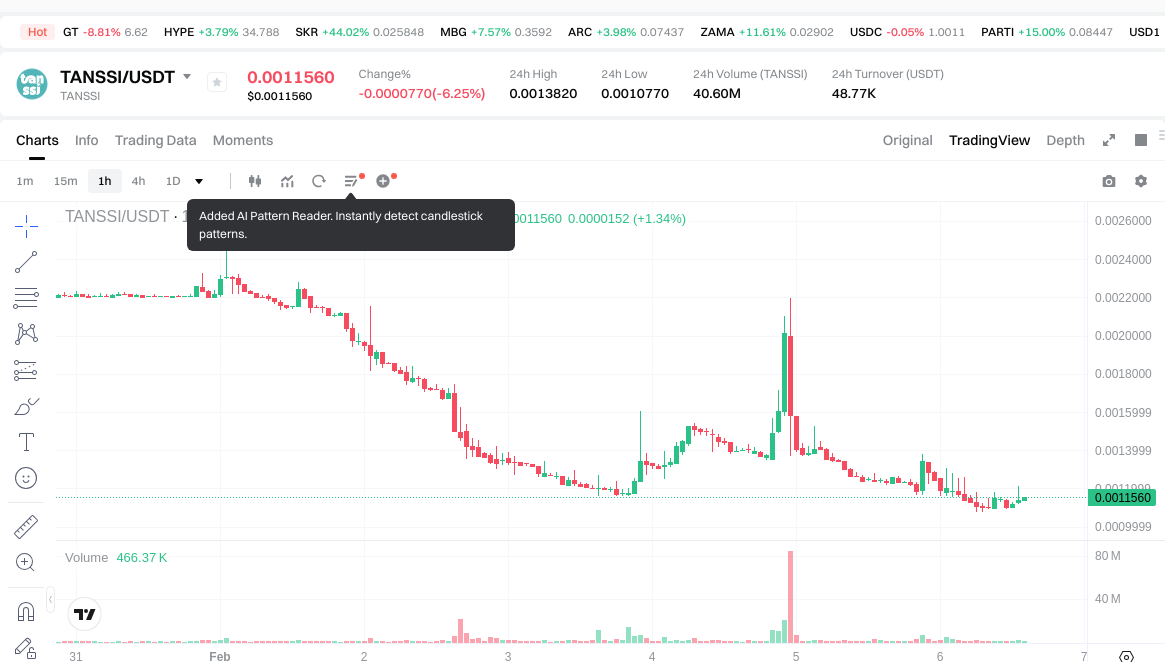
As of February 6, 2026, TANSSI is trading at $0.001145, with a 24-hour trading volume of $49,674.88. The token has experienced a 24-hour price decline of 8.42%, with intraday price fluctuations between $0.001077 and $0.001382.
The circulating supply stands at 346,765,839 TANSSI tokens, representing 18.3% of the maximum supply of 1 billion tokens. The current market capitalization is approximately $397,116, with a fully diluted market cap of $1,145,200. The token ranks #3212 in the overall cryptocurrency market, with a market dominance of 0.000048%.
Recent price performance shows continued weakness, with a 7-day decline of 52.019% and a 30-day decline of 91.67%. The token is currently trading approximately 98.7% below its all-time high recorded in August 2025.
TANSSI is deployed on the Ethereum network as an ERC-20 token, with its contract address verified on Etherscan. The token has garnered support from approximately 9,007 holders and is currently available for trading on 12 exchanges. The market sentiment indicator shows a value of 9, indicating "Extreme Fear" conditions.
Click to view current TANSSI market price
TANSSI Market Sentiment Indicator
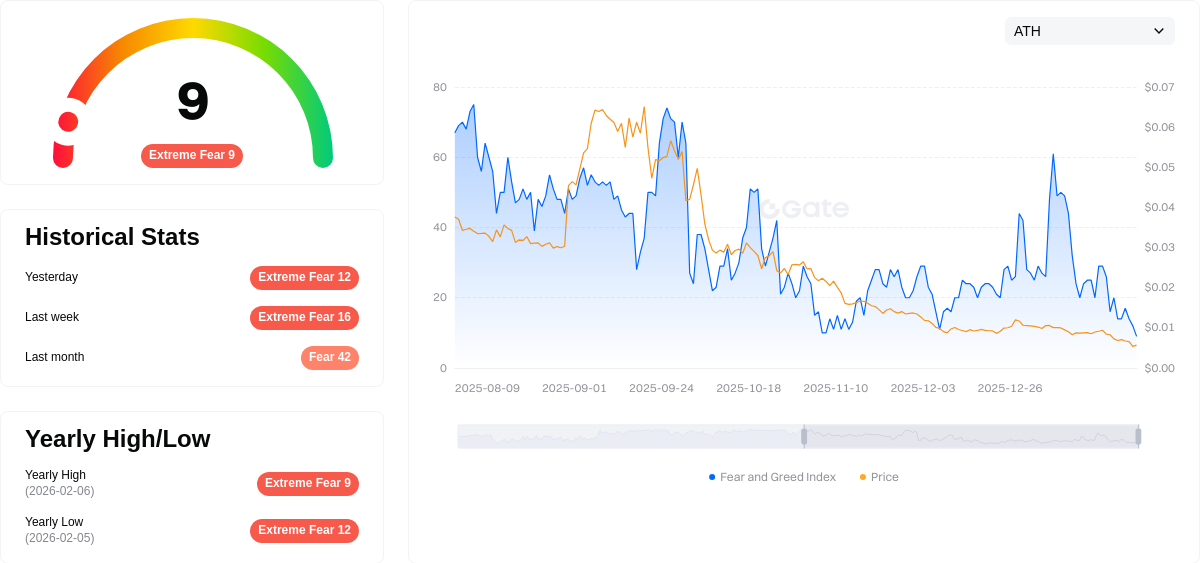
2026-02-06 Fear and Greed Index: 9 (Extreme Fear)
Click to view current Fear & Greed Index
The crypto market is currently experiencing extreme fear, with the Fear and Greed Index at 9. This critically low reading indicates severe market pessimism and risk aversion among investors. Such extreme fear often presents opportunities for contrarian traders, as markets tend to bounce back from these levels. However, extreme fear can also signal deeper market concerns. Investors should exercise caution and conduct thorough research before making trading decisions during such volatile periods.
TANSSI 持仓分布
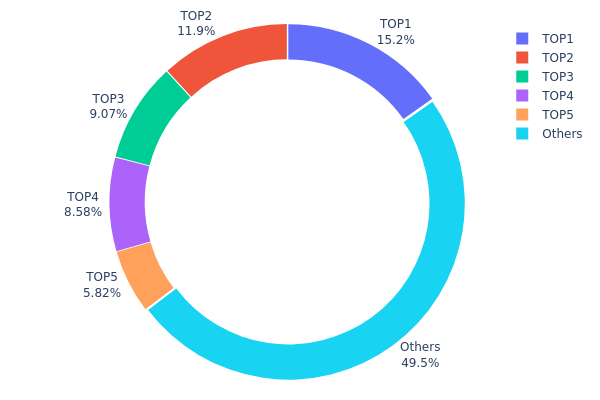
Address holding distribution reflects the concentration of token supply across different wallet addresses, serving as a key indicator of market structure and decentralization level. Current data reveals that TANSSI exhibits a moderately concentrated holding pattern, with the top 5 addresses collectively controlling approximately 50.52% of the total supply. The largest holder maintains 15.21% (53.42M tokens), followed by the second-largest at 11.85% (41.64M tokens), while the remaining 49.48% is distributed among other addresses.
This concentration level suggests a hybrid market structure where major stakeholders retain significant influence over token liquidity and price dynamics. The presence of substantial holdings in the top addresses, particularly with three addresses each controlling over 8% of supply, indicates potential vulnerability to large-scale sell pressure or coordinated market movements. However, the fact that nearly half of the supply remains distributed among smaller holders provides a degree of market resilience and suggests ongoing community participation.
From a market stability perspective, such concentration patterns typically correlate with increased price volatility during major holder activities. The current distribution indicates that TANSSI's on-chain architecture reflects typical early to mid-stage project characteristics, where foundational stakeholders and early participants maintain considerable positions. Market participants should remain cognizant that the top addresses' holding behavior could significantly impact short-term price trajectories and overall market sentiment.
View current TANSSI holding distribution
| Top | Address | Holding Qty | Holding (%) |
|---|---|---|---|
| 1 | 0xca7b...914545 | 53418.59K | 15.21% |
| 2 | 0x1ab4...8f8f23 | 41641.62K | 11.85% |
| 3 | 0x0000...e08a90 | 31859.57K | 9.07% |
| 4 | 0x0d07...b492fe | 30118.97K | 8.57% |
| 5 | 0xae5d...95daae | 20446.75K | 5.82% |
| - | Others | 173713.92K | 49.48% |
II. Core Factors Affecting TANSSI's Future Price
Market Demand and Adoption Trends
- Market Sentiment Impact: TANSSI's price trajectory is significantly influenced by overall cryptocurrency market sentiment and user adoption rates. As a token within the broader digital asset ecosystem, shifts in investor confidence and participation levels directly affect its valuation.
- Growth Projection: Market analysis suggests a projected annual growth rate of approximately 5% for TANSSI, reflecting moderate expansion expectations based on current adoption patterns and ecosystem development.
- Volatility Characteristics: The token exhibits notable price fluctuations, with historical data showing movements from approximately $0.0106 to a peak of $0.025, before stabilizing around $0.011, demonstrating its susceptibility to market dynamics.
Institutional and Whale Activity
- Trading Volume Anomalies: Data indicates instances of abnormal trading volume spikes, with certain periods showing volume amplification of up to 50 times normal levels, accompanied by significant price movements. These patterns suggest active participation from larger market participants.
- Speculative Nature: Analysts note that TANSSI's market behavior reflects the speculative characteristics common in the cryptocurrency sector, with price discovery still ongoing as the token establishes its market position.
Macroeconomic Environment
- Economic Policy Sensitivity: TANSSI's price outlook remains subject to broader macroeconomic factors, including monetary policy decisions and inflation dynamics that affect risk asset valuations globally.
- Market Correlation: The token's performance shows sensitivity to general cryptocurrency market trends, with overall sector movements potentially influencing TANSSI's price direction.
- Investment Climate Shifts: Current macroeconomic analysis suggests a transition in investment logic from speculative positioning toward assets with demonstrated utility and sustainable cash flows, which may impact speculative token valuations.
Technology Development and Ecosystem Construction
- Infrastructure Protocol Role: TANSSI functions as an infrastructure protocol within the Polkadot ecosystem, designed to simplify appchain deployment processes. This positioning provides potential utility value as the broader ecosystem develops.
- Application Potential: The token has attracted attention for its potential applications in Real World Asset (RWA) and payment finance (PayFi) sectors, though actual implementation and adoption remain key factors for future valuation.
- Risk Considerations: Despite technical positioning and potential use cases, investors should maintain awareness of the inherent volatility and speculative risks associated with emerging cryptocurrency projects.
III. 2026-2031 TANSSI Price Forecast
2026 Outlook
- Conservative Forecast: $0.00104 - $0.00116
- Neutral Forecast: $0.00116 (average scenario)
- Optimistic Forecast: Up to $0.00135 (requires favorable market conditions and ecosystem expansion)
2027-2029 Medium-term Outlook
- Market Phase Expectation: Gradual growth phase with increasing adoption and network development
- Price Range Forecast:
- 2027: $0.00066 - $0.00139
- 2028: $0.00106 - $0.00181
- 2029: $0.00133 - $0.00224
- Key Catalysts: Ecosystem maturation, technological advancements, and broader market recovery trends
2030-2031 Long-term Outlook
- Baseline Scenario: $0.00137 - $0.00242 (assuming steady ecosystem growth and stable market conditions)
- Optimistic Scenario: $0.00191 - $0.00309 (supported by significant protocol upgrades and increased network activity)
- Transformative Scenario: Potentially reaching $0.00309 by 2031 (requires exceptional adoption rates and favorable regulatory environment)
- 2026-02-06: TANSSI projected at $0.00104 - $0.00135 range (early consolidation phase with moderate growth potential)
| Year | Predicted High Price | Predicted Average Price | Predicted Low Price | Price Change |
|---|---|---|---|---|
| 2026 | 0.00135 | 0.00116 | 0.00104 | 0 |
| 2027 | 0.00139 | 0.00125 | 0.00066 | 9 |
| 2028 | 0.00181 | 0.00132 | 0.00106 | 15 |
| 2029 | 0.00224 | 0.00157 | 0.00133 | 36 |
| 2030 | 0.00242 | 0.00191 | 0.00137 | 66 |
| 2031 | 0.00309 | 0.00216 | 0.00182 | 88 |
IV. TANSSI Professional Investment Strategy and Risk Management
TANSSI Investment Methodology
(1) Long-term Holding Strategy
- Suitable for: Investors who believe in the potential of appchain infrastructure and RWA/PayFi verticals
- Operational Recommendations:
- Consider accumulating positions during market downturns when technical indicators show oversold conditions
- Monitor project development milestones and adoption metrics within the RWA and PayFi sectors
- Store assets in Gate Web3 Wallet for secure self-custody with full control over private keys
(2) Active Trading Strategy
- Technical Analysis Tools:
- Moving Averages: Track 50-day and 200-day moving averages to identify trend reversals and momentum shifts
- Relative Strength Index (RSI): Monitor RSI levels to identify overbought (above 70) or oversold (below 30) conditions for potential entry or exit points
- Swing Trading Key Points:
- Set stop-loss orders at 5-10% below entry price to limit downside risk
- Take partial profits when price reaches 15-20% gains to lock in returns while maintaining exposure
TANSSI Risk Management Framework
(1) Asset Allocation Principles
- Conservative Investors: 1-3% of crypto portfolio
- Aggressive Investors: 5-8% of crypto portfolio
- Professional Investors: 10-15% of crypto portfolio with active monitoring
(2) Risk Hedging Solutions
- Diversification: Combine TANSSI holdings with established Layer 1 tokens and stablecoins to balance portfolio volatility
- Position Sizing: Use dollar-cost averaging to enter positions gradually rather than investing lump sums
(3) Secure Storage Solutions
- Non-custodial Wallet Recommendation: Gate Web3 Wallet offers secure self-custody with multi-chain support
- Hardware Wallet Solution: Consider using hardware wallets for long-term holdings exceeding significant value thresholds
- Security Precautions: Never share private keys or seed phrases, enable two-factor authentication, and verify contract addresses before transactions
V. TANSSI Potential Risks and Challenges
TANSSI Market Risks
- High Volatility: TANSSI has experienced significant price fluctuations, with a 7-day decline of 52.019% and 30-day decline of 91.67%, indicating substantial volatility that may continue
- Low Liquidity: With a 24-hour trading volume of approximately $49,674.88 and market capitalization of $397,116.24, the token faces liquidity challenges that could amplify price swings
- Market Ranking: Currently ranked #3212 with a market dominance of 0.000048%, indicating limited market presence and potential difficulty in price discovery
TANSSI Regulatory Risks
- RWA Compliance: As the project focuses on Real World Assets, evolving regulatory frameworks for tokenized assets could impact adoption and operational capabilities
- Cross-Border Operations: Appchain infrastructure serving global PayFi teams may face varying jurisdictional requirements affecting deployment and usage
- Securities Classification: Depending on how tokens are utilized within the ecosystem, regulatory bodies may impose additional compliance requirements
TANSSI Technical Risks
- Network Security: While claiming Ethereum-grade security, the project's actual security implementation requires ongoing validation and testing
- Smart Contract Vulnerabilities: As an ERC-20 token, TANSSI is subject to potential smart contract bugs or exploits that could affect token holders
- Adoption Dependency: The project's success relies heavily on attracting RWA and PayFi teams to build on its infrastructure, with execution risks in achieving critical mass
VI. Conclusion and Action Recommendations
TANSSI Investment Value Assessment
TANSSI presents an infrastructure play targeting the emerging RWA and PayFi sectors with a value proposition centered on rapid appchain deployment. The project's focus on Ethereum-grade security and fast finality addresses key pain points for teams requiring decentralized infrastructure. However, the token currently faces significant challenges, including severe price depreciation over recent periods, limited liquidity, and low market presence. The long-term value proposition depends on successful adoption within target verticals and the broader growth of RWA and PayFi ecosystems. Short-term risks remain elevated due to market volatility, limited trading depth, and the project's early stage of development.
TANSSI Investment Recommendations
✅ Beginners: Avoid allocation until the project demonstrates stronger market stability and increased liquidity. If interested in the RWA/PayFi sector, consider researching and observing the project's development before committing capital.
✅ Experienced Investors: Limit exposure to 1-3% of crypto portfolio, employ strict risk management with stop-loss orders, and monitor project milestones and adoption metrics closely. Consider waiting for technical confirmation of trend reversal before entry.
✅ Institutional Investors: Conduct comprehensive due diligence on the project's technical architecture, team credentials, and competitive positioning. Consider participating only with appropriate risk controls and as part of a diversified infrastructure investment thesis.
TANSSI Trading Participation Methods
- Spot Trading: Purchase TANSSI directly on Gate.com with support for various trading pairs and competitive fees
- Dollar-Cost Averaging: Set up recurring purchases on Gate.com to accumulate positions gradually and reduce timing risk
- Web3 Wallet Integration: Use Gate Web3 Wallet for self-custody and direct interaction with decentralized applications in the Tanssi ecosystem
Cryptocurrency investment carries extremely high risks, and this article does not constitute investment advice. Investors should make prudent decisions based on their own risk tolerance and are advised to consult professional financial advisors. Never invest more than you can afford to lose.
FAQ
What is TANSSI? What are its main functions and use cases?
TANSSI is a parachain in the Polkadot ecosystem designed to provide block production and data retrieval services. It separates these critical functions from application chains to enhance efficiency and scalability, enabling developers to build optimized appchains with reduced complexity and infrastructure costs.
What is the price prediction for TANSSI in 2024-2025? What are the main factors affecting its price?
TANSSI price predictions for 2024-2025 depend on market demand, developer adoption, and ecosystem growth. Key factors include network upgrades, parachain activity, validator participation, and overall Web3 market sentiment.
What are TANSSI's advantages compared to other Layer2 or parachain projects?
TANSSI offers high-speed transaction processing, low latency, and multi-chain interoperability. It enables developers to launch application-specific chains efficiently while maintaining strong security and cross-chain compatibility, providing significant advantages in the Layer2 landscape.
How has TANSSI's historical price performance been? What stages has it gone through from issuance to now?
TANSSI launched at $0.0106 and reached a peak of $0.025, representing approximately 20% gains. It subsequently declined to around $0.011. As of February 6, 2026, TANSSI trades near $0.011, reflecting consolidation after its initial rally phase.
What risks should I consider when investing in TANSSI? Is market volatility high?
TANSSI carries execution and competition risks as the project competes within the blockchain ecosystem. Market volatility is relatively significant, with price movements influenced by project development progress and market sentiment. Success depends on timely feature delivery and competitive positioning.
What is TANSSI's tokenomics? What are the total supply, circulating supply, and release schedule?
TANSSI has a total supply of 1 billion tokens, designed to ensure decentralization and incentivize network participation. Circulating supply details and specific release schedules are not fully disclosed publicly, but the token distribution is structured to support long-term network growth and sustainability.
Share
Content
Introduction: TANSSI's Market Position and Investment Value
I. TANSSI Price History Review and Market Status
II. Core Factors Affecting TANSSI's Future Price
III. 2026-2031 TANSSI Price Forecast
IV. TANSSI Professional Investment Strategy and Risk Management
V. TANSSI Potential Risks and Challenges
VI. Conclusion and Action Recommendations
FAQ
How to Buy Cryptocurrency


Trending Cryptocurrencies


2025 SUI coin: price, buying guide, and Staking rewards

How to Buy Crypto: A Step-by-Step Guide with Gate.com

HNT Price in 2025: Helium Network Token Value and Market Analysis

What is SwissCheese (SWCH) and How Does It Democratize Investment?
Cardano (ADA) Price Analysis and Outlook for 2025
How to Invest in Metaverse Crypto

What is the current market overview of Dogecoin (DOGE) with $15.29B market cap and $4.06B 24-hour trading volume?

NODL vs FLOW: A Comprehensive Comparison of Two Leading Blockchain Development Platforms
NC vs ETH: A Comprehensive Comparison of Network Capabilities and Transaction Efficiency in Blockchain Technology
What is NXPC token: fundamentals, whitepaper logic, and use case analysis for MapleStory N blockchain game
RITE vs QNT: A Comprehensive Comparison of Enterprise Blockchain Solutions and Their Market Impact