This comprehensive guide compares LABUBU and ZIL as emerging digital collectibles and blockchain platforms. LABUBU, launched in 2025 as a Pop Mart Nordic elf IP collectible on Solana blockchain, offers IP-driven scarcity-based value with significant price volatility and limited liquidity ($38K daily volume). ZIL, established in 2018 as a sharding-based blockchain platform, demonstrates higher market maturity with larger capitalization and superior liquidity ($2.87M daily volume). The analysis examines historical price performance, tokenomics mechanisms, institutional adoption, technological ecosystems, and investment strategies across conservative to aggressive portfolios. Both assets face extreme fear market sentiment while projecting growth through 2031, with ZIL showing relatively higher stability and LABUBU presenting greater volatility potential. Investors should conduct independent research and consider risk tolerance before allocating capital through Gate exchange.
Introduction: LABUBU vs ZIL Investment Comparison
In the cryptocurrency market, the comparison between LABUBU and ZIL has become a topic of interest for investors. The two differ significantly in market cap ranking, application scenarios, and price performance, representing distinct positioning within the crypto asset landscape.
LABUBU: Launched in 2025, this token is associated with the Nordic elf IP created by Long Jiasheng under Pop Mart, which has gained attention in the global trendy toy market. Currently ranked 2906 with a market cap of approximately $593,988, LABUBU operates on the Solana blockchain.
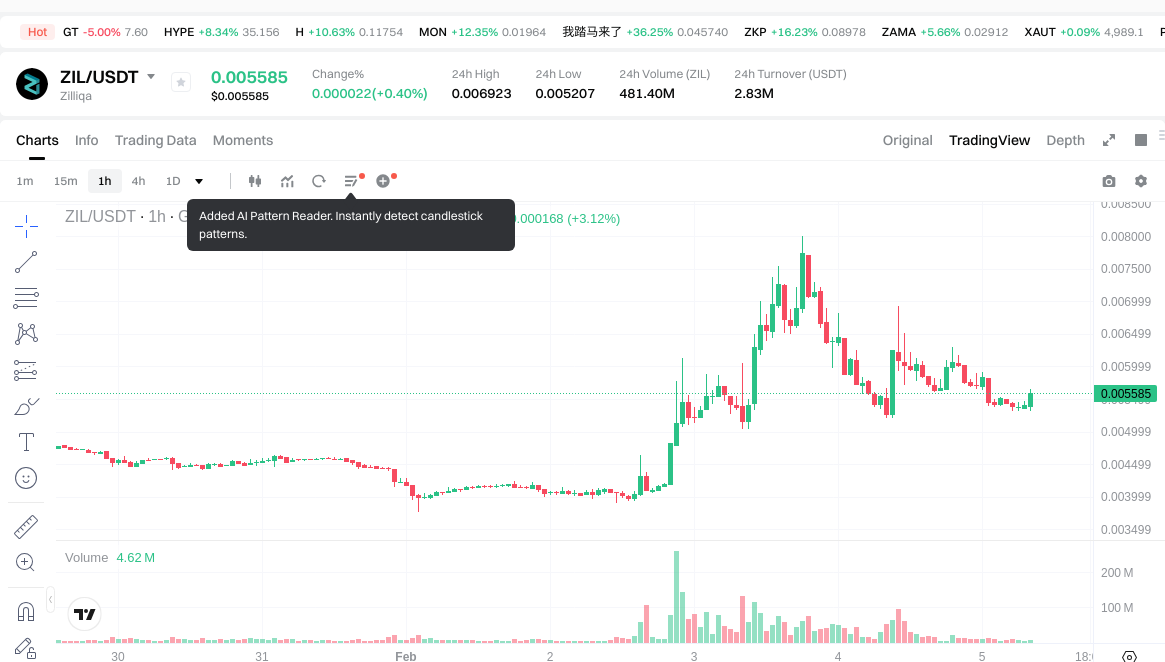
Zilliqa (ZIL): Established in 2018, ZIL positions itself as a high-throughput public blockchain platform capable of processing thousands of transactions per second through sharding technology. Ranked 294 with a market cap of approximately $107.28 million, it serves applications requiring scalability such as electronic advertising, payments, and shared economy.
This article will comprehensively analyze the investment value comparison between LABUBU and ZIL across historical price trends, supply mechanisms, institutional adoption, technical ecosystems, and future projections, attempting to address investors' primary concern:
"Which is the better buy right now?"
I. Historical Price Comparison and Current Market Status
LABUBU (Coin A) and ZIL (Coin B) Historical Price Trends
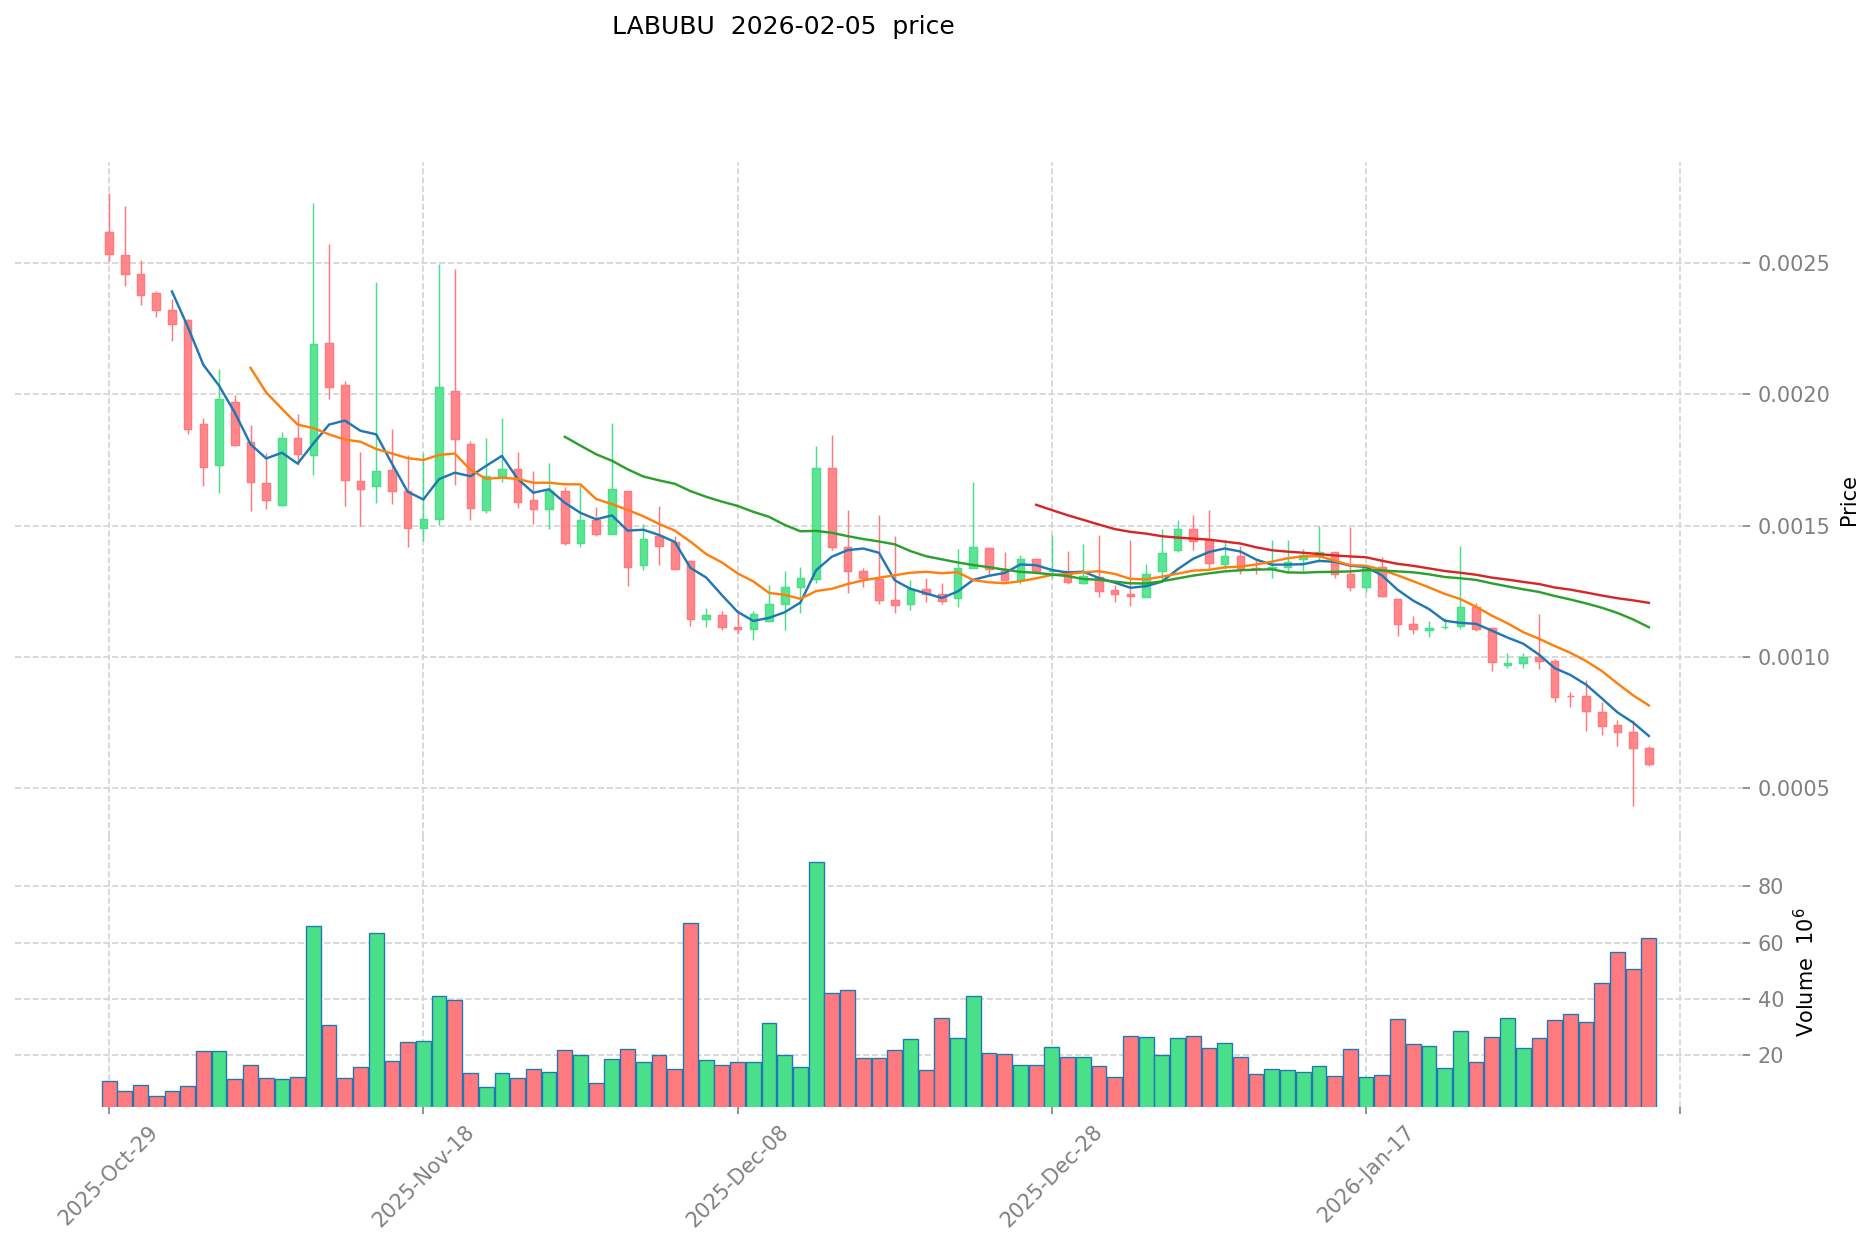
- 2025: LABUBU, as a Nordic elf IP created under Pop Mart, experienced notable price volatility following its launch in January 2025, with the token reaching an all-time high of $0.06178 in June 2025.
- 2021: ZIL was influenced by the broader cryptocurrency bull market cycle, with its price reaching a peak of $0.255376 in May 2021.
- 2020: ZIL recorded its historical low of $0.00239616 in March 2020 during the market downturn associated with global economic uncertainty.
- Comparative Analysis: During recent market cycles, LABUBU declined from its high of $0.06178 to a low of $0.0004305 in February 2026, representing a significant correction. Meanwhile, ZIL has traded within a range, experiencing a decline of approximately 62.98% over the past year as of February 2026.
Current Market Situation (2026-02-05)
- LABUBU Current Price: $0.000594
- ZIL Current Price: $0.005389
- 24-Hour Trading Volume: LABUBU $38,049.46 vs ZIL $2,870,801.76
- Market Sentiment Index (Fear & Greed Index): 14 (Extreme Fear)
Click to view real-time prices:
II. Core Factors Influencing LABUBU vs ZIL Investment Value
Supply Mechanism Comparison (Tokenomics)
-
LABUBU: As a physical collectible IP product rather than a cryptocurrency, LABUBU operates on scarcity-driven supply management. Pop Mart employs a "seven-tenths full" supply strategy, maintaining relative scarcity through limited releases, pre-sale models, and dynamic inventory control based on real-time market data and secondary market price fluctuations.
-
ZIL: Information regarding ZIL's specific supply mechanism was not available in the provided materials.
-
📌 Historical Pattern: For LABUBU, supply control mechanisms directly influence secondary market pricing cycles. Market analysis indicates that when secondary market speculation retreats, the business model transitions from relying on "investment product" expectations back to "consumer product" fundamentals, demonstrating how supply strategy impacts price volatility.
Institutional Adoption and Market Application
-
Institutional Holdings: No comparative data was available in the provided materials regarding institutional preference between LABUBU and ZIL.
-
Corporate Adoption: LABUBU has gained significant corporate and commercial adoption through cross-brand collaborations, including partnerships with luxury brands and presence in premium retail locations. Pop Mart's DTC (Direct to Customer) model and global expansion strategy, particularly in overseas markets where single-store revenue reached RMB 24.48 million (approximately 2.6 times domestic store revenue in 2024), demonstrates strong commercial application.
-
National Policies: Regulatory attitudes toward LABUBU and ZIL across different countries were not detailed in the provided materials.
Technology Development and Ecosystem Construction
-
LABUBU Technology Upgrade: Pop Mart has implemented AI-assisted design, 3D printing, and self-built production capacity to significantly compress development cycles. The company established a flexible supply chain system with "small batch trial production - market feedback - rapid iteration" agile coordination, enabling responsive market adaptation. A global data middle platform supports柔性供应链 (flexible supply chain) and refined membership operation management.
-
ZIL Technology Development: Specific technical development information for ZIL was not available in the provided materials.
-
Ecosystem Comparison: LABUBU's ecosystem extends beyond core collectibles into multiple business lines including theme parks, jewelry (popop brand), apparel, desserts, and planned animation content. The company has built a comprehensive operational platform covering global artist discovery, IP incubation operations, consumer outreach, trend culture promotion, and innovative business incubation and investment. However, these new business formats have not yet reached significant scale.
Macroeconomic and Market Cycles
-
Performance in Inflationary Environments: Analysis from the provided materials suggests LABUBU's value derives from "social currency" attributes and emotional value consumption rather than traditional inflation-hedging properties. Its pricing is driven by scarcity, IP operation, and social media propagation, making it fundamentally different from traditional inflation-resistant assets.
-
Macroeconomic Monetary Policy: The impact of interest rates and dollar index on LABUBU and ZIL was not specifically addressed in the provided materials.
-
Geopolitical Factors: Pop Mart's global expansion strategy demonstrates responsiveness to cross-border demand. The company's overseas business contributed RMB 5.066 billion in 2024 (up 375.2% year-over-year), with localized operations in each market. However, specific geopolitical impact analysis comparing LABUBU and ZIL was not available in the provided materials.
III. 2026-2031 Price Prediction: LABUBU vs ZIL
Short-term Forecast (2026)
- LABUBU: Conservative $0.000473 - $0.000599 | Optimistic $0.000599 - $0.000772
- ZIL: Conservative $0.004302 - $0.00566 | Optimistic $0.00566 - $0.008264
Mid-term Forecast (2028-2029)
- LABUBU may enter a consolidation phase with projected price range of $0.000621 - $0.001091 in 2028-2029 period
- ZIL may enter a growth phase with projected price range of $0.005716 - $0.010526 during the same timeframe
- Key drivers: institutional capital inflows, ETF developments, ecosystem expansion
Long-term Forecast (2030-2031)
- LABUBU: Baseline scenario $0.000602 - $0.001224 | Optimistic scenario $0.001224 - $0.001542
- ZIL: Baseline scenario $0.006152 - $0.011583 | Optimistic scenario $0.011583 - $0.013553
View detailed price predictions for LABUBU and ZIL
Disclaimer: Price predictions are speculative and based on historical data analysis. Cryptocurrency markets are highly volatile and subject to numerous unpredictable factors. These projections should not be considered as financial advice or investment recommendations.
LABUBU:
| Year |
Predicted High Price |
Predicted Average Price |
Predicted Low Price |
Price Change |
| 2026 |
0.000772323 |
0.0005987 |
0.000472973 |
0 |
| 2027 |
0.000788338225 |
0.0006855115 |
0.00042501713 |
15 |
| 2028 |
0.0010906487965 |
0.0007369248625 |
0.000655863127625 |
24 |
| 2029 |
0.00105999272222 |
0.0009137868295 |
0.00062137504406 |
53 |
| 2030 |
0.001460596868272 |
0.00098688977586 |
0.000602002763274 |
66 |
| 2031 |
0.001541916585803 |
0.001223743322066 |
0.000673058827136 |
106 |
ZIL:
| Year |
Predicted High Price |
Predicted Average Price |
Predicted Low Price |
Price Change |
| 2026 |
0.0082636 |
0.00566 |
0.0043016 |
5 |
| 2027 |
0.009607284 |
0.0069618 |
0.00661371 |
29 |
| 2028 |
0.0091129962 |
0.008284542 |
0.00571633398 |
53 |
| 2029 |
0.010525510611 |
0.0086987691 |
0.006872027589 |
61 |
| 2030 |
0.013553117196255 |
0.0096121398555 |
0.00615176950752 |
78 |
| 2031 |
0.013551675375276 |
0.011582628525877 |
0.007297055971302 |
114 |
IV. Investment Strategy Comparison: LABUBU vs ZIL
Long-term vs Short-term Investment Strategies
-
LABUBU: May appeal to investors interested in IP-driven collectible assets with cultural brand value and social media propagation potential. The asset demonstrates characteristics tied to consumer product fundamentals and Pop Mart's global expansion strategy, particularly in overseas markets where single-store revenue performance has shown strength.
-
ZIL: May attract investors seeking exposure to blockchain infrastructure with sharding technology and applications in scalability-focused sectors. The platform's positioning in electronic advertising, payments, and shared economy applications represents a different value proposition compared to collectible-based assets.
Risk Management and Asset Allocation
-
Conservative Investors: LABUBU 20-30% vs ZIL 70-80%. Given LABUBU's higher volatility range and smaller market cap, conservative portfolios may favor ZIL's relatively larger market capitalization and established blockchain infrastructure positioning.
-
Aggressive Investors: LABUBU 50-60% vs ZIL 40-50%. Investors with higher risk tolerance may allocate more significantly to LABUBU given its emerging market position and potential correlation with Pop Mart's global expansion trajectory.
-
Hedging Tools: Stablecoin allocation, options strategies, cross-asset portfolio diversification to manage volatility exposure across different asset categories.
V. Potential Risk Comparison
Market Risk
-
LABUBU: Exhibits substantial price volatility, with historical decline from $0.06178 to $0.0004305 representing significant correction potential. Trading volume of $38,049.46 indicates relatively limited liquidity compared to established cryptocurrencies. Market sentiment index at 14 (Extreme Fear) suggests heightened risk environment.
-
ZIL: Experienced approximately 62.98% decline over the past year as of February 2026. Trading volume of $2,870,801.76 indicates relatively higher liquidity than LABUBU. Price range behavior suggests exposure to broader cryptocurrency market cycles.
Technical Risk
-
LABUBU: As an IP-based collectible asset operating on Solana blockchain, technical risks relate to blockchain infrastructure dependencies and the sustainability of Pop Mart's supply chain management systems. The transition from "investment product" expectations to "consumer product" fundamentals represents a structural shift that may impact price stability.
-
ZIL: Positioned as a sharding-based blockchain platform, potential technical risks include network scalability challenges, security considerations inherent to distributed systems, and competitive pressures from alternative layer-1 blockchain solutions.
Regulatory Risk
- Global regulatory frameworks continue to evolve for both cryptocurrency assets and blockchain-based applications. LABUBU's positioning as an IP collectible asset may face different regulatory considerations compared to ZIL's blockchain infrastructure classification. Cross-border operational dynamics, particularly relevant to Pop Mart's international expansion strategy, may introduce additional compliance considerations for LABUBU.
VI. Conclusion: Which Is the Better Buy?
📌 Investment Value Summary:
-
LABUBU Characteristics: Represents exposure to IP-driven collectible market with ties to Pop Mart's global expansion strategy. Demonstrates significant price volatility with smaller market capitalization. Operates on flexible supply management principles tied to consumer product fundamentals. Cross-brand collaboration ecosystem and overseas revenue growth trajectory present distinct value proposition.
-
ZIL Characteristics: Established blockchain infrastructure platform with sharding technology positioning. Larger market capitalization and higher trading volume relative to LABUBU. Applications focused on scalability requirements across electronic advertising, payments, and shared economy sectors. Longer operational history since 2018 provides more extensive price performance data.
✅ Investment Considerations:
-
Beginning Investors: Consider starting with smaller position sizes in either asset given the current extreme fear market sentiment (index: 14). ZIL's relatively higher liquidity and established market presence may provide more accessible entry points for those new to cryptocurrency markets.
-
Experienced Investors: May evaluate portfolio allocation based on risk tolerance and investment thesis. LABUBU's correlation with Pop Mart's business performance and IP ecosystem development presents a different risk-return profile compared to ZIL's blockchain infrastructure positioning. Diversification across both assets may provide exposure to distinct value drivers.
-
Institutional Investors: Should conduct comprehensive due diligence on governance structures, liquidity profiles, and regulatory classifications. ZIL's blockchain platform positioning may align with infrastructure-focused investment mandates, while LABUBU's collectible asset characteristics may fit alternative investment strategies focused on consumer brand exposure.
⚠️ Risk Disclosure: Cryptocurrency markets exhibit extreme volatility. This analysis does not constitute investment advice. Market conditions, technological developments, and regulatory environments may change materially. Investors should conduct independent research and consider their individual risk tolerance before making investment decisions.
VII. FAQ
Q1: What is the current price difference between LABUBU and ZIL, and which has better liquidity?
As of February 5, 2026, ZIL is priced at $0.005389 while LABUBU is priced at $0.000594, making ZIL approximately 9 times more expensive. More significantly, ZIL demonstrates substantially better liquidity with a 24-hour trading volume of $2,870,801.76 compared to LABUBU's $38,049.46 - representing roughly 75 times higher trading activity. This liquidity difference is critical for investors, as ZIL's higher volume enables easier entry and exit positions with lower slippage risk, while LABUBU's limited liquidity may result in greater price impact during trades and potential difficulty executing larger orders.
Q2: How do LABUBU and ZIL differ in their fundamental value propositions?
LABUBU and ZIL represent fundamentally different asset categories within the crypto space. LABUBU operates as an IP-driven collectible asset tied to Pop Mart's Nordic elf character, deriving value from brand recognition, scarcity management, and cultural significance rather than technological utility. Its value proposition centers on "social currency" attributes and consumer product fundamentals. In contrast, ZIL functions as a blockchain infrastructure platform utilizing sharding technology to achieve high transaction throughput, serving practical applications in electronic advertising, payments, and shared economy sectors. This distinction means LABUBU's performance correlates with Pop Mart's brand management and global expansion success, while ZIL's value relates to blockchain adoption, network effects, and technological competitiveness.
Q3: What are the projected price ranges for LABUBU and ZIL through 2031?
For 2026, LABUBU projects a conservative range of $0.000473-$0.000599 and optimistic range of $0.000599-$0.000772, while ZIL forecasts conservative $0.004302-$0.00566 and optimistic $0.00566-$0.008264. By 2031, LABUBU's baseline scenario projects $0.000602-$0.001224 with optimistic potential reaching $0.001542, representing approximately 106% price change from current levels. ZIL's 2031 baseline scenario forecasts $0.006152-$0.011583 with optimistic potential of $0.013553, indicating approximately 114% price change. These projections suggest both assets have growth potential, though ZIL maintains higher absolute price levels throughout the forecast period. However, these predictions are speculative and based on historical data analysis - cryptocurrency markets remain highly volatile and subject to numerous unpredictable factors including technological developments, regulatory changes, and macroeconomic conditions.
Q4: Which asset carries higher risk, and what are the primary risk factors for each?
LABUBU carries significantly higher market risk due to extreme price volatility - it declined from $0.06178 to $0.0004305, representing over 99% correction. Its smaller market cap ranking (2906) and minimal trading volume ($38,049.46) create substantial liquidity risk. Primary risk factors include dependence on Pop Mart's brand management success, transition from speculative "investment product" to "consumer product" fundamentals, and sustainability of the collectible market. ZIL demonstrates lower relative risk with a higher market cap ranking (294) and greater liquidity, though it experienced approximately 63% decline over the past year. ZIL's primary risks include blockchain technology competition, network security considerations, scalability challenges, and broader cryptocurrency market cycle exposure. The current market sentiment index of 14 (Extreme Fear) indicates heightened risk environment for both assets.
Q5: How should different investor types allocate between LABUBU and ZIL?
Conservative investors should consider a 20-30% LABUBU allocation versus 70-80% ZIL allocation, favoring ZIL's relatively larger market capitalization, established infrastructure positioning, and higher liquidity. Aggressive investors with higher risk tolerance may allocate 50-60% to LABUBU versus 40-50% to ZIL, accepting greater volatility exposure for potential correlation with Pop Mart's global expansion trajectory. Beginning investors should start with smaller position sizes in either asset given the extreme fear market sentiment, with ZIL potentially offering more accessible entry points due to higher liquidity. Institutional investors should conduct comprehensive due diligence on governance structures and regulatory classifications - ZIL's blockchain platform positioning may align with infrastructure-focused mandates, while LABUBU's collectible characteristics may fit alternative investment strategies focused on consumer brand exposure. All investors should implement hedging tools including stablecoin allocation, options strategies, and cross-asset diversification to manage volatility exposure.
Q6: What technological advantages does each asset possess?
LABUBU leverages Pop Mart's technological infrastructure including AI-assisted design, 3D printing, and self-built production capacity that compresses development cycles. The company operates a flexible supply chain with "small batch trial production - market feedback - rapid iteration" methodology, supported by a global data middle platform enabling refined membership management. This technological framework supports dynamic inventory control and responsive market adaptation. ZIL's core technological advantage lies in its sharding technology, enabling the blockchain platform to process thousands of transactions per second - a critical capability for applications requiring high scalability such as electronic advertising, payments, and shared economy platforms. While LABUBU's technology focuses on supply chain optimization and consumer engagement, ZIL's technology addresses blockchain infrastructure scalability challenges, representing fundamentally different technological value propositions.
Q7: How do macroeconomic factors affect LABUBU versus ZIL?
LABUBU demonstrates limited correlation with traditional inflation-hedging properties, as its value derives primarily from "social currency" attributes, emotional consumption, and IP brand strength rather than macroeconomic fundamentals. Its pricing responds to scarcity management, social media propagation, and Pop Mart's operational execution - making it relatively insulated from traditional monetary policy impacts but potentially vulnerable to consumer discretionary spending trends. ZIL, as a cryptocurrency asset, exhibits greater sensitivity to broader crypto market cycles, which historically correlate with macroeconomic conditions including interest rates, dollar strength, and risk appetite. During periods of monetary tightening or risk-off sentiment, ZIL may experience pressure alongside other crypto assets, while LABUBU's performance may depend more on brand momentum and collectible market dynamics. However, Pop Mart's global expansion strategy demonstrates that LABUBU maintains exposure to cross-border demand patterns and international market conditions, particularly relevant given the company's strong overseas revenue growth trajectory.
Q8: What is the investment outlook for 2026-2027 for both assets?
For 2026-2027, both assets face challenging near-term conditions reflected in the extreme fear market sentiment (index: 14). LABUBU projects potential consolidation within $0.000473-$0.000772 range in 2026, with 2027 forecasts showing modest 15% price change to $0.000425-$0.000788 range. The asset's near-term performance depends heavily on Pop Mart's ability to sustain overseas expansion momentum and manage the transition from speculative to consumer product fundamentals. ZIL forecasts a 2026 conservative range of $0.004302-$0.00566 with optimistic potential reaching $0.008264, followed by 2027 projections of $0.006614-$0.009607 representing approximately 29% price change. Key drivers for both assets include institutional capital flows, ecosystem development progress, and broader cryptocurrency market recovery. Investors should note that the current extreme fear environment suggests potential for both downside risk if market conditions deteriorate further, and recovery opportunity if sentiment improves and adoption metrics strengthen.
* The information is not intended to be and does not constitute financial advice or any other recommendation of any sort offered or endorsed by Gate.