2025 DBR Price Prediction: Expert Analysis and Market Forecast for Digital Blockchain Reserve Token


Introduction: DBR's Market Position and Investment Value
deBridge (DBR) serves as DeFi's internet of liquidity, enabling real-time movement of assets and information across the DeFi landscape. Since its launch in October 2024, deBridge has established itself as a critical infrastructure solution for cross-chain interactions. As of December 19, 2025, DBR has achieved a market capitalization of $200.9 million with a circulating supply of 1.8 billion tokens, currently trading at approximately $0.02009. This innovative protocol, which eliminates the bottlenecks and risks associated with traditional liquidity pools, is playing an increasingly important role in powering seamless cross-chain transactions with deep liquidity, tight spreads, and guaranteed rates.
This article will comprehensively analyze DBR's price trajectory from 2025 through 2030, combining historical patterns, market supply and demand dynamics, ecosystem development, and macroeconomic factors to provide investors with professional price forecasts and practical investment strategies.
deBridge (DBR) Market Analysis Report
I. DBR Price History Review and Current Market Status
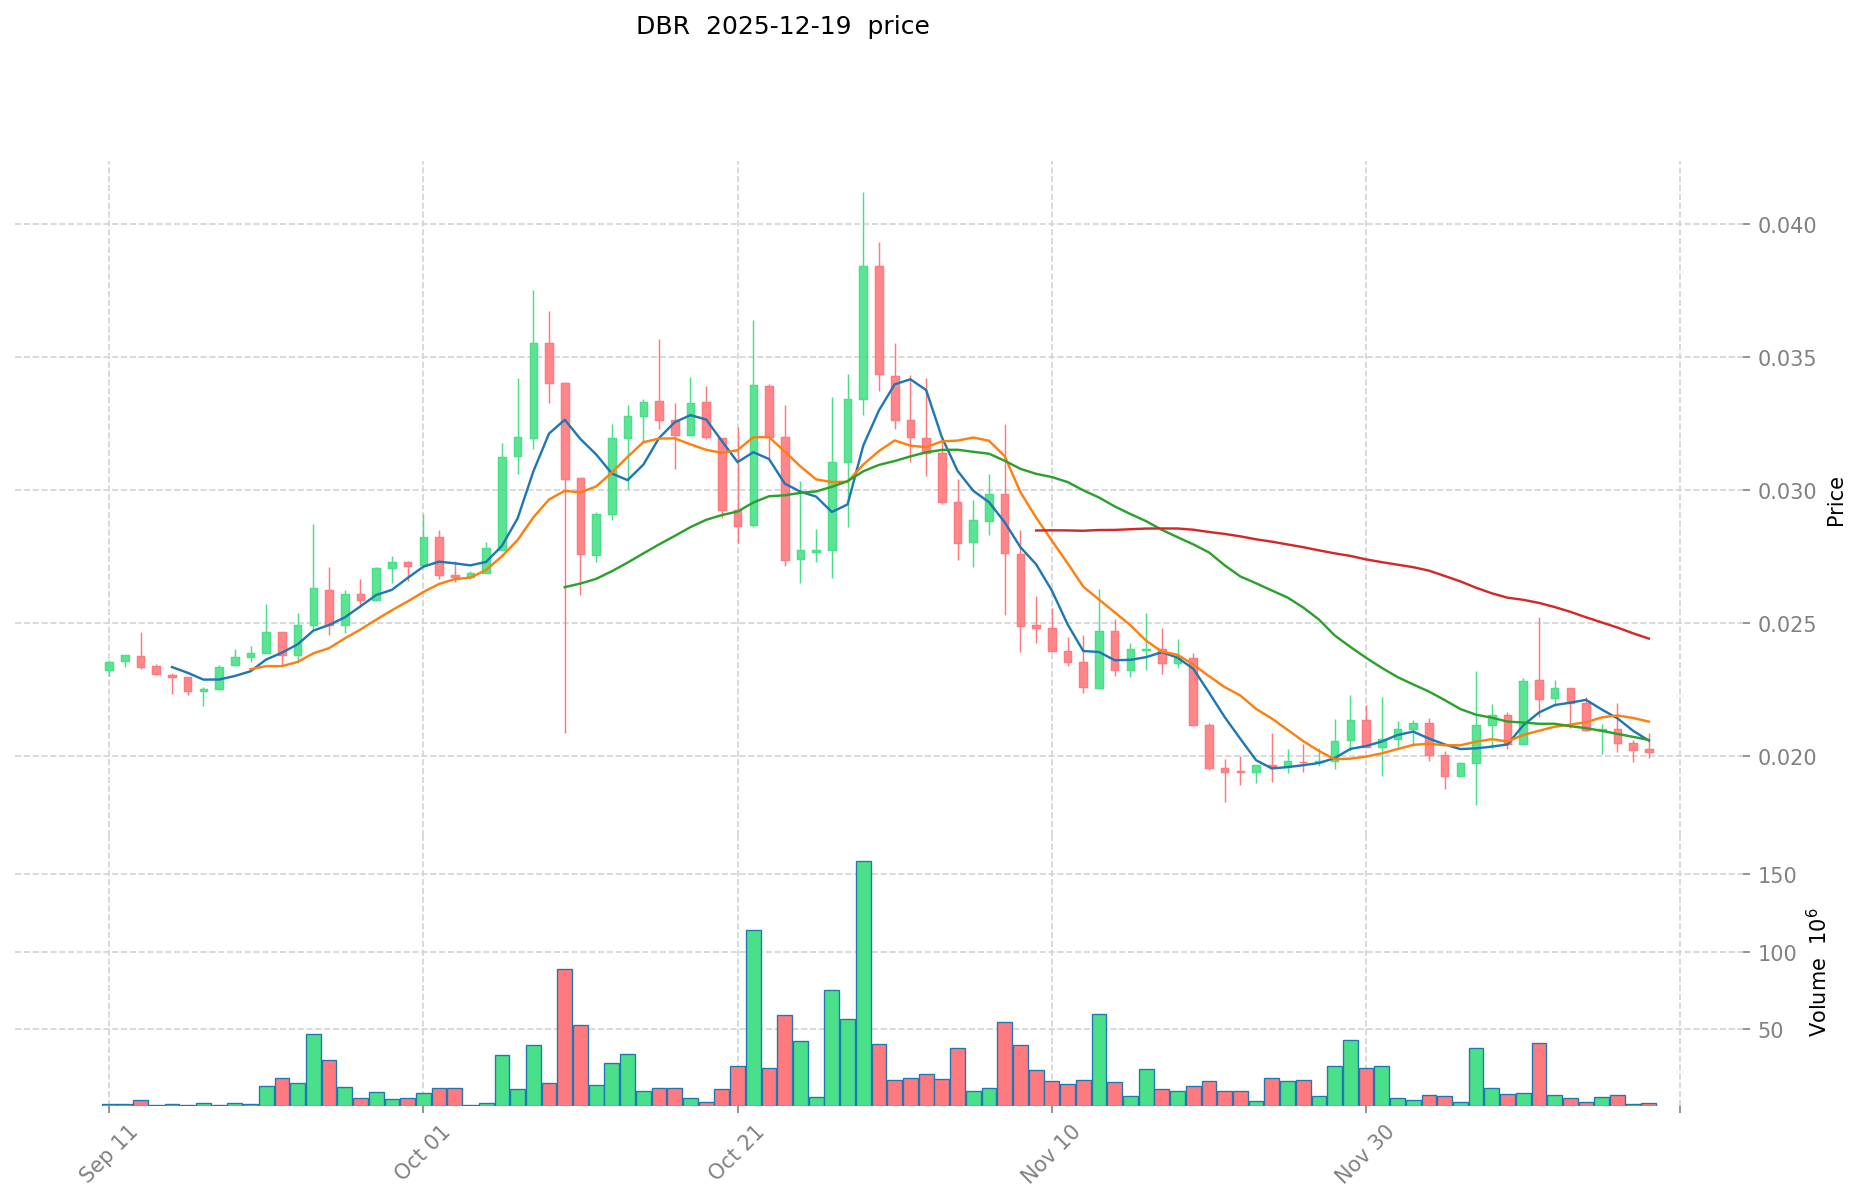
DBR Historical Price Evolution
Based on the available data, deBridge (DBR) has experienced significant volatility since its listing:
- October 17, 2024: All-time low of $0.005 was recorded, marking the lowest point in DBR's trading history
- December 22, 2024: All-time high of $0.05764 was reached, representing a peak valuation point approximately 11.5x above the historical low
- December 19, 2025: Current price stands at $0.02009, reflecting a correction from the previous highs while remaining above historical lows
DBR Current Market Position
As of December 19, 2025, deBridge demonstrates the following market characteristics:
Price Performance:
- Current Price: $0.02009
- 24-Hour Change: -0.93%
- 7-Day Change: -9.37%
- 30-Day Change: -15.16%
- Year-to-Date Change: -41.74%
Market Capitalization Metrics:
- Market Cap: $36,162,000
- Fully Diluted Valuation (FDV): $200,900,000
- Market Cap Dominance: 0.0065%
- 24-Hour Trading Volume: $46,037.80
- Token Holders: 91,422
Token Distribution:
- Circulating Supply: 1,800,000,000 DBR (18% of total supply)
- Total Supply: 10,000,000,000 DBR
- Circulating Ratio: 18%
Exchange Presence:
- DBR is trading on 25 different exchanges, facilitating liquidity and accessibility across multiple platforms
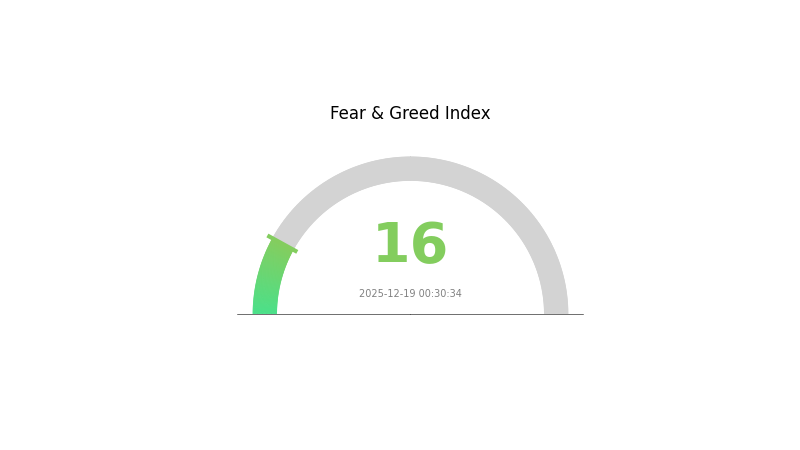
Market Sentiment:
- Current market emotion indicator reflects "Extreme Fear" (VIX level: 16), suggesting heightened risk aversion in the broader crypto market
- 24-Hour High: $0.02087
- 24-Hour Low: $0.01991
Click to view current DBR market price
DBR Market Sentiment Index
2025-12-19 Fear and Greed Index: 16 (Extreme Fear)
Click to view current Fear & Greed Index
The crypto market is experiencing extreme fear, with the Fear and Greed Index at 16. This indicates heightened pessimism and risk aversion among investors. Extreme fear periods often present contrarian opportunities, as assets may be oversold. However, caution is warranted as market uncertainty remains high. Investors should consider their risk tolerance carefully. On Gate.com, you can monitor real-time market sentiment and make informed trading decisions based on the latest index data.
DBR Holding Distribution
The address holding distribution map illustrates the concentration of DBR tokens across on-chain addresses, serving as a critical indicator of tokenomics health and decentralization levels. This metric reveals how ownership is dispersed among major holders, providing insights into potential market risks and governance dynamics.
Current analysis of DBR's holding distribution demonstrates moderate concentration characteristics. The top five addresses collectively hold 70.22% of the total supply, with the largest address (EKFy8J...DkgBio) commanding 23.00% and the second-largest (ARejja...qBRBJn) holding 16.00%. While this concentration level warrants attention, the remaining 29.78% distributed among other addresses suggests meaningful decentralization beyond the top tier. The distribution across the top five addresses shows relatively balanced holdings, with no single entity holding an overwhelming majority that would constitute severe centralization risk.
The current address distribution structure presents moderate implications for market dynamics. The substantial holdings by top addresses could theoretically exert downward pressure on prices during large-scale liquidations or transfers, yet the relatively distributed nature of secondary holdings provides some buffer against extreme manipulation. The existence of approximately 70% concentration among identifiable major holders, coupled with a dispersed "others" category representing nearly 30%, indicates a market structure that maintains reasonable resilience while retaining efficiency in governance mechanisms. This configuration reflects a balance between early adoption stakeholder interests and emerging holder participation, suggesting the protocol has progressed beyond pure founder control while maintaining structural coherence.
Click to view current DBR holding distribution
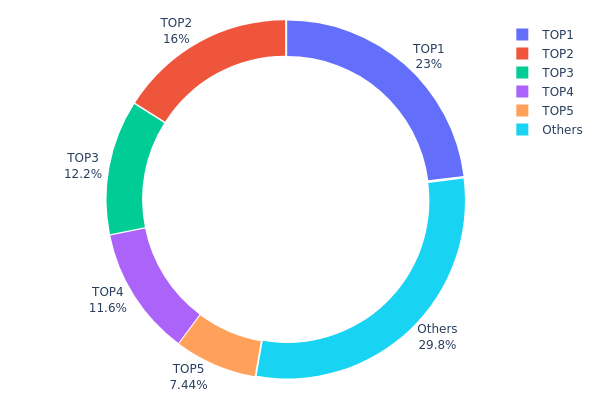
| Top | Address | Holding Qty | Holding (%) |
|---|---|---|---|
| 1 | EKFy8J...DkgBio | 2300000.00K | 23.00% |
| 2 | ARejja...qBRBJn | 1600000.00K | 16.00% |
| 3 | 4NDX7s...49WXk7 | 1215923.27K | 12.15% |
| 4 | 4BtvjB...6BKn1R | 1164945.63K | 11.64% |
| 5 | 2V7DfG...fxJfYA | 743589.74K | 7.43% |
| - | Others | 2975499.70K | 29.78% |
II. Core Factors Influencing DBR's Future Price
Market Demand and Investor Sentiment
-
Market Sentiment Dynamics: DBR has experienced significant price volatility, with strong investor confidence in certain periods followed by notable corrections. For instance, a 29.48% price decline was recorded in June 2025, reflecting shifts in market sentiment and potential changes in investor perception.
-
Price Performance Outlook: Based on a projected annual growth rate of +5%, DBR's price is anticipated to reach ¥0.1893 by 2030, representing a cumulative investment return of approximately 27.63% for investors holding positions through the end of 2030.
Macroeconomic Environment
-
Monetary Policy Impact: Global economic growth has shown signs of deceleration, with major central banks adjusting their monetary policy stances. These broader macroeconomic trends typically influence cryptocurrency market dynamics and investor risk appetite, which in turn affects DBR's price trajectory.
-
Cryptocurrency Market Trends: DBR's future price is influenced by broader cryptocurrency market trends, regulatory changes, and technological advancements within the digital asset space. Market demand for blockchain-based solutions continues to shape investor interest in cryptocurrency tokens.
III. DBR Price Forecast for 2025-2030
2025 Outlook
- Conservative Prediction: $0.01061 - $0.01500
- Neutral Prediction: $0.01500 - $0.02002
- Bullish Prediction: $0.02002 - $0.02102 (requires sustained market sentiment and increased adoption)
2026-2027 Medium-Term Outlook
- Market Stage Expectation: Gradual recovery phase with incremental growth as market participants accumulate positions and protocol utility expands
- Price Range Forecast:
- 2026: $0.01867 - $0.02647
- 2027: $0.02115 - $0.03407
- Key Catalysts: Enhanced protocol functionality, increased institutional participation, expansion of DeFi ecosystem partnerships, and broader market recovery momentum
2028-2030 Long-Term Outlook
- Base Case Scenario: $0.01842 - $0.03943 (assuming steady ecosystem development and moderate market growth)
- Bullish Case Scenario: $0.02456 - $0.04843 (assuming accelerated protocol adoption and positive macroeconomic conditions)
- Transformative Scenario: $0.02229 - $0.05406 (extreme favorable conditions including mainstream blockchain integration and significant technological breakthroughs)
- December 19, 2030: DBR potentially reaching $0.05406 (market maturation phase with +105% cumulative growth from 2025 baseline)
| 年份 | 预测最高价 | 预测平均价格 | 预测最低价 | 涨跌幅 |
|---|---|---|---|---|
| 2025 | 0.02102 | 0.02002 | 0.01061 | 0 |
| 2026 | 0.02647 | 0.02052 | 0.01867 | 2 |
| 2027 | 0.03407 | 0.0235 | 0.02115 | 16 |
| 2028 | 0.03943 | 0.02878 | 0.01842 | 43 |
| 2029 | 0.04843 | 0.03411 | 0.02456 | 69 |
| 2030 | 0.05406 | 0.04127 | 0.02229 | 105 |
deBridge (DBR) Professional Investment Strategy and Risk Management Report
I. Executive Summary
deBridge (DBR) is positioned as DeFi's internet of liquidity, facilitating real-time movement of assets and information across the DeFi ecosystem. As of December 19, 2025, DBR is trading at $0.02009 with a market capitalization of approximately $200.9 million and a 24-hour trading volume of $46,037.80. The token operates on the Solana blockchain with a total supply of 10 billion tokens, of which 1.8 billion are currently in circulation (18% circulating ratio).
Key Metrics:
- Current Price: $0.02009
- Market Cap: $200.9 million
- 24H Change: -0.93%
- 7D Change: -9.37%
- All-Time High: $0.05764 (December 22, 2024)
- All-Time Low: $0.005 (October 17, 2024)
- Market Rank: #606
II. Project Overview and Core Value Proposition
Project Definition
deBridge functions as a decentralized liquidity protocol designed to eliminate the bottlenecks and risks associated with traditional liquidity pools. The platform enables cross-chain interactions with deep liquidity, tight spreads, and guaranteed rates across the entire DeFi landscape.
Core Competitive Advantages
-
Liquidity Pool-Free Architecture: deBridge operates without centralized liquidity pool bottlenecks, reducing counterparty risk and improving capital efficiency.
-
Deep Liquidity and Tight Spreads: The protocol provides competitive pricing mechanisms that benefit traders and DeFi participants through optimized market execution.
-
Cross-Chain Interoperability: Enables seamless asset and information flow across multiple blockchain networks, supporting various cross-chain interaction types.
-
Real-Time Asset Movement: Facilitates immediate liquidity transfers across the DeFi ecosystem without traditional settlement delays.
III. deBridge (DBR) Professional Investment Strategy and Risk Management
DBR Investment Methodology
(1) Long-Term Hold Strategy
Target Investor Profile: Conservative to moderate investors with extended investment horizons (12+ months) seeking exposure to cross-chain liquidity infrastructure.
Operational Guidelines:
- Establish entry positions during periods of elevated volatility (when price drops exceed 15-20% from recent highs) to optimize cost basis
- Maintain a disciplined accumulation schedule to average entry costs, reducing the impact of short-term price fluctuations
- Secure storage through hardware wallet solutions or custody services designed specifically for institutional-grade asset protection
(2) Active Trading Strategy
Technical Analysis Tools:
- Support and Resistance Levels: Monitor critical price points at $0.01991 (24H low) and $0.02087 (24H high) for intraday reversal signals
- Volume Analysis: Track the 24-hour trading volume ($46,037.80) relative to historical averages; breakouts above 150% of average volume may signal directional conviction
Swing Trading Considerations:
- Recent 7-day decline of -9.37% suggests potential mean reversion opportunities at technical support levels
- The 30-day drawdown of -15.16% indicates sustained selling pressure; position sizing should reflect this negative momentum
- Year-to-date performance of -41.74% reflects significant correction from earlier peaks; investors should assess whether this represents fundamental challenges or cyclical oversaturation
DBR Risk Management Framework
(1) Asset Allocation Principles
Conservative Investors: 1-2% of total cryptocurrency portfolio allocation
- Rationale: DBR's position as infrastructure token #606 carries moderate liquidity risk
Moderate Investors: 2-5% of total cryptocurrency portfolio allocation
- Rationale: Supports diversification within cross-chain infrastructure theme while maintaining risk discipline
Aggressive Investors: 5-10% of total cryptocurrency portfolio allocation
- Rationale: Acceptable for investors with high-risk tolerance pursuing exposure to early-stage DeFi infrastructure protocols
(2) Risk Mitigation Strategies
- Dollar-Cost Averaging (DCA): Implement systematic purchase schedules over 12-week periods to reduce exposure to single-point volatility events
- Take-Profit Anchors: Establish predetermined exit targets at 30%, 50%, and 100% returns to systematically realize gains during rallies
- Stop-Loss Implementation: Deploy stop-loss orders at 15-20% below entry points to limit downside exposure during market corrections
(3) Secure Storage Solutions
Custody Options:
- Self-Custody via wallet Integration: Gate.com Web3 Wallet provides institutional-grade security infrastructure for SOL-based token management
- Hardware Wallet Compatibility: DBR tokens (SPL20 standard on Solana) may be stored through compatible Solana wallet solutions
- Custody Best Practices: Enable multi-signature authorization, implement address whitelisting, maintain segregated cold storage for holdings exceeding 12-month targets
Critical Security Protocols:
- Never share private keys or recovery phrases with third parties
- Verify contract addresses on official documentation (DBRiDgJAMsM95moTzJs7M9LnkGErpbv9v6CUR1DXnUu5) before token transfers
- Implement regular security audits of connected wallet infrastructure
- Avoid accessing wallets through public or unsecured internet connections
IV. deBridge (DBR) Potential Risks and Challenges
Market Risk Factors
- Liquidity Risk: Trading volume of $46,037.80 over 24 hours reflects relatively modest liquidity depth; large institutional purchases or sales could induce significant price slippage
- Market Concentration Risk: 91,422 token holders creates potential for wealth concentration among early investors; concentrated sell-offs could suppress price discovery
- Competitive Pressure: Emerging cross-chain infrastructure protocols and DEX aggregators may erode deBridge's market share and pricing power
Regulatory Risk Factors
- Classification Uncertainty: Regulatory bodies may re-classify cross-chain bridge tokens as securities, triggering compliance requirements that could restrict trading or token transfers
- Jurisdictional Restrictions: Geographic limitations on token trading and use cases could reduce addressable market and token utility
- Compliance Enforcement: Increasing regulatory scrutiny of DeFi protocols could impose operational constraints on deBridge's core functionality
Technology Risk Factors
- Smart Contract Vulnerabilities: Cross-chain bridge protocols face inherent technical complexity; unidentified vulnerabilities in code could trigger token loss or liquidity drain events
- Interoperability Complexity: Technical integration challenges across heterogeneous blockchain architectures could impede protocol scalability and performance
- Network Congestion: Solana blockchain congestion episodes could disrupt transaction finality and compromise user experience, potentially degrading platform utility
V. Conclusion and Action Recommendations
DBR Investment Value Assessment
deBridge (DBR) represents a specialized infrastructure token targeting the cross-chain liquidity segment of the DeFi ecosystem. The protocol's elimination of liquidity pool bottlenecks provides genuine technical differentiation, though commercial adoption and competitive dynamics remain uncertain. The current market valuation of $200.9 million reflects moderate market confidence, positioning DBR as a medium-risk infrastructure investment rather than a core DeFi exposure.
The year-to-date decline of -41.74% from peak valuations suggests either fundamental challenges to the business model or cyclical market overshooting. Investors should conduct thorough due diligence on protocol adoption metrics and competitive positioning before commitment.
Investment Recommendations by Investor Profile
✅ New Investors: Begin with exploratory positions (0.5-1% of crypto allocation) using dollar-cost averaging over 12-week periods; monitor protocol adoption metrics and community engagement as leading indicators of long-term viability
✅ Experienced Investors: Consider 2-5% allocations with defined entry/exit strategies based on technical support/resistance levels; maintain rebalancing discipline to prevent position drift
✅ Institutional Investors: Evaluate deBridge as component of diversified cross-chain infrastructure allocation; prioritize governance participation and protocol development oversight through formal stakeholder channels
DBR Trading Access Methods
- Centralized Exchange Trading: Access DBR through Gate.com's comprehensive trading infrastructure, which supports both spot and advanced order types (limit, stop-loss) with institutional-grade security
- Liquidity Pool Integration: Monitor direct liquidity pools on Solana-based DEX platforms for price discovery and execution optimization
- OTC Trading Facilities: Institutional investors may access over-the-counter trading channels for large block transactions, minimizing market impact
Cryptocurrency investments carry extreme risk, and this report does not constitute financial advice. Investors must evaluate DBR within the context of their complete investment portfolio and risk tolerance. Consult qualified financial advisors before commitment. Never invest capital that you cannot afford to lose completely.
FAQ
Is deBridge a good crypto?
Yes, deBridge is a reliable cross-chain bridge solution that enhances decentralized finance. It offers fast, secure transactions with an efficient and user-friendly design, making it a strong choice for DeFi users seeking seamless cross-chain connectivity.
Will dent reach 1 dollar?
Dent reaching $1 is highly unlikely. It would require over 468,000% growth, which is improbable based on current market dynamics and price projections. The token's circulating supply and market cap make this target extremely difficult to achieve.
How high could DeepBook go?
DeepBook Protocol token could potentially reach $3.41552 by 2030 based on market analysis. Price movements depend on adoption, market conditions, and ecosystem development.
How much is a dbr coin worth?
As of December 2025, a DBR coin is worth approximately $0.0207 USD. This means you could purchase around 48.23 DBR tokens with 1 USD. DBR's value fluctuates based on market conditions and trading volume.
Share
Content
Introduction: DBR's Market Position and Investment Value
I. DBR Price History Review and Current Market Status
II. Core Factors Influencing DBR's Future Price
III. DBR Price Forecast for 2025-2030
I. Executive Summary
II. Project Overview and Core Value Proposition
III. deBridge (DBR) Professional Investment Strategy and Risk Management
IV. deBridge (DBR) Potential Risks and Challenges
V. Conclusion and Action Recommendations
FAQ
How to Buy Cryptocurrency


Trending Cryptocurrencies


2025 JUP Price Prediction: Analyzing Market Trends and Potential Growth Factors for Jupiter's Native Token
2025 FIDA Price Prediction: Expert Analysis and Market Outlook for the Coming Year

2025 WET Price Prediction: Expert Analysis and Market Forecast for the Next Bull Run

Will Crypto Recover in 2025?
2025 DYDX Price Prediction: Evaluating Growth Potential and Market Factors for the Leading Derivatives Exchange Token

2025 1INCH Price Prediction: Analyzing Growth Potential and Market Trends for the DeFi Aggregator Token
What is Uniswap (UNI) price volatility analysis: support and resistance levels, historical trends, and Bitcoin correlation?

How Does Uniswap Compare to Other DEX Competitors in Market Share and Performance?
Render Token Future Insights: Can RNDR Hit $50 by 2030?

Enhancing Security in Blockchain Networks with Cryptography Techniques

Is Dymension (DYM) a good investment?: A Comprehensive Analysis of Risks, Potential Returns, and Market Positioning in 2024