This comprehensive analysis examines AIBOT's price trajectory from 2026 to 2031, providing investors with expert forecasts and strategic guidance. Starting from the current market position of $0.004526, the article reviews historical price evolution, market sentiment, and holding distribution patterns. It identifies core factors influencing AIBOT's future performance, including supply mechanisms, institutional dynamics, and ecosystem development. The analysis projects conservative to optimistic price ranges across multiple years, with 2031 potentially reaching $0.00724. Professional investment strategies encompass long-term holding and active trading approaches, supported by comprehensive risk management frameworks covering asset allocation, hedging, and secure storage solutions on Gate. The guide addresses critical risks including volatility, liquidity constraints, and regulatory uncertainties, offering tailored recommendations for beginners, experienced investors, and institutions to navigate this emerging
Introduction: AIBOT's Market Position and Investment Value
Cherry AI (AIBOT), as an AI-driven full-stack crypto ecosystem integrating advanced trading bots, web trading platforms, and community growth tools, has achieved notable traction since its launch in 2025. As of February 2026, AIBOT maintains a market capitalization of approximately $1.00 million, with a circulating supply of around 221.5 million tokens, and the price stabilized near $0.004526. This asset, recognized as an emerging player in automated crypto trading solutions, is playing an increasingly important role in facilitating AI-powered trading automation and community engagement within the crypto space.
This article will comprehensively analyze AIBOT's price trends from 2026 to 2031, combining historical patterns, market supply-demand dynamics, ecosystem development, and macroeconomic environments to provide investors with professional price forecasts and practical investment strategies.
I. AIBOT Price History Review and Market Status
AIBOT Historical Price Evolution Trajectory
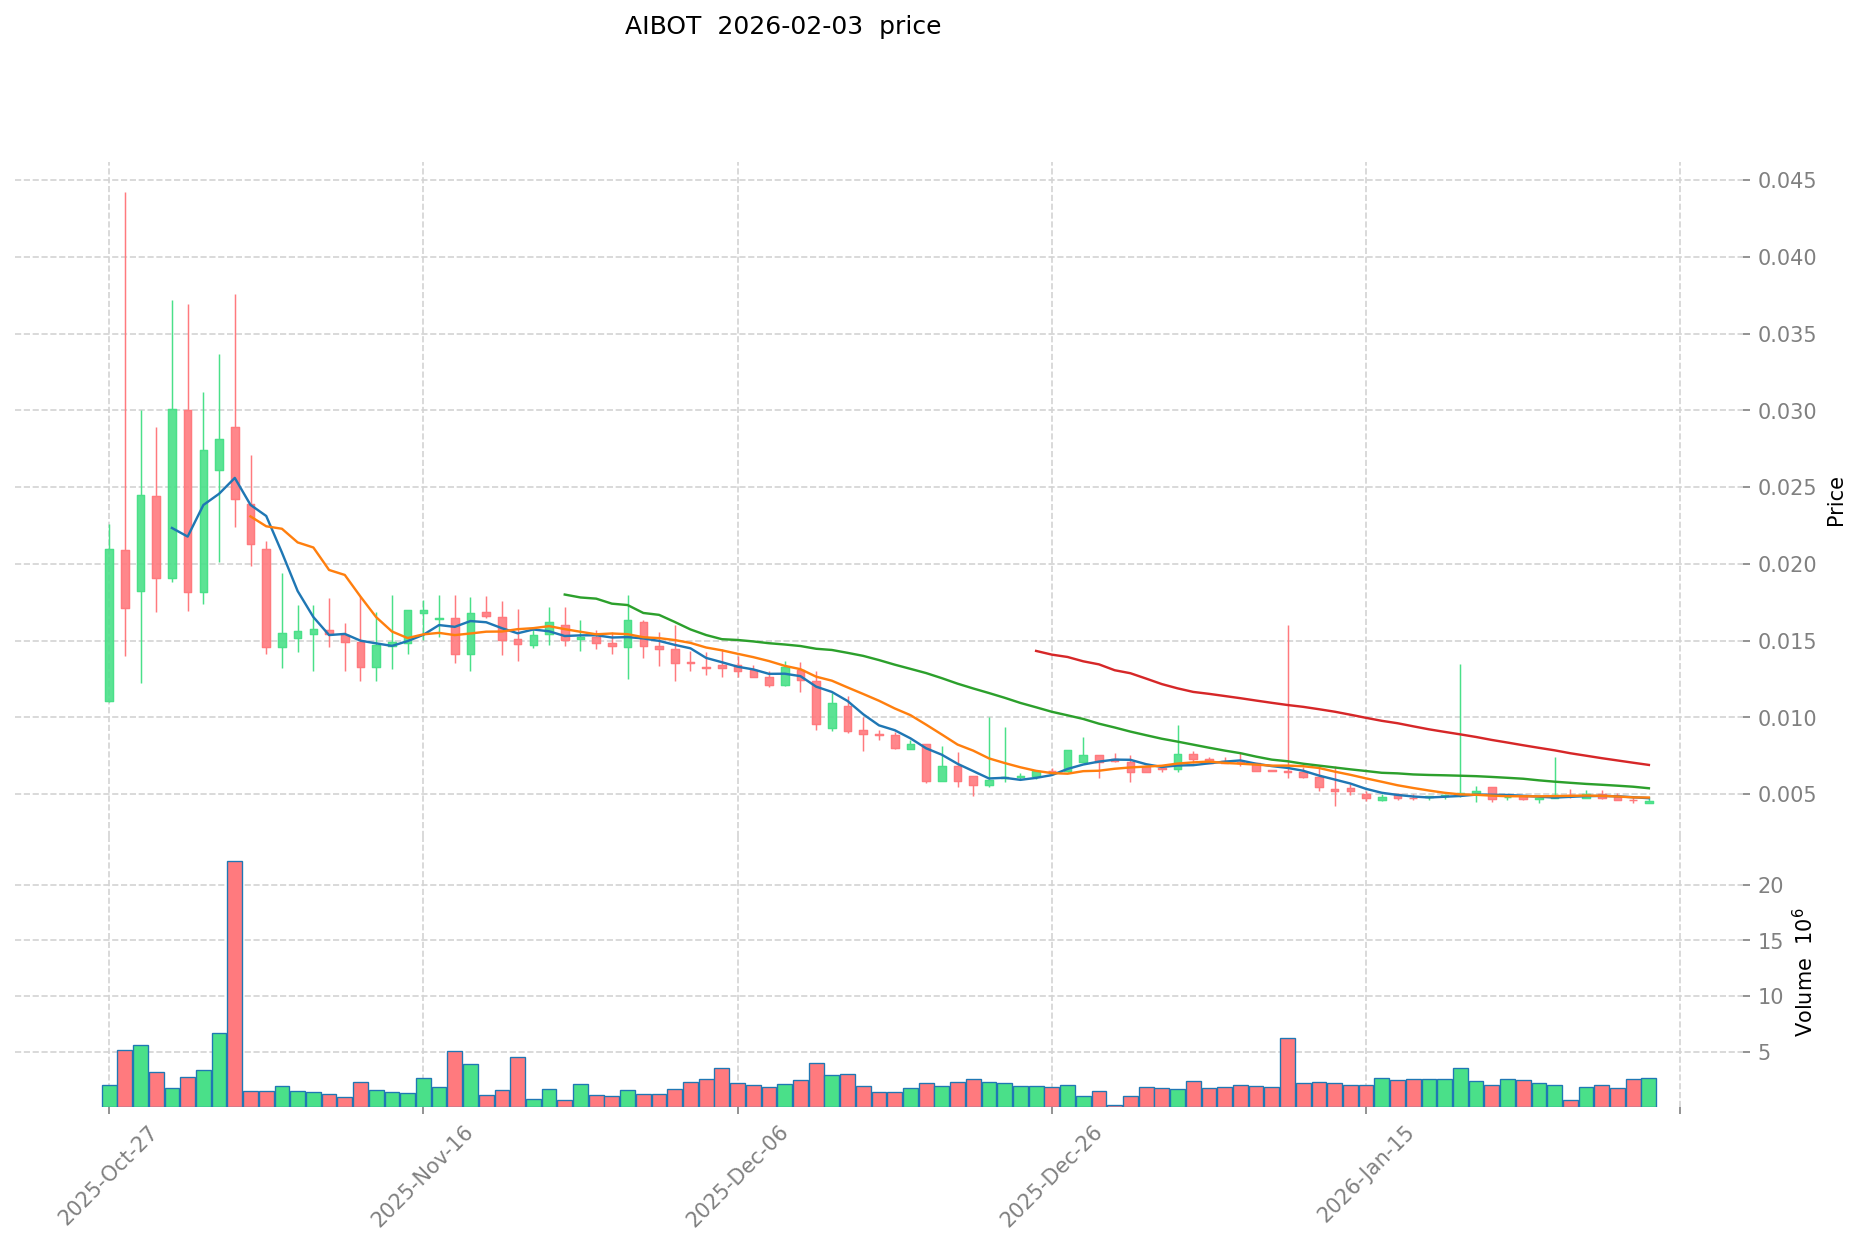
- 2025: AIBOT launched in September 2025 with a publish price of $0.05, reaching an all-time low of $0.0032 on September 25, 2025, representing a decline of approximately 93.6% from launch price
- 2025: Price recovered significantly in Q4 2025, reaching an all-time high of $0.0442 on October 28, 2025, marking a notable rebound from the September lows
- 2025-2026: Following the October peak, AIBOT entered a corrective phase, with price declining by 89.76% from the all-time high to the current level of $0.004526 as of February 3, 2026
AIBOT Current Market Status
As of February 3, 2026, AIBOT is trading at $0.004526, showing mixed short-term performance with a 0.77% increase over the past 24 hours and a 24-hour trading range between $0.004491 and $0.004714. The hourly chart indicates a slight pullback of 0.45% from recent levels.
The medium-term trajectory remains under pressure, with AIBOT declining 10.52% over the past week and 36.71% over the past 30 days. The annual performance shows a substantial contraction of 98.93% from year-ago levels, reflecting the volatile nature of AI-focused crypto assets.
AIBOT maintains a market capitalization of approximately $1.00 million with 221.5 million tokens in circulation, representing 22.15% of the total supply of 1 billion tokens. The fully diluted market cap stands at $4.53 million. Daily trading volume registers at $12,191, with the token currently ranking around #2500 in the cryptocurrency market.
The project has built operational traction with partnerships including Meteora, LDA/QuickSWAP, and Bitcoin OS, while reporting metrics such as 10 million+ game users, 1 million+ raids executed, and $150 million+ in simulated trading volume. AIBOT's holder base comprises 3,509 addresses on the BSC network.
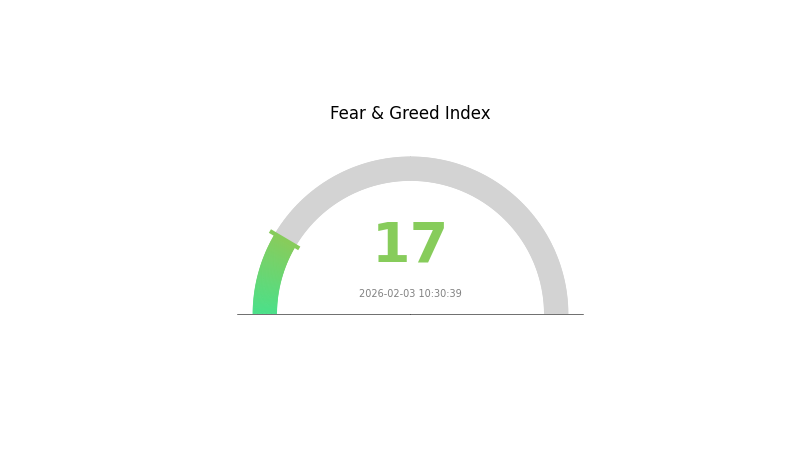
The current market sentiment index reflects extreme fear at a level of 17, indicating cautious positioning across the broader cryptocurrency market. AIBOT's market dominance stands at 0.00016%, with the circulating supply representing 22.15% of the fully diluted valuation.
Click to view the current AIBOT market price
AIBOT Market Sentiment Index
2026-02-03 Fear and Greed Index: 17 (Extreme Fear)
Click to view current Fear & Greed Index
The cryptocurrency market is currently experiencing extreme fear, with the Fear and Greed Index plummeting to 17. This historically low reading indicates widespread panic and pessimistic sentiment among investors. Market participants are showing strong risk aversion, with significant selling pressure dominating trading activity. Such extreme fear levels often create contrarian opportunities for long-term investors, as panic-driven price declines may present attractive entry points. Traders should remain cautious and consider their risk tolerance carefully during this volatile period. On Gate.com, you can monitor real-time market sentiment and adjust your investment strategy accordingly.
AIBOT Holding Distribution
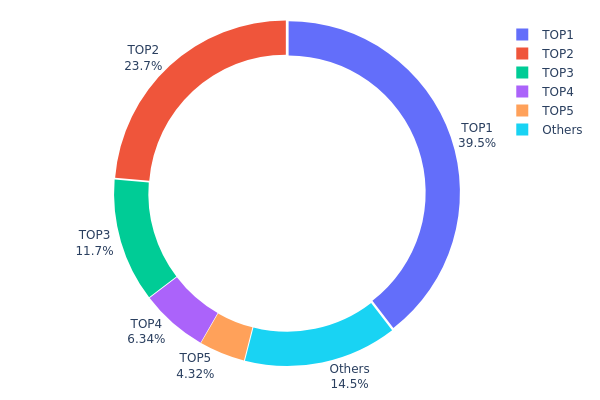
The holding distribution chart visualizes the concentration of token ownership across different wallet addresses, providing crucial insights into the decentralization level and potential market manipulation risks. By analyzing the percentage of total supply held by top addresses, investors can assess the structural stability of the token's on-chain ecosystem.
According to the current data, AIBOT exhibits a highly concentrated holding pattern. The top address controls 395,263.21K tokens, representing 39.52% of the total supply, while the second-largest holder possesses 237,089.42K tokens (23.70%). Combined, the top two addresses hold 63.22% of the circulating supply, indicating significant centralization. The top five addresses collectively control 85.51% of tokens, leaving only 14.49% distributed among other market participants.
This extreme concentration poses considerable risks to market stability. Large holders, commonly known as "whales," possess substantial influence over price movements through their trading activities. A single major sell-off from top addresses could trigger sharp price declines and cascading liquidations. Furthermore, such centralized distribution increases susceptibility to coordinated market manipulation, as a small group of entities effectively controls the token's liquidity and price discovery mechanism. The limited distribution beyond the top holders suggests weak community participation and raises concerns about the project's genuine decentralization commitment.
Click to view current AIBOT Holding Distribution
| Top |
Address |
Holding Qty |
Holding (%) |
| 1 |
0x73d8...4946db |
395263.21K |
39.52% |
| 2 |
0xd7b5...61eb33 |
237089.42K |
23.70% |
| 3 |
0x4982...6e89cb |
116556.31K |
11.65% |
| 4 |
0x9ba0...3c4556 |
63349.51K |
6.33% |
| 5 |
0xd377...b0d255 |
43186.17K |
4.31% |
| - |
Others |
144545.43K |
14.49% |
II. Core Factors Influencing AIBOT's Future Price
Supply Mechanism
- Fixed Supply Model: AIBOT maintains a constant total supply, creating scarcity attributes that influence price performance as demand fluctuates.
- Historical Pattern: The fixed supply structure has established a foundation for potential value appreciation during periods of increased market demand.
- Current Impact: The unchanging supply mechanism may support price stability and growth as market adoption expands.
Institutional and Large Holder Dynamics
- Enterprise Integration: Multiple AI technology companies have expressed interest in integrating AIBOT into their operational frameworks.
- Market Demand Trends: Institutional participation and adoption patterns continue to shape the token's market positioning.
- Investment Sentiment: Investor confidence and market perception play a direct role in AIBOT's price trajectory.
Macroeconomic Environment
- Alternative Asset Demand: During periods of inflation or currency weakness, investors may seek alternative assets like AIBOT, potentially increasing demand and supporting price levels.
- Global Economic Factors: Broader economic conditions, including interest rates and GDP performance, indirectly influence market dynamics for digital assets.
Technical Development and Ecosystem Building
- AI-Powered Trading Solutions: The development and effectiveness of AI trading tools in real market environments represent key factors in determining AIBOT's value trajectory.
- Smart Contract Security: Audit results indicating low risk contribute to ecosystem confidence and long-term sustainability.
- Token Economics Implementation: The actual execution and performance of the token economic model will influence market perception and adoption rates.
III. 2026-2031 AIBOT Price Prediction
2026 Outlook
- Conservative prediction: $0.00382 - $0.00449
- Neutral prediction: Around $0.00449
- Optimistic prediction: Up to $0.00548 (requires favorable market conditions)
2027-2029 Outlook
- Market stage expectation: Gradual stabilization and moderate growth phase, with the market potentially entering a period of steady development
- Price range prediction:
- 2027: $0.00289 - $0.00528
- 2028: $0.00380 - $0.00534
- 2029: $0.00403 - $0.00545
- Key catalysts: Market adoption expansion, potential ecosystem development, and broader crypto market sentiment
2030-2031 Long-term Outlook
- Baseline scenario: $0.00449 - $0.00534 (assuming continued market development)
- Optimistic scenario: $0.00534 - $0.00759 (assuming strong ecosystem growth and increased adoption)
- Transformative scenario: Potential to reach $0.00759 (under highly favorable conditions including significant technological breakthroughs and widespread market acceptance)
- 2031-12-31: AIBOT could potentially trade within $0.00472 - $0.00724 range (representing a 42% increase from the 2026 baseline)
| Year |
Predicted High Price |
Predicted Average Price |
Predicted Low Price |
Price Change |
| 2026 |
0.00548 |
0.00449 |
0.00382 |
0 |
| 2027 |
0.00528 |
0.00499 |
0.00289 |
10 |
| 2028 |
0.00534 |
0.00513 |
0.0038 |
13 |
| 2029 |
0.00545 |
0.00524 |
0.00403 |
15 |
| 2030 |
0.00759 |
0.00534 |
0.00449 |
18 |
| 2031 |
0.00724 |
0.00646 |
0.00472 |
42 |
IV. AIBOT Professional Investment Strategies and Risk Management
AIBOT Investment Methodology
(1) Long-Term Holding Strategy
- Suitable for: Investors who believe in AI-driven trading solutions and are willing to hold through market volatility
- Operational recommendations:
- Consider accumulating positions during market corrections when the price approaches support levels
- Monitor project development milestones, including partnerships and user growth metrics
- Implement a diversified storage approach using Gate Web3 Wallet for convenient access and hardware solutions for long-term holdings
(2) Active Trading Strategy
- Technical analysis tools:
- Volume analysis: Monitor the 24-hour trading volume of approximately $12,191 to identify unusual activity patterns
- Support and resistance levels: Track key price zones, with current historical low at $0.0032 and high at $0.0442
- Swing trading considerations:
- The token has shown significant volatility, with a 7-day decline of 10.52% and 30-day decline of 36.71%
- Entry points may be considered near support levels with appropriate stop-loss orders
AIBOT Risk Management Framework
(1) Asset Allocation Principles
- Conservative investors: 1-2% of crypto portfolio
- Aggressive investors: 3-5% of crypto portfolio
- Professional investors: Up to 5-8% with active monitoring
(2) Risk Hedging Approaches
- Portfolio diversification: Maintain exposure across multiple crypto assets to reduce concentration risk
- Position sizing: Use scaled entry and exit strategies rather than all-in positions
(3) Secure Storage Solutions
- Hot wallet recommendation: Gate Web3 Wallet for active trading and quick access
- Cold storage approach: Hardware wallet solutions for long-term holdings exceeding immediate trading needs
- Security considerations: Never share private keys, enable two-factor authentication, and regularly verify wallet addresses before transactions
V. AIBOT Potential Risks and Challenges
AIBOT Market Risks
- High volatility: The token has experienced a 98.93% decline over one year, indicating substantial price fluctuation potential
- Limited liquidity: With a 24-hour trading volume of approximately $12,191, liquidity may be constrained during large transactions
- Market sentiment dependency: As an AI-driven trading tool, adoption rates may fluctuate based on broader market conditions and investor interest in automation solutions
AIBOT Regulatory Risks
- Evolving compliance landscape: AI-driven trading tools may face increased scrutiny as regulators develop frameworks for automated trading systems
- Cross-border regulatory variations: Different jurisdictions may impose varying requirements on AI trading platforms and associated tokens
- Token classification uncertainty: The regulatory status of utility tokens supporting trading bots remains subject to ongoing interpretation
AIBOT Technical Risks
- Smart contract vulnerabilities: The token operates on BSC (BEP-20 standard), which carries inherent smart contract execution risks
- Platform dependency: Value is closely tied to the continued development and adoption of Cherry AI's trading bot ecosystem
- Competition intensity: The AI trading tools sector faces increasing competition from established and emerging platforms
VI. Conclusion and Action Recommendations
AIBOT Investment Value Assessment
Cherry AI presents an interesting proposition in the AI-driven trading tools sector, with partnerships including Meteora, LDA/QuickSWAP, and bitcoin OS, and claimed metrics of 10M+ game users and $150M+ simulated trading volume. However, the token has experienced significant price depreciation, declining 98.93% from its launch price of $0.05. The current market capitalization of approximately $1 million and limited exchange listings (5 exchanges) suggest early-stage development. While the project addresses real needs in automated crypto trading, investors should weigh the substantial historical volatility against the potential for ecosystem growth.
AIBOT Investment Recommendations
✅ Beginners: Exercise extreme caution; if interested, allocate no more than 1% of crypto portfolio and focus on understanding the underlying technology and use cases before investing
✅ Experienced investors: Consider small exploratory positions with strict risk management protocols; monitor project milestones and user adoption metrics closely
✅ Institutional investors: Conduct thorough due diligence on platform security, partnerships, and competitive positioning; consider pilot allocations with comprehensive risk assessment frameworks
AIBOT Trading Participation Methods
- Spot trading: Available on Gate.com and 4 other exchanges for direct purchase and sale
- Dollar-cost averaging: Systematic periodic purchases to mitigate timing risk in volatile markets
- Limit orders: Use limit orders to target specific entry and exit price levels rather than market orders in low-liquidity conditions
Cryptocurrency investment carries extremely high risks, and this article does not constitute investment advice. Investors should make prudent decisions based on their own risk tolerance and are advised to consult professional financial advisors. Never invest more than you can afford to lose.
FAQ
What is AIBOT? What are its core functions and purposes?
AIBOT is an intelligent home appliance brand specializing in hard floor cleaning. Its core products include smart floor sweeping robots and floor washers, designed to automatically clean and maintain floors efficiently.
AIBOT token is currently priced at US$0.005157. Over the past 24 hours, the price increased 4.71%, while the 7-day performance shows a 0.34% gain. Trading volume reached US$1,103,053 in 24-hour transactions.
AIBOT Price Prediction: What is the possible price trend for the next 3 months, 6 months, and 1 year?
AIBOT is expected to show moderate growth over the next three months with consolidation. By six months, upward momentum should accelerate as AI robotics adoption increases. Within one year, AIBOT could experience significant appreciation driven by growing market demand for AI-driven solutions and ecosystem expansion.
What are the main factors affecting AIBOT price?
AIBOT price is primarily driven by market sentiment, investor confidence, trading volume, technological breakthroughs, and adoption demand. Major developments in AI technology and ecosystem expansion significantly influence price movements.
AIBOT excels in AI-driven trading automation and advanced analysis tools with specialized capabilities. However, it may have narrower ecosystem integration compared to broader AI tokens, potentially limiting wider adoption and use cases.
What risks should I pay attention to when investing in AIBOT?
When investing in AIBOT, monitor technical risks including software glitches and network vulnerabilities that could affect trading execution. Market volatility and liquidity fluctuations may impact price movements. Ensure secure account management to protect assets from security threats.
What is the technical team and project background of AIBOT? Is it trustworthy?
AIBOT is developed by Cherry AI with a strong technical team experienced in artificial intelligence and blockchain technology. The project combines advanced AI conversational interfaces with crypto applications, demonstrating solid fundamentals and community recognition in the Web3 space.
What is the market liquidity and trading volume of AIBOT? On which exchanges can it be traded?
AIBOT maintains strong liquidity with a pool size of $439,200 and 467 active holders. The token features zero-tax trading on both buys and sells, minimizing transaction friction. AIBOT is primarily traded on major decentralized and centralized platforms with consistent daily trading activity and stable market depth.
* The information is not intended to be and does not constitute financial advice or any other recommendation of any sort offered or endorsed by Gate.