2026 ART Price Prediction: Expert Analysis and Market Forecast for the Coming Year
Introduction: ART's Market Position and Investment Value
LiveArt (ART), as an AI-powered RWAfi protocol unlocking the investment-grade art, watches, cars, wine, and collectibles market, has been deployed across 17 blockchains since its launch in 2025. As of February 2026, ART maintains a market capitalization of approximately $166,205, with a circulating supply of around 356 million tokens, and the price holding at $0.0004668. This asset, recognized as a bridge between cultural wealth and DeFi liquidity, is playing an increasingly vital role in tokenizing real-world assets and making them accessible as yield-generating financial products.
This article will comprehensively analyze ART's price trajectory from 2026 to 2031, combining historical patterns, market supply and demand dynamics, ecosystem development, and macroeconomic conditions to provide investors with professional price forecasts and practical investment strategies.
I. ART Price History Review and Current Market Status
ART Historical Price Evolution Trajectory
- 2025 September: ART reached a notable price level of $0.099, marking a significant milestone in its early trading history
- 2025 December: The token experienced considerable downward pressure, declining to $0.0003175, reflecting broader market correction patterns
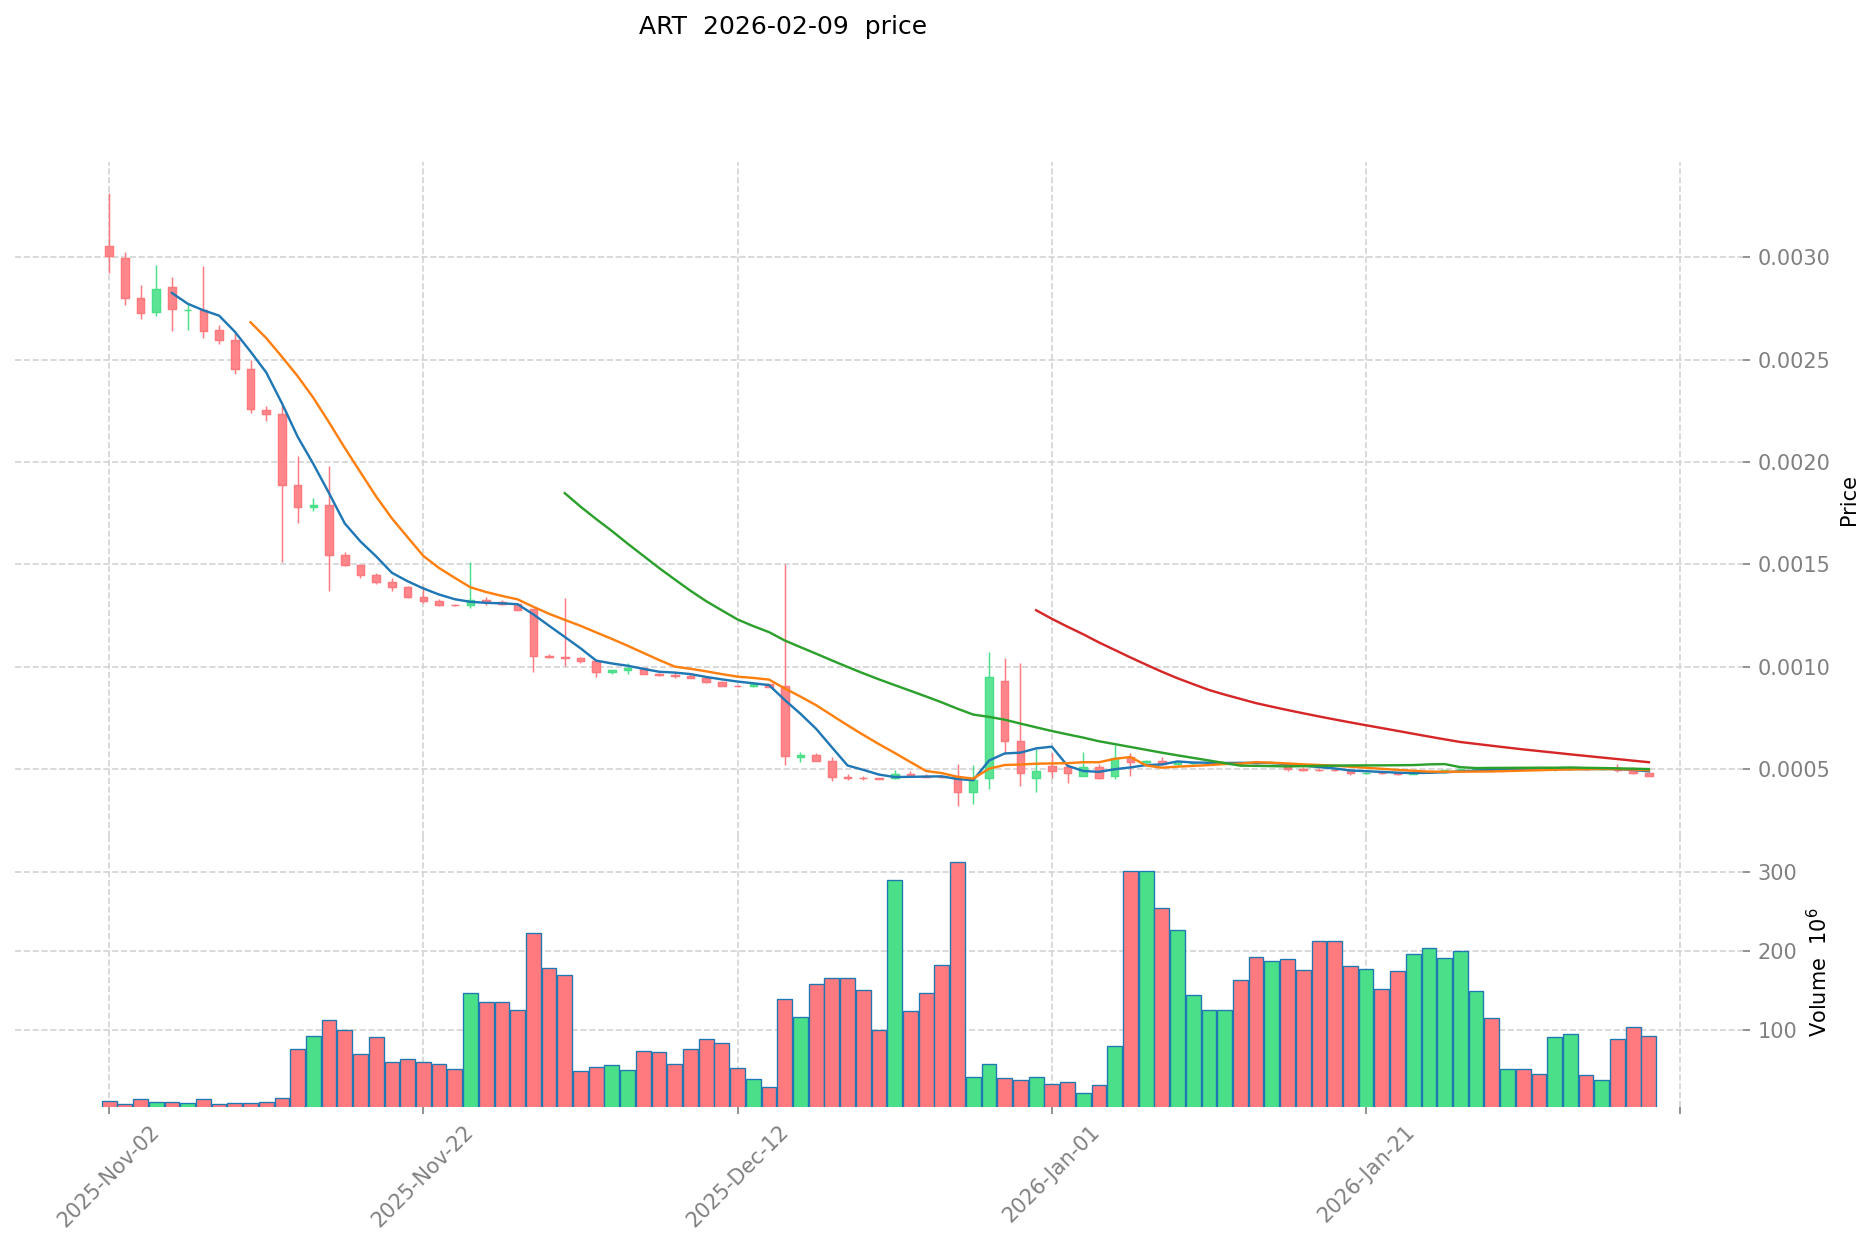
- 2026 Early February: Price stabilized around the $0.0004668 level with moderate trading activity across multiple blockchain deployments
ART Current Market Dynamics
As of February 9, 2026, ART is trading at $0.0004668, reflecting a 24-hour decline of 2.15%. The token demonstrates short-term volatility with a 1-hour gain of 0.24%, while exhibiting broader downward trends over the 7-day period (-6.37%) and 30-day window (-11.63%).
The market shows a 24-hour trading volume of $45,358.38, with price fluctuations ranging between $0.0004663 (low) and $0.0004793 (high). The circulating supply stands at 356,052,795.66 ART tokens, representing approximately 31.83% of the maximum supply of 1 billion tokens. The current market capitalization reaches $166,205.45, while the fully diluted valuation is positioned at $466,800.
LiveArt operates as an AI-powered RWAfi protocol targeting the investment-grade art, watches, cars, wine, and collectibles market. The platform has established connections with over 13 million wallets and maintains deployment across 17 blockchain networks. With a reported asset pipeline exceeding $200 million, the protocol aims to transform blue-chip physical assets into liquid, programmable financial instruments accessible on-chain.
The token holder base comprises 36,793 addresses, indicating a distributed ownership structure. Market sentiment indicators suggest a cautious environment, with the broader crypto market fear and greed index registering 14, classified as extreme fear territory. ART maintains a market dominance of 0.000018%, positioning it within the emerging token category with presence on 5 exchanges.
Click to view current ART market price
ART Market Sentiment Indicator
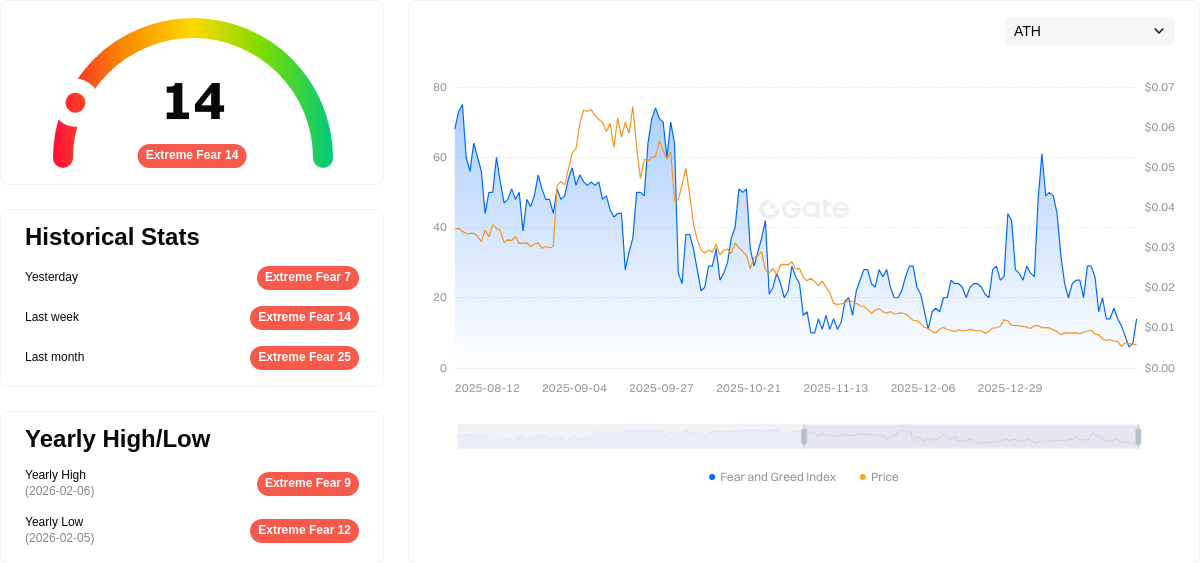
2026-02-09 Fear & Greed Index: 14 (Extreme Fear)
Click to view current Fear & Greed Index
The ART market is currently experiencing extreme fear, with the Fear & Greed Index standing at just 14 points. This indicates severe market pessimism and heightened investor anxiety. When fear reaches such extreme levels, it often presents contrarian opportunities for long-term investors who can tolerate volatility. Market participants should exercise caution while considering that extreme fear episodes historically tend to precede market recoveries. Diversification and risk management remain essential during periods of pronounced market stress.
ART Holding Distribution
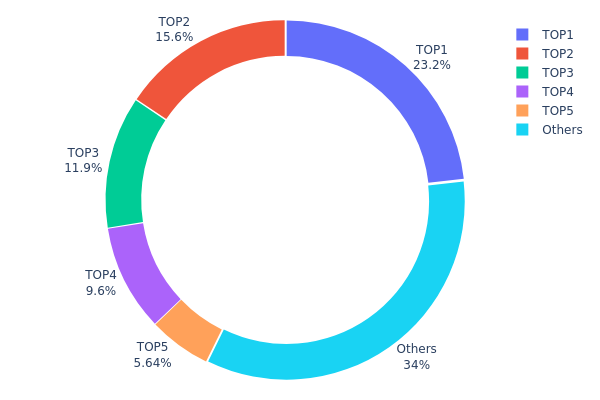
The holding distribution chart represents the concentration of token ownership across different wallet addresses, serving as a critical metric to assess the decentralization level and potential market manipulation risks of a cryptocurrency project. By analyzing the proportion of tokens held by top addresses versus the broader market, investors can gauge the health of the token's distribution structure and identify potential centralization concerns that may impact price stability.
Based on the current data, ART exhibits a moderately concentrated holding pattern. The top five addresses collectively control approximately 65.95% of the total token supply, with the largest single address holding 23.22% (223.33M tokens). Notably, the second and third largest holders possess 15.59% and 11.91% respectively, while addresses ranked fourth and fifth hold 9.60% and 5.63%. The remaining 34.05% is distributed among other addresses, indicating a relatively limited dispersion beyond the major holders.
This concentration level presents both structural advantages and potential vulnerabilities for ART's market dynamics. On one hand, the presence of significant holders may suggest strong institutional backing or strategic reserves that could provide price support during market downturns. On the other hand, such concentration creates potential risks for sudden price volatility if major holders decide to liquidate their positions. The fact that over two-thirds of the supply is controlled by just five addresses means that coordinated actions by these entities could significantly influence market sentiment and price movements. For investors considering ART exposure, monitoring changes in this distribution pattern becomes essential, as any substantial shifts in major holder positions could signal important market developments or potential selling pressure ahead.
Click to view current ART Holding Distribution
| Top | Address | Holding Qty | Holding (%) |
|---|---|---|---|
| 1 | 0xbe58...6e389e | 223330.00K | 23.22% |
| 2 | 0x61bf...789694 | 150000.00K | 15.59% |
| 3 | 0x4e3a...a31b60 | 114599.26K | 11.91% |
| 4 | 0x18b0...281e9f | 92343.42K | 9.60% |
| 5 | 0x19f7...6b7ea1 | 54191.21K | 5.63% |
| - | Others | 327199.72K | 34.05% |
II. Core Factors Influencing ART's Future Price Trends
Supply Mechanism
-
Staking and Lock-up Mechanism: As the ecosystem expands and more assets are tokenized and traded in the secondary market, the implementation of staking and lock-up mechanisms is expected to increase the demand for ART while enhancing its scarcity.
-
Historical Patterns: In traditional art markets, supply constraints have consistently driven price appreciation. When masterpieces by renowned artists become scarce in circulation, auction prices tend to reach new highs. The supply reduction of classic works has historically resulted in significant value increases in secondary markets.
-
Current Impact Expectation: As the platform develops and more digital art assets become tokenized, the growing adoption of lock-up mechanisms is anticipated to reduce circulating supply, potentially creating upward pressure on ART's valuation.
Institutional and Major Holder Dynamics
The provided materials do not contain specific information regarding institutional holdings, enterprise adoption, or national-level policies related to ART. Therefore, this section is omitted from the analysis.
Macroeconomic Environment
-
Monetary Policy Impact: Economic growth and shifts in global wealth distribution significantly influence the art market. Historical data shows that when per capita GDP exceeds certain thresholds, art market activity intensifies, with prices rising accordingly. The correlation between economic prosperity and high-end art valuations suggests that favorable monetary conditions and wealth accumulation tend to support asset appreciation.
-
Inflation Hedge Characteristics: Art assets have traditionally served as stores of value during periods of economic uncertainty. High-net-worth individuals often allocate capital to art during inflationary periods, viewing it as a tangible asset that can preserve purchasing power.
-
Geopolitical Factors: The global art market has experienced significant volatility due to complex geopolitical and economic conditions. Uncertainty in international relations has led to more cautious behavior among buyers in high-end market segments, affecting transaction volumes and pricing dynamics.
Technical Development and Ecosystem Building
The provided materials do not contain specific information regarding technical upgrades, development roadmaps, or ecosystem applications for the ART project. Therefore, this section is omitted from the analysis.
III. 2026-2031 ART Price Forecast
2026 Outlook
- Conservative forecast: $0.00024 - $0.00047
- Neutral forecast: $0.00047 (average)
- Optimistic forecast: $0.00068 (requires favorable market conditions)
2027-2029 Mid-term Outlook
- Market stage expectations: The token may experience gradual growth momentum as the market matures and adoption potentially expands
- Price range forecasts:
- 2027: $0.00056 - $0.00078, with an estimated 23% increase
- 2028: $0.00066 - $0.00080, with a projected 45% cumulative increase
- 2029: $0.00063 - $0.00078, with anticipated 58% growth from baseline
- Key catalysts: Market adoption trends, ecosystem development progress, and broader cryptocurrency market sentiment
2030-2031 Long-term Outlook
- Baseline scenario: $0.00048 - $0.00076 in 2030 (assuming steady market conditions)
- Optimistic scenario: $0.00113 in 2030 (with enhanced adoption and favorable market dynamics)
- Growth trajectory: The 2031 forecast suggests potential price range of $0.00053 - $0.00106, representing approximately 101% cumulative increase, contingent upon sustained ecosystem development and market expansion
- February 9, 2026: ART trades within the early-stage price discovery phase as the market evaluates long-term potential
| Year | Predicted High Price | Predicted Average Price | Predicted Low Price | Price Change |
|---|---|---|---|---|
| 2026 | 0.00068 | 0.00047 | 0.00024 | 0 |
| 2027 | 0.00078 | 0.00058 | 0.00056 | 23 |
| 2028 | 0.0008 | 0.00068 | 0.00066 | 45 |
| 2029 | 0.00078 | 0.00074 | 0.00063 | 58 |
| 2030 | 0.00113 | 0.00076 | 0.00048 | 62 |
| 2031 | 0.00106 | 0.00094 | 0.00053 | 101 |
IV. ART Professional Investment Strategy and Risk Management
ART Investment Methodology
(1) Long-term Holding Strategy
- Suitable for: Investors interested in Real World Asset (RWA) innovation and alternative investment opportunities
- Operational recommendations:
- Consider dollar-cost averaging to mitigate volatility risk given the token's early stage development
- Monitor the platform's asset pipeline progress and the expansion of its $200M+ asset portfolio
- Utilize Gate Web3 Wallet for secure storage and seamless interaction with the LiveArt ecosystem across its 17-chain deployment
(2) Active Trading Strategy
- Technical analysis tools:
- Volume analysis: Track the 24-hour trading volume ($45,358.38 as of February 9, 2026) to identify liquidity trends
- Support and resistance levels: Monitor the 24-hour range between $0.0004663 and $0.0004793 to identify potential entry and exit points
- Swing trading considerations:
- Be aware of short-term volatility, with recent 24-hour decline of 2.15% and 7-day decline of 6.37%
- Consider the token's historical price movements, noting the distance from previous peak levels
ART Risk Management Framework
(1) Asset Allocation Principles
- Conservative investors: 1-3% of crypto portfolio allocation
- Aggressive investors: 3-7% of crypto portfolio allocation
- Professional investors: Up to 10% with active monitoring and rebalancing
(2) Risk Hedging Solutions
- Diversification approach: Balance ART holdings with established RWA tokens and traditional DeFi assets
- Position sizing: Limit initial exposure while the protocol establishes operational track record
(3) Secure Storage Solutions
- Multi-chain wallet recommended: Gate Web3 Wallet supports BASE chain integration
- Cold storage option: For larger holdings, consider hardware wallet solutions compatible with BASE network
- Security precautions: Enable two-factor authentication, verify contract address (0x4dec3139f4a6c638e26452d32181fe87a7530805 on BASE), and never share private keys
V. ART Potential Risks and Challenges
ART Market Risks
- Liquidity constraints: With a circulating market cap of approximately $166,205.45, the token may experience significant price volatility during large transactions
- Price volatility: Recent performance shows 11.63% decline over 30 days, reflecting early-stage market uncertainty
- Competition: The RWA tokenization space is becoming increasingly competitive, which may impact market share and adoption rates
ART Regulatory Risks
- RWA tokenization framework: Evolving regulations around real-world asset tokenization may affect operational models
- Cross-jurisdictional compliance: Operating across 17 blockchains may introduce complex regulatory requirements in different territories
- Securities classification: Investment-grade asset tokenization may face scrutiny regarding securities laws in various jurisdictions
ART Technical Risks
- Smart contract vulnerabilities: As with any blockchain protocol, potential security risks exist in smart contract implementations
- Multi-chain complexity: Deployment across 17 chains introduces technical coordination challenges and potential bridge security concerns
- Integration dependencies: The platform's reliance on AI-powered systems and external asset valuation mechanisms creates technical interdependencies
VI. Conclusion and Action Recommendations
ART Investment Value Assessment
LiveArt (ART) presents an innovative approach to democratizing access to investment-grade collectibles through blockchain technology. With a substantial asset pipeline and multi-chain presence, the project addresses a considerable market opportunity in the RWA space. However, investors should carefully weigh the early-stage nature of the project, limited current liquidity, and recent price decline trends against its long-term value proposition of bridging traditional alternative assets with DeFi infrastructure.
ART Investment Recommendations
✅ Beginners: Start with minimal allocation (1-2% of crypto portfolio) and prioritize education about RWA protocols before increasing position size ✅ Experienced investors: Consider strategic entry points during consolidation phases, while monitoring platform milestone achievements and asset onboarding progress ✅ Institutional investors: Conduct thorough due diligence on underlying asset custody arrangements, legal structure, and tokenomics model before committing significant capital
ART Trading Participation Methods
- Spot trading: ART is available on 5 exchanges including Gate.com, allowing direct purchase with various trading pairs
- DeFi interaction: Engage with the LiveArt protocol directly through Gate Web3 Wallet on BASE network
- Portfolio tracking: Monitor holdings and performance metrics through Gate.com's comprehensive analytics tools
Cryptocurrency investment carries extreme risk, and this article does not constitute investment advice. Investors should make prudent decisions based on their own risk tolerance and are advised to consult professional financial advisors. Never invest more than you can afford to lose.
FAQ
How to predict art price trends?
Analyze historical transaction data and market sentiment using statistical models. Monitor artist reputation, trading volume, and demand trends. Combine technical analysis with fundamental factors to forecast price movements accurately.
What are the main factors affecting artwork prices?
Artwork prices are primarily influenced by artist reputation, market demand, transaction volume, supply and scarcity, historical significance, and current market sentiment in the crypto art ecosystem.
What are the common analysis methods used in art price prediction?
Common methods include regression models(linear, polynomial, decision tree)for continuous price prediction, time series analysis for trend identification, and machine learning algorithms to evaluate market dynamics and historical transaction data patterns.
How much does historical transaction data help with art price prediction?
Historical transaction data is highly valuable for art price prediction. By analyzing past transaction volumes, price trends, and market patterns, predictive models can identify patterns and forecast future price movements with greater accuracy.
How to assess and predict risks in art investment?
Evaluate art investment risks by assessing authenticity, preservation condition, and market demand. Analyze historical performance and market trends. Diversify your portfolio to mitigate risks effectively.
Share
Content
Introduction: ART's Market Position and Investment Value
I. ART Price History Review and Current Market Status
II. Core Factors Influencing ART's Future Price Trends
III. 2026-2031 ART Price Forecast
IV. ART Professional Investment Strategy and Risk Management
V. ART Potential Risks and Challenges
VI. Conclusion and Action Recommendations
FAQ
How to Buy Cryptocurrency


Trending Cryptocurrencies


Detailed Analysis of the Top 10 RWA Cryptocurrencies in 2025

Benefits of RWAs in Crypto

How to Earn with The RWA DePin Protocol in 2025

Detailed Analysis of RWA in Crypto Assets

Rexas Finance: A Blockchain-Powered Real-World Asset Tokenization Ecosystem

SIX Token (SIX): Core Logic, Use Cases and 2025 Roadmap Analysis

What is AIX9: A Comprehensive Guide to the Next Generation of Enterprise Computing Solutions

What is KLINK: A Comprehensive Guide to Understanding the Revolutionary Communication Platform

What is ART: A Comprehensive Guide to Understanding Assisted Reproductive Technology and Its Impact on Modern Fertility Treatment
What is KAR: A Comprehensive Guide to Knowledge and Reasoning Systems in Modern Technology

What is MART: A Comprehensive Guide to Multi-Agent Reinforcement Learning Through Time