This comprehensive CAPS price analysis examines Ternoa's (CAPS) market position and investment potential from 2026 through 2031. Currently trading at $0.000615 with a $1.13 million market cap, CAPS operates as a blockchain infrastructure for NFT-based data transmission on Polkadot. The article reviews historical price trends, including CAPS's 99.73% decline from its 2021 peak, and analyzes core factors influencing future performance including supply dynamics, institutional holdings, macroeconomic conditions, and regulatory frameworks. Expert price forecasts project gradual growth across the prediction period, with average prices potentially reaching $0.00134 by 2031. The guide provides detailed investment strategies for different investor profiles, comprehensive risk management frameworks, and secure trading methods via Gate exchange, while addressing critical market risks including extreme volatility, limited liquidity, and regulatory uncertainties essential for informed decision-making.
Introduction: CAPS's Market Position and Investment Value
Ternoa (CAPS), positioned as a specialized blockchain for data transmission through NFTs using Polkadot's Substrate technology, has been developing since its launch in 2021. As of 2026, Ternoa holds a market capitalization of approximately $1.13 million, with a circulating supply of around 1.83 billion tokens, and its price maintains at approximately $0.000615. This asset, characterized as a "democratizing blockchain for data inheritance," is playing an increasingly important role in NFT-based data storage and transmission applications.
This article will comprehensively analyze CAPS's price trends from 2026 to 2031, combining historical patterns, market supply and demand dynamics, ecosystem development, and macroeconomic conditions to provide investors with professional price forecasts and practical investment strategies.
I. CAPS Price History Review and Market Status
CAPS Historical Price Evolution Trajectory
- 2021: CAPS launched on May 28, 2021, with an initial offering price of $0.0555. On June 8, 2021, the token reached its peak price of $0.227823, representing a significant surge during the early trading period.
- 2022-2024: The token experienced a prolonged downward trend as part of the broader crypto market correction cycle, with price gradually declining from its historical high.
- 2025: CAPS reached its historical low point of $0.00054725 on December 16, 2025, marking a substantial decline of approximately 99.76% from its all-time high.
- 2026: As of early February 2026, the token shows some recovery momentum with a 24-hour price increase of 4.09%, though it remains near historically low levels.
CAPS Current Market Situation
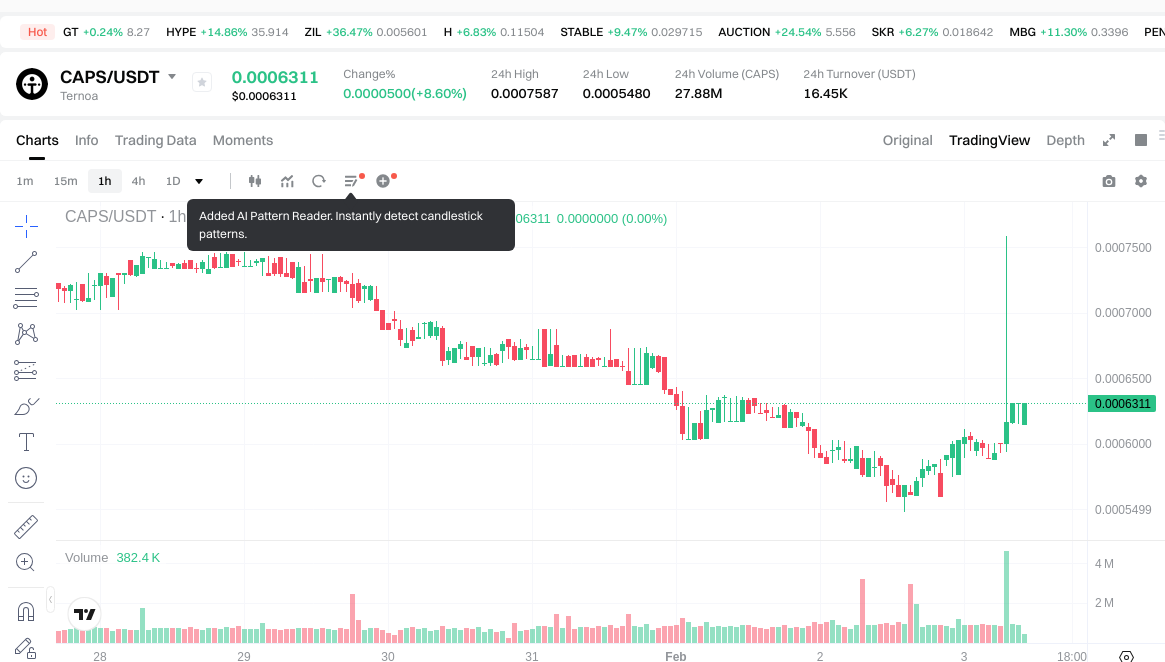
As of February 3, 2026, CAPS is trading at $0.000615, with a 24-hour trading volume of $16,471.83. The token has demonstrated mixed short-term performance, recording a 4.09% increase over the past 24 hours, while experiencing a 1.76% decline in the last hour. Over longer timeframes, the token faces downward pressure, with a 13.91% decrease over the past week and a 20.73% decline over the past 30 days.
The market capitalization stands at approximately $1.13 million, with a circulating supply of 1.83 billion CAPS tokens, representing 73.18% of the maximum supply of 2.5 billion tokens. The fully diluted market capitalization is estimated at $1.54 million. CAPS holds a market ranking of 2442 and maintains a minimal market dominance of 0.000055%.
The token is currently trading significantly below its historical high of $0.227823, down approximately 99.73%, while positioned slightly above its recent historical low of $0.00054725. The 24-hour price range spans from $0.000548 to $0.0007587. With 8,109 token holders and availability on 2 exchanges, CAPS maintains a relatively modest trading presence in the cryptocurrency market. The current market sentiment indicator shows a value of 17, reflecting an "Extreme Fear" condition in the broader market environment.
Click to view current CAPS market price
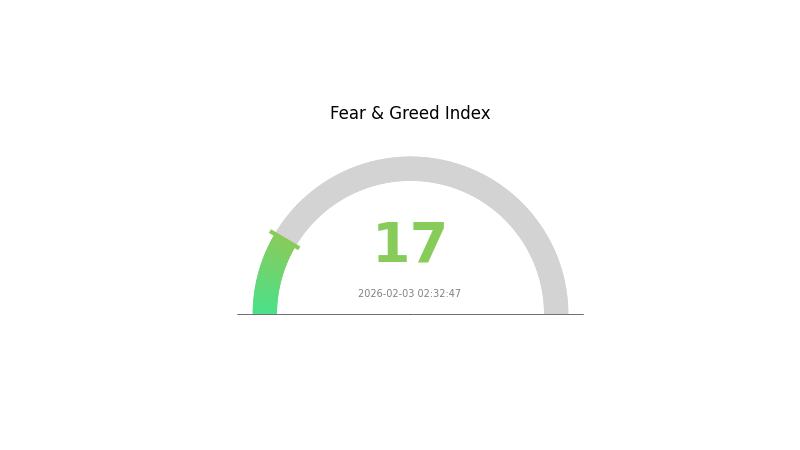
CAPS Market Sentiment Index
2026-02-03 Fear and Greed Index: 17 (Extreme Fear)
Click to view the current Fear & Greed Index
The crypto market is currently experiencing extreme fear, with the CAPS index hitting 17. This historically low reading suggests significant market pessimism and heightened risk aversion among investors. During such periods, market volatility typically increases as participants reassess their positions. While extreme fear can create compelling buying opportunities for contrarian investors with strong conviction, it also signals heightened uncertainty. Traders should exercise caution, maintain strict risk management protocols, and avoid making impulsive decisions based on short-term sentiment swings. Monitor market fundamentals closely and consider your investment thesis carefully before taking action in this fear-driven environment.
CAPS Holdings Distribution
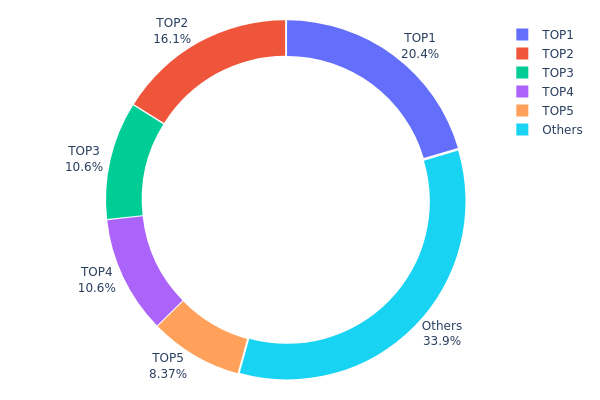
The holdings distribution chart illustrates the allocation of CAPS tokens across different wallet addresses, serving as a key indicator of token concentration and decentralization within the ecosystem. By analyzing the proportion of tokens held by top addresses versus smaller holders, this metric helps assess potential market manipulation risks and the overall health of token distribution.
Current data reveals a moderately concentrated holdings structure for CAPS. The top five addresses collectively control approximately 66.09% of the total token supply, with the largest single address holding 20.40% (510.24 million tokens). The second-largest address accounts for 16.12%, while addresses ranked third through fifth hold between 8.37% and 10.61% each. Notably, the burn address (0x0000...00dead) ranks third with 10.61%, representing tokens permanently removed from circulation. The remaining 33.91% is distributed among other addresses, indicating some degree of decentralization beyond the top holders.
This distribution pattern suggests moderate concentration risk. While no single address dominates with an overwhelming majority, the combined holdings of top addresses could potentially influence price movements through coordinated actions. The presence of a significant burn address is positive, effectively reducing circulating supply and demonstrating deflationary tokenomics. However, the relatively high concentration among top holders may create vulnerability to large-scale sell pressure. From a market structure perspective, this distribution reflects a developing ecosystem where early participants or strategic partners maintain substantial positions, which is common in emerging tokens but warrants monitoring for improved decentralization over time.
Click to view current CAPS Holdings Distribution
| Top |
Address |
Holding Qty |
Holding (%) |
| 1 |
0x2a3d...ca2ede |
510238.04K |
20.40% |
| 2 |
0x5fc0...a462ab |
403159.18K |
16.12% |
| 3 |
0x0000...00dead |
265316.09K |
10.61% |
| 4 |
0xb6d7...936e31 |
264794.00K |
10.59% |
| 5 |
0xcbb5...d7971c |
209350.00K |
8.37% |
| - |
Others |
847142.69K |
33.91% |
II. Core Factors Influencing CAPS Future Price
Supply Mechanism
- Minting and Burning Mechanism: CAPS token employs a dynamic minting and burning mechanism that directly impacts its long-term price trajectory. The balance between token creation and destruction plays a crucial role in determining supply dynamics.
- Historical Pattern: Different CAPS token minting and burning mechanisms have demonstrated substantial effects on long-term price performance, with supply adjustments influencing market valuations over extended periods.
- Current Impact: The effectiveness of the supply mechanism depends on market demand and the balance between token creation and removal from circulation.
Institutional and Major Holder Dynamics
- Holder Concentration: Investors should monitor holder concentration levels, as concentrated ownership patterns can introduce price volatility risks. Higher concentration among fewer addresses may lead to increased price sensitivity to large transactions.
- Liquidity Depth: Market liquidity depth serves as a critical indicator for investment risk assessment. Deeper liquidity pools generally provide more stable trading environments and reduce slippage for larger transactions.
Macroeconomic Environment
- Monetary Policy Impact: Global monetary policy adjustments, including interest rate decisions and quantitative measures, influence capital flows into digital assets. The current environment of monetary policy normalization affects risk asset valuations, including cryptocurrency markets.
- Inflation Considerations: Macroeconomic conditions, including inflation trends and economic growth patterns, contribute to overall market sentiment and investment decisions in the cryptocurrency space.
- Geopolitical Factors: Global economic dynamics and policy developments create backdrop conditions that may affect cryptocurrency market sentiment and investment flows.
Regulatory Policy
- Policy Framework: Regulatory policy developments represent significant factors in cryptocurrency market dynamics. Changes in regulatory approaches across different jurisdictions can influence market access, institutional participation, and overall market confidence.
- Compliance Requirements: Evolving compliance standards and reporting requirements may affect market structure and participant behavior in cryptocurrency markets.
III. 2026-2031 CAPS Price Predictions
2026 Outlook
- Conservative Prediction: $0.0004 - $0.00063
- Neutral Prediction: $0.00063 average price level
- Optimistic Prediction: $0.00087 (requiring favorable market conditions)
Based on current market analysis, CAPS is projected to experience moderate growth in 2026, with price expectations ranging from a low of $0.0004 to a potential high of $0.00087. The average trading price is anticipated to settle around $0.00063, representing approximately 2% change from baseline levels.
2027-2029 Mid-term Outlook
- Market Stage Expectations: Gradual accumulation phase with steady upward momentum
- Price Range Predictions:
- 2027: $0.00071 - $0.00105 (average $0.00075, representing 22% growth)
- 2028: $0.00084 - $0.00123 (average $0.0009, representing 46% growth)
- 2029: $0.001 - $0.00139 (average $0.00106, representing 72% growth)
- Key Catalysts: Progressive market adoption and ecosystem development could serve as primary drivers for sustained price appreciation during this period.
The mid-term forecast suggests CAPS may enter a gradual growth trajectory, with year-over-year increases becoming more pronounced as the token matures within its ecosystem.
2030-2031 Long-term Outlook
- Base Scenario: $0.00111 - $0.00145 (assuming steady ecosystem expansion)
- Optimistic Scenario: $0.00123 - $0.00146 (with enhanced market conditions)
- Transformative Scenario: Potential peaks near $0.00146 (under exceptionally favorable circumstances)
By 2030, CAPS could reach an average price of $0.00123 with a low of $0.00111 and high of $0.00145, reflecting approximately 99% growth from 2026 baseline. The 2031 forecast suggests potential stabilization with average prices around $0.00134, though volatility ranges may widen between $0.00076 and $0.00146, representing roughly 117% cumulative growth over the five-year period.
| Year |
Predicted High Price |
Predicted Average Price |
Predicted Low Price |
Price Change |
| 2026 |
0.00087 |
0.00063 |
0.0004 |
2 |
| 2027 |
0.00105 |
0.00075 |
0.00071 |
22 |
| 2028 |
0.00123 |
0.0009 |
0.00084 |
46 |
| 2029 |
0.00139 |
0.00106 |
0.001 |
72 |
| 2030 |
0.00145 |
0.00123 |
0.00111 |
99 |
| 2031 |
0.00146 |
0.00134 |
0.00076 |
117 |
IV. CAPS Professional Investment Strategy and Risk Management
CAPS Investment Methodology
(1) Long-term Holding Strategy
- Suitable for: Investors who believe in NFT data transmission infrastructure and Polkadot ecosystem development
- Operational Recommendations:
- Accumulate positions gradually during market downturns, given CAPS's current 87.16% decline from its all-time high
- Monitor project development milestones and ecosystem partnerships before increasing exposure
- Storage Solution: Use Gate Web3 Wallet for secure cold storage with multi-signature protection
(2) Active Trading Strategy
- Technical Analysis Tools:
- Volume Analysis: Current 24-hour trading volume of $16,471.83 indicates relatively low liquidity; traders should be cautious of slippage
- Support and Resistance Levels: Current 24-hour range between $0.000548 (low) and $0.0007587 (high) provides reference points
- Swing Trading Considerations:
- Set strict stop-loss orders due to high volatility (13.91% decline over 7 days)
- Avoid large position sizes given limited exchange listings (only 2 exchanges)
CAPS Risk Management Framework
(1) Asset Allocation Principles
- Conservative Investors: No more than 1-2% of crypto portfolio
- Aggressive Investors: No more than 3-5% of crypto portfolio
- Professional Investors: Consider portfolio diversification within microcap altcoin allocation
(2) Risk Hedging Solutions
- Diversification Strategy: Balance CAPS exposure with established Polkadot ecosystem tokens
- Position Sizing: Limit exposure due to low market cap ($1.13M) and ranking (#2442)
(3) Secure Storage Solutions
- Recommended Wallet: Gate Web3 Wallet provides multi-chain support including ETH network where CAPS contract exists
- Cold Storage Option: Transfer tokens to hardware-compatible wallets after verifying contract address (0x03be5c903c727ee2c8c4e9bc0acc860cca4715e2)
- Security Precautions: Always verify contract addresses through official sources; be aware of potential scam tokens with similar names
V. CAPS Potential Risks and Challenges
CAPS Market Risks
- Extreme Volatility: 87.16% decline over one year demonstrates significant downside risk
- Limited Liquidity: With only 2 exchange listings and approximately $16,472 in 24-hour volume, executing large trades may significantly impact price
- Low Market Capitalization: Current market cap of $1.13M indicates high susceptibility to market manipulation
CAPS Regulatory Risks
- NFT Classification Uncertainty: Evolving regulations regarding NFT data transmission could impact project operations
- Cross-border Data Transmission: Projects involving data transfer across jurisdictions may face regulatory scrutiny
- Token Security Status: Regulatory treatment of utility tokens remains unclear in multiple jurisdictions
CAPS Technical Risks
- Smart Contract Vulnerability: ETH-based contract (0x03be5c903c727ee2c8c4e9bc0acc860cca4715e2) requires ongoing security audits
- Substrate Integration Complexity: Dependence on Polkadot's Substrate framework introduces technical dependencies
- Network Development Risk: Project success relies on continued development and adoption of NFT data transmission use cases
VI. Conclusion and Action Recommendations
CAPS Investment Value Assessment
CAPS presents a high-risk, speculative opportunity in the NFT infrastructure sector. While the project's focus on democratizing blockchain through NFT-based data transmission addresses a niche use case, several concerning metrics warrant caution: an 87.16% decline from all-time high, minimal liquidity across limited exchanges, and a market cap ranking of #2442. The 73.18% circulating supply suggests controlled token distribution, but low holder count (8,109) indicates limited community adoption. Long-term value depends heavily on successful execution of the data transmission vision and broader adoption of Polkadot ecosystem technologies.
CAPS Investment Recommendations
✅ Beginners: Avoid this asset until gaining more experience with cryptocurrency markets; if interested in NFT infrastructure, start with more established projects
✅ Experienced Investors: Consider minimal speculative allocation (under 2% of crypto portfolio) only if conducting thorough due diligence on project development progress
✅ Institutional Investors: Current market conditions (low liquidity, limited exchange availability) make this asset unsuitable for institutional allocation strategies
CAPS Trading Participation Methods
- Spot Trading on Gate.com: Direct purchase and trading with immediate settlement
- Gradual Accumulation: Use dollar-cost averaging to mitigate entry timing risk during volatile periods
- Research-Based Approach: Monitor project GitHub activity, community engagement on Reddit and Twitter, and ecosystem developments before investing
Cryptocurrency investment carries extremely high risk, and this article does not constitute investment advice. Investors should make prudent decisions based on their own risk tolerance and are advised to consult professional financial advisors. Never invest more than you can afford to lose.
FAQ
What is CAPS and what is its purpose?
CAPS is a prediction token enabling users to forecast cryptocurrency price movements and earn rewards. It powers decentralized price prediction markets, allowing participants to stake tokens on predicted outcomes while contributing to market liquidity and discovery mechanisms.
What is the historical price trend of CAPS?
CAPS has shown moderate volatility in its price history. As of February 2026, CAPS trades at approximately 0.005612 USD. The token has maintained relatively stable trading activity, with significant trading volume across multiple platforms. Price movements reflect market dynamics and investor sentiment in the broader cryptocurrency market.
How to conduct technical analysis on CAPS price?
Analyze CAPS price through moving averages, RSI, and MACD indicators to identify trends and support/resistance levels. Study historical price patterns and trading volume to predict future movements. Combine multiple technical tools for more reliable signals and trading opportunities.
What is the CAPS price prediction for 2024?
CAPS 2024 price prediction data was not officially published. Based on market analysis, CAPS reached an all-time high of 0.227823 USD in June 2021. The cryptocurrency market downturn from 2022-2024 significantly impacted CAPS price performance and recovery potential.
What are the main factors affecting CAPS price?
CAPS price is primarily influenced by market supply dynamics, institutional investor activities, and overall market trends. Token concentration among major holders and large trader behavior are also key factors shaping price movements.
What are the advantages of CAPS compared to other cryptocurrencies?
CAPS offers diversified investment exposure through ETF structure, providing reduced risk and enhanced stability. Managed by experienced Apollo Caps team since 2008, it combines transparency with real asset backing, distinguishing it from traditional cryptocurrencies focused solely on speculation and volatility.
What risks should I be aware of when investing in CAPS?
CAPS investment risks include smart contract vulnerabilities, protocol mechanism risks, counterparty risks, and cUSD depegging risks. Market volatility is significant, so thorough understanding of the protocol mechanics is essential before participating.
* The information is not intended to be and does not constitute financial advice or any other recommendation of any sort offered or endorsed by Gate.