This comprehensive guide analyzes Decubate (DCB) token's price trajectory from 2026 to 2031, examining historical performance, current market dynamics, and future price forecasts. The article addresses investor needs by combining technical analysis, market sentiment assessment, and ecosystem development factors. It explores core influences including supply mechanisms, institutional dynamics, macroeconomic conditions, and technology advancement. Professional investment strategies encompass long-term holding and active trading approaches across Gate and other exchanges, with detailed risk management frameworks for conservative to aggressive investors. The analysis presents three-scenario forecasts with price ranges, while highlighting potential volatility, liquidity constraints, and regulatory uncertainties investors must consider before allocation decisions.
Introduction: DCB's Market Position and Investment Value
Decubate (DCB), positioned as an all-in-one platform for Web3 success, has been developing its DeFi solutions ecosystem since its launch in 2021. As of 2026, DCB maintains a market capitalization of approximately $998,535, with a circulating supply of around 394.37 million tokens, and its price stabilizes near $0.002532. This asset, serving the Web3 and decentralized finance sector, is playing an increasingly important role in empowering innovators and providing growth environments for blockchain projects.
This article will comprehensively analyze DCB's price trends from 2026 to 2031, combining historical patterns, market supply and demand dynamics, ecosystem development, and macroeconomic conditions to provide investors with professional price forecasts and practical investment strategies.
I. DCB Price History Review and Market Status
DCB Historical Price Evolution Trajectory
- 2021: DCB launched on Gate.com in July with an initial price of $0.08013, establishing its presence in the Web3 platform sector
- 2024: Price reached a notable level of $0.19998 in March, reflecting market interest in DeFi solutions and Web3 infrastructure projects
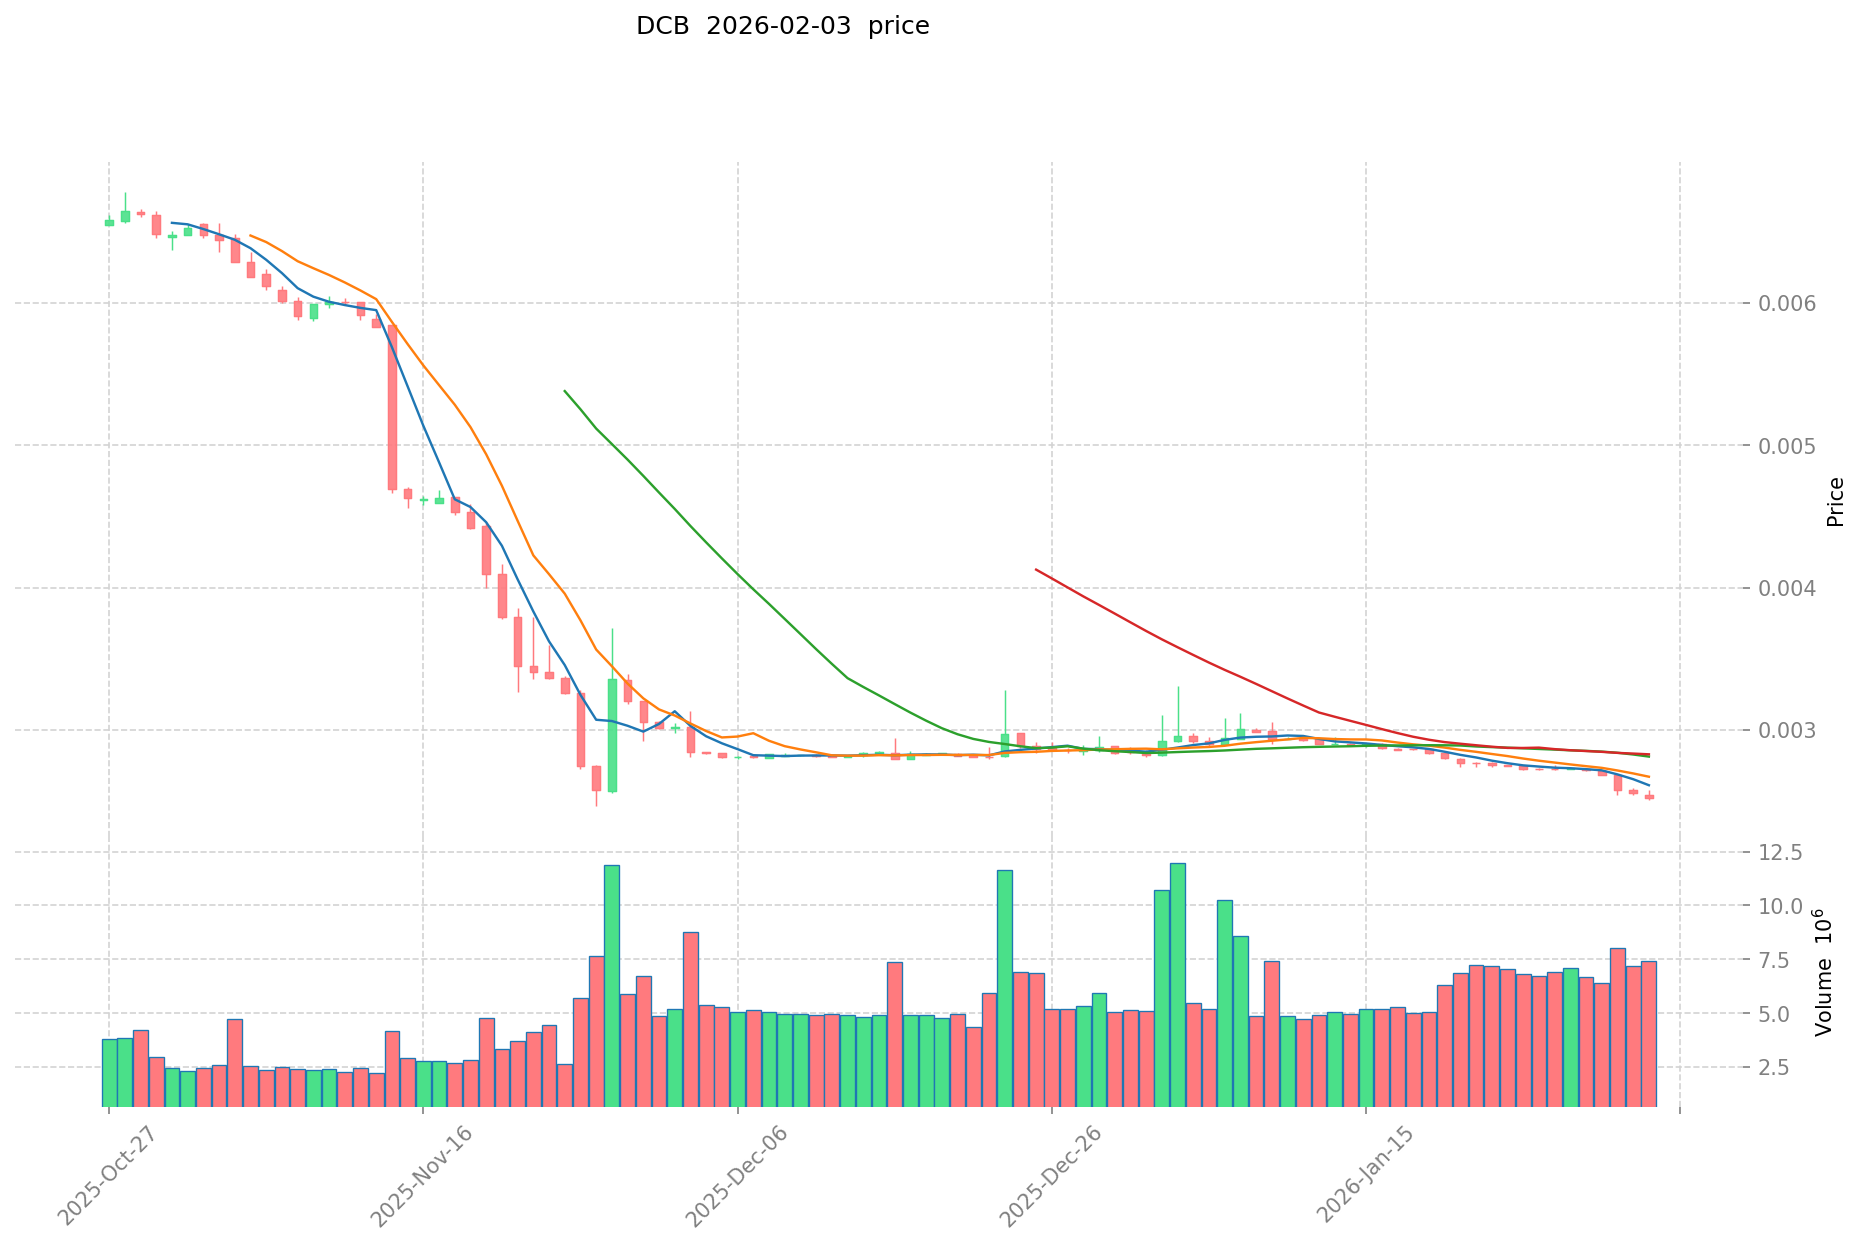
- 2025-2026: Price experienced significant adjustment, declining from previous levels to approximately $0.002532, reflecting broader market dynamics and consolidation in the decentralized economy sector
DCB Current Market Situation
As of February 03, 2026, DCB is trading at $0.002532, showing a modest 24-hour increase of 0.07%. The token has demonstrated relatively stable short-term performance, with a 1-hour change of -0.12%. However, medium to longer-term trends indicate notable adjustments, with 7-day and 30-day changes of -7.04% and -14.71% respectively.
The current market capitalization stands at approximately $998,535, with a circulating supply of 394,365,950 DCB tokens, representing 39.44% of the maximum supply of 1 billion tokens. The 24-hour trading volume reaches $18,484, indicating active market participation. The token maintains listings across 7 exchanges and has attracted 14,009 holders.
DCB operates on the BSC chain as a BEP20 token, supporting Decubate's mission to provide an all-in-one platform for Web3 success through cutting-edge DeFi solutions. The market capitalization to fully diluted valuation ratio of 39.44% suggests potential for supply expansion as the project continues its development roadmap.
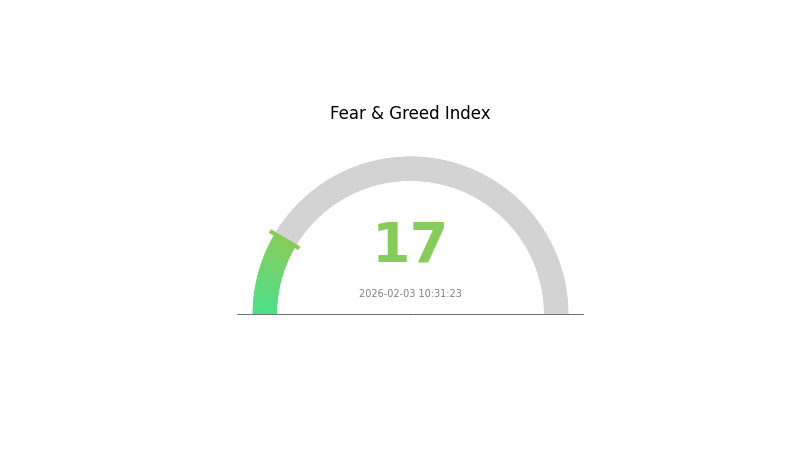
The current Fear & Greed Index stands at 17, indicating an Extreme Fear sentiment in the broader cryptocurrency market, which may influence DCB's trading dynamics alongside other digital assets.
Click to view current DCB market price
DCB Market Sentiment Index
2026-02-03 Fear and Greed Index: 17 (Extreme Fear)
Click to view the current Fear & Greed Index
The cryptocurrency market is currently experiencing extreme fear sentiment, with the Fear and Greed Index standing at 17. This historically low reading suggests heightened risk aversion among investors and traders. Market participants are exhibiting significant caution, potentially creating contrarian opportunities for experienced investors. During such periods of panic, fundamental value investors often see attractive entry points. However, proceed with appropriate risk management strategies, as extreme fear can persist longer than expected.
DCB Holding Distribution
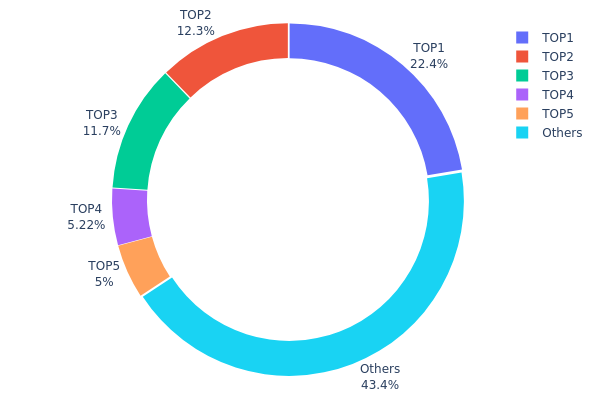
The holding distribution chart is a crucial metric for evaluating token concentration across different wallet addresses. It reveals the percentage of total supply controlled by top holders, providing insights into the decentralization level and potential market manipulation risks. For DCB, the current distribution pattern demonstrates significant concentration characteristics that warrant careful analysis.
According to the latest on-chain data, the top holder controls approximately 22.38% of the total DCB supply (223,879.72K tokens), while the second and third largest addresses hold 12.25% and 11.72% respectively. The top five addresses collectively control approximately 56.57% of the total supply, with the remaining 43.43% distributed among other participants. Notably, the address "0x0000...00dead" represents the burn address, holding 5.22% of tokens, indicating a deflationary mechanism in the project's tokenomics. This concentration level suggests a relatively centralized distribution structure, where major holders possess substantial influence over market dynamics.
This distribution pattern presents both opportunities and risks for market participants. The high concentration among top addresses could lead to increased price volatility, as large-scale transactions by whale addresses may significantly impact market liquidity and price discovery mechanisms. However, the presence of a burn address and a relatively diverse "Others" category indicates some degree of token circulation and community participation. Market participants should monitor potential changes in top holder positions, as redistribution trends could signal shifts in market sentiment or strategic positioning by major stakeholders.
Click to view current DCB Holding Distribution
| Top |
Address |
Holding Qty |
Holding (%) |
| 1 |
0x8c51...241c22 |
223879.72K |
22.38% |
| 2 |
0xeee7...6d2be9 |
122589.96K |
12.25% |
| 3 |
0xe740...e48723 |
117234.65K |
11.72% |
| 4 |
0x0000...00dead |
52201.87K |
5.22% |
| 5 |
0x7ff7...def4a7 |
50000.00K |
5.00% |
| - |
Others |
434093.80K |
43.43% |
II. Core Factors Influencing DCB's Future Price Trends
Supply Mechanism
-
Product Innovation and R&D Investment: DCB (Drug-Coated Balloon) suppliers are actively investing in research and development to launch new products and expand product lines. In 2021, R&D expenses reached 141 million yuan, representing a 69.2% increase, with technical personnel growing by 86% to 69 people. Companies are developing multiple innovative product pipelines covering peripheral intervention, cardiac intervention, and neurovascular intervention, which drives product portfolio expansion and market competitiveness.
-
Historical Patterns: Historically, high R&D investment and new product launches have driven revenue growth. DCB product revenue increased from 190.279 million yuan in 2020 to 299.17 million yuan in 2021, representing a 57.22% growth rate. As first-generation products mature and new products enter the market, supply capabilities continue to strengthen.
-
Current Impact: The approval of peripheral thrombectomy systems and the expansion of product pipelines are expected to bring new growth momentum. With multiple products entering clinical trials and obtaining regulatory approvals, supply-side expansion may support price stability while meeting growing market demand.
Institutional and Major Player Dynamics
-
Market Competition: After 2015, numerous domestic Chinese companies entered the DCB and related medical device industries, rapidly increasing production capacity. Intense competition has led to price pressures in some segments. However, first-mover advantages in channels, hospital access, and physician education create customer stickiness that is difficult to replicate.
-
Enterprise Adoption: Leading peripheral intervention medical device companies are establishing technological platforms covering drug-coating technology, radiofrequency ablation technology, aspiration technology, and polymer material technology. These platforms support future product line extensions and ecosystem development across vascular surgery, cardiology, nephrology, neurology, and urology.
-
Regulatory Environment: The approval process for new medical devices and the implementation of volume-based procurement policies influence pricing dynamics. Companies face risks from集采 (centralized procurement) price reductions, though innovative products may maintain premium pricing during early market stages.
Macroeconomic Environment
-
Healthcare Spending Trends: Growing demand for minimally invasive interventional procedures in China's aging population supports market expansion. Peripheral intervention therapy remains a blue ocean market with significant growth potential.
-
Cost Factors: Raw material costs, including polymer materials and metal materials, influence product pricing. Companies building upstream supply chain capabilities and material databases can optimize costs and strengthen competitive positioning.
-
Market Structure Impact: The transition from early-stage monopolistic competition to more mature market structures affects pricing power. As the market develops, price competition may intensify, though differentiated products and technological advantages can maintain margins.
Technology Development and Ecosystem Building
-
Polymer Material Technology: Advanced polymer extrusion processes and high-performance material databases enable the development of optimized balloon catheters and access catheters for different vascular applications. These technological barriers support product differentiation and competitive advantages.
-
Multi-Platform Innovation: Four core technology platforms (drug-coating, radiofrequency ablation, aspiration, and polymer materials) provide the foundation for product pipeline expansion. Seven products are currently in clinical trials, covering neurovascular, peripheral, and cardiac interventions.
-
Ecosystem Applications: The expansion from DCB products to comprehensive peripheral intervention solutions, including aspiration systems for deep vein thrombosis treatment, creates integrated treatment platforms. The combination of "DCB + Aspiration" dual-driver strategy opens new application scenarios and revenue streams.
III. 2026-2031 DCB Price Prediction
2026 Outlook
- Conservative forecast: $0.00237 - $0.00252
- Neutral forecast: Around $0.00252
- Optimistic forecast: Up to $0.00305 (requires favorable market conditions)
2027-2029 Outlook
- Market stage expectation: DCB is anticipated to enter a gradual growth phase, with price volatility potentially increasing as market participants assess the token's adoption trajectory and broader crypto market sentiment.
- Price range predictions:
- 2027: $0.00231 - $0.00368 (approximately 10% increase from 2026)
- 2028: $0.00175 - $0.0043 (approximately 27% increase from 2026)
- 2029: $0.00313 - $0.00411 (approximately 48% increase from 2026)
- Key catalysts: Market adoption momentum, technological developments within the DCB ecosystem, and overall cryptocurrency market recovery cycles could serve as primary drivers for price appreciation during this period.
2030-2031 Long-term Outlook
- Baseline scenario: $0.00236 - $0.00476 (assuming moderate market growth and sustained project development)
- Optimistic scenario: $0.00394 - $0.00476 (assuming accelerated adoption and favorable regulatory environment)
- Transformative scenario: Potentially reaching $0.00476 or higher (under exceptionally favorable conditions including widespread institutional adoption and major partnership announcements)
- 2026-02-03: DCB trading within the initial forecast range as the market establishes price discovery mechanisms for the mid-term outlook
| Year |
Predicted High Price |
Predicted Average Price |
Predicted Low Price |
Price Change |
| 2026 |
0.00305 |
0.00252 |
0.00237 |
0 |
| 2027 |
0.00368 |
0.00279 |
0.00231 |
10 |
| 2028 |
0.0043 |
0.00323 |
0.00175 |
27 |
| 2029 |
0.00411 |
0.00377 |
0.00313 |
48 |
| 2030 |
0.00476 |
0.00394 |
0.00236 |
55 |
| 2031 |
0.00452 |
0.00435 |
0.00257 |
71 |
IV. DCB Professional Investment Strategy and Risk Management
DCB Investment Methodology
(1) Long-Term Holding Strategy
- Target Investors: Investors seeking exposure to Web3 infrastructure and DeFi innovation with moderate to high risk tolerance
- Operational Recommendations:
- Consider gradual position building during market corrections to minimize entry risk
- Monitor project development milestones and ecosystem growth indicators
- Utilize secure storage solutions such as Gate Web3 Wallet for long-term holding
(2) Active Trading Strategy
- Technical Analysis Tools:
- Volume Analysis: Monitor the 24-hour trading volume (currently $18,484.20) relative to market cap for liquidity assessment
- Support and Resistance Levels: Track key levels including the recent 24-hour low ($0.002512) and high ($0.002579)
- Swing Trading Considerations:
- Be aware of significant volatility, as evidenced by the -7.04% weekly change
- Set appropriate stop-loss orders given the token's historical price range
DCB Risk Management Framework
(1) Asset Allocation Principles
- Conservative Investors: 1-3% of crypto portfolio allocation
- Aggressive Investors: 3-7% of crypto portfolio allocation
- Professional Investors: Up to 10% with active risk management
(2) Risk Hedging Approaches
- Portfolio Diversification: Balance DCB holdings with established cryptocurrencies and stablecoins
- Position Sizing: Limit individual position size based on the token's relatively lower market capitalization ($998,534.59)
(3) Secure Storage Solutions
- Web3 Wallet Recommendation: Gate Web3 Wallet for convenient access and security features
- Cold Storage Option: Hardware wallet solutions for long-term holdings exceeding comfort levels for hot wallet storage
- Security Precautions: Enable two-factor authentication, never share private keys, and verify contract addresses (BSC: 0xeac9873291ddaca754ea5642114151f3035c67a2)
V. DCB Potential Risks and Challenges
DCB Market Risks
- High Volatility: The token has experienced significant price fluctuations, with a -89.86% change over the past year
- Limited Liquidity: With a 24-hour trading volume of approximately $18,484, larger trades may experience slippage
- Market Cap Concentration: Current market dominance of 0.000091% indicates exposure to broader market sentiment shifts
DCB Regulatory Risks
- DeFi Regulatory Uncertainty: Evolving regulatory frameworks for decentralized finance platforms may impact project operations
- Compliance Requirements: Potential future compliance obligations could affect platform functionality and token utility
- Jurisdictional Variations: Different regulatory approaches across regions may create operational challenges
DCB Technical Risks
- Smart Contract Vulnerabilities: As with all blockchain-based projects, potential security vulnerabilities in underlying smart contracts
- Platform Dependency: Project success is tied to the continued development and adoption of the Decubate ecosystem
- Competition: Increasing competition in the Web3 and DeFi space may affect market positioning
VI. Conclusion and Action Recommendations
DCB Investment Value Assessment
Decubate (DCB) represents a Web3 infrastructure play focused on DeFi solutions and project incubation. With a circulating supply of 394,365,950 tokens (39.44% of maximum supply) and trading availability on 7 exchanges, the project maintains operational presence. However, investors should note the significant price decline from its historical high and current low market capitalization. The project's long-term value proposition depends on successful ecosystem development and user adoption, while short-term risks include price volatility and limited liquidity.
DCB Investment Recommendations
✅ Beginners: Start with small allocations (1-2% of crypto portfolio) and prioritize learning about Web3 and DeFi fundamentals before investing
✅ Experienced Investors: Consider DCB as a speculative allocation within a diversified portfolio, with active monitoring of project developments
✅ Institutional Investors: Conduct thorough due diligence on project fundamentals, team credentials, and ecosystem partnerships before considering allocation
DCB Trading Participation Methods
- Spot Trading: Available on Gate.com and 6 other exchanges for direct token purchases
- Dollar-Cost Averaging: Systematic periodic purchases to mitigate timing risk in volatile markets
- Limit Orders: Strategic use of limit orders to capture favorable entry and exit points
Cryptocurrency investments carry extremely high risks. This article does not constitute investment advice. Investors should make cautious decisions based on their own risk tolerance and are advised to consult professional financial advisors. Never invest more than you can afford to lose.
FAQ
What is DCB? What are its uses and value?
DCB is Decubate's utility token enabling staking rewards, community governance, and exclusive investment opportunities. Holders participate in platform decisions and benefit from ecosystem growth through governance participation and token appreciation potential.
How to predict DCB price trends? What are the analysis methods?
Predict DCB price movements through technical analysis using chart patterns and indicators to identify market trends. Analyze key support and resistance levels to determine price turning points. Historical data and trend analysis provide additional insights for forecasting.
What are the main factors affecting DCB price?
DCB price is primarily influenced by market sentiment, overall cryptocurrency market trends, and investor confidence. Trading volume, market demand, and the broader crypto market cycle also significantly impact its valuation.
DCB的历史价格表现如何?过去有过什么重大波动?
DCB历史最高价为$0.1768,最低价为$0。过去7天内价格下跌2.15%,显示出中等市场波动性。短期波动相对较小,反映市场稳定状态。
What are the risks of investing in DCB? What should I pay attention to?
DCB investment faces market volatility, price manipulation, and regulatory uncertainty risks. Additionally, pay attention to technical vulnerabilities and security concerns. Conduct thorough research before investing.
What are the advantages and disadvantages of DCB compared to other mainstream cryptocurrencies?
DCB offers lower transaction fees and greater stability with reduced volatility compared to major cryptocurrencies. However, it may lack the high growth potential and market liquidity of leading digital assets, limiting rapid appreciation opportunities.
What are professional analysts' price predictions for DCB in the future?
Professional analysts predict DCB's maximum price target at 235.00 INR and minimum at 150.00 INR based on current market analysis and trading volume data.
* The information is not intended to be and does not constitute financial advice or any other recommendation of any sort offered or endorsed by Gate.