2026 DCK Price Prediction: Expert Analysis and Market Forecast for Decentralized Finance Token

Introduction: DCK's Market Position and Investment Value
DexCheck (DCK), as an AI-powered blockchain analytics platform token, has been developing its ecosystem and market presence since its launch in 2023. As of 2026, DCK maintains a market capitalization of approximately 880,323 USD, with a circulating supply of around 678,215,649 tokens, and its price remains at approximately 0.001298 USD. This asset, serving the blockchain analytics and trading intelligence sector, is playing an increasingly important role in simplifying Web3 data analysis and providing real-time insights for crypto and NFT markets.
This article will comprehensively analyze DCK's price trends from 2026 to 2031, combining historical patterns, market supply and demand dynamics, ecosystem development, and macroeconomic environment factors to provide investors with professional price forecasts and practical investment strategies.
I. DCK Price History Review and Market Status
DCK Historical Price Evolution Trajectory
- 2023: DexCheck launched with a publish price of $0.014, marking its entry into the crypto analytics market
- 2024: Reached an all-time high of $0.18378 on March 11, representing significant growth from its initial listing price
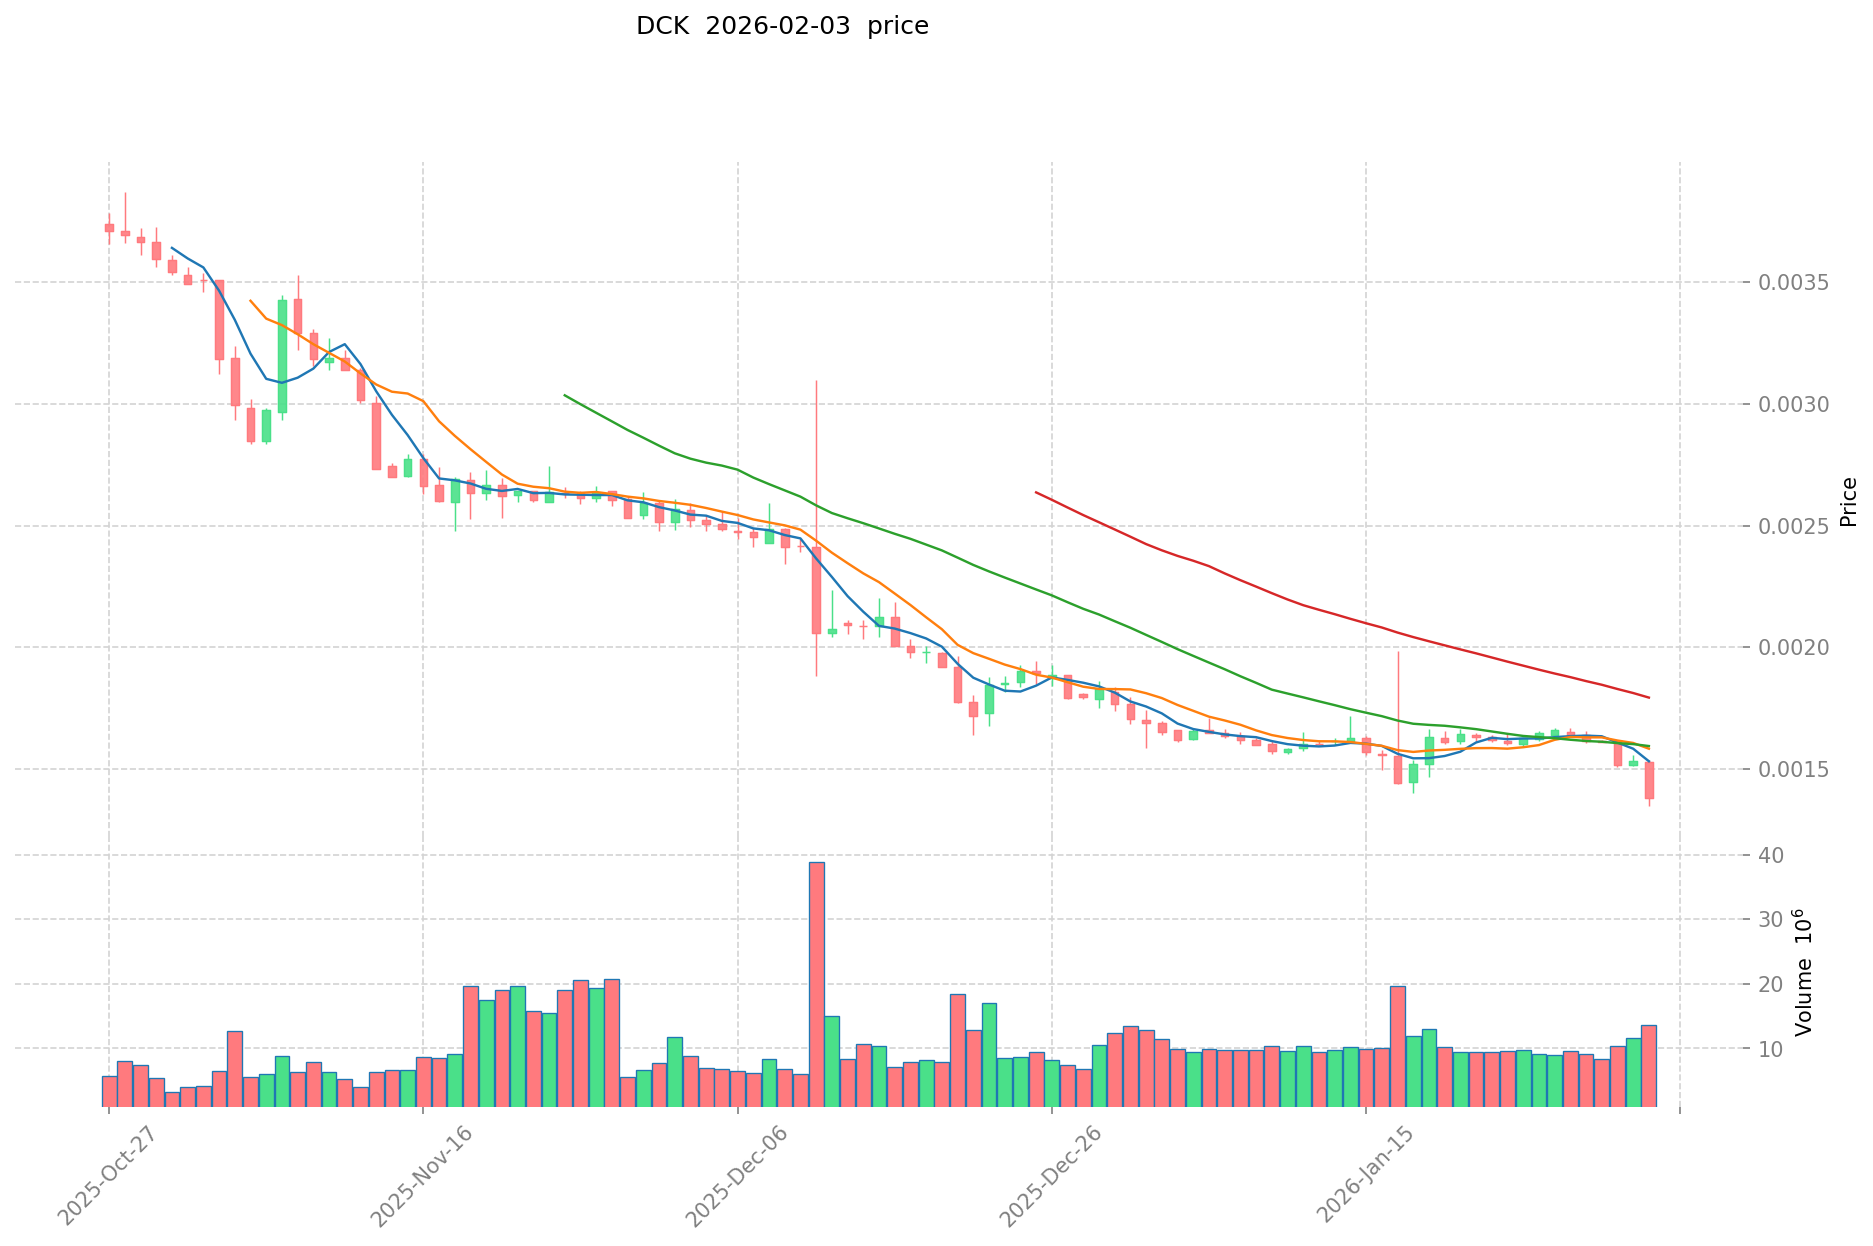
- 2026: Experienced considerable volatility, with price declining to an all-time low of $0.001289 on February 3
DCK Current Market Situation
As of February 4, 2026, DCK is trading at $0.001298, showing a 1-hour increase of 0.32% but facing downward pressure across longer timeframes. The token has experienced a 6.75% decline over the past 24 hours, with the 24-hour trading range between $0.001289 and $0.001403.
Over the weekly period, DCK has decreased by 21.4%, while the 30-day performance shows a similar decline of 21.26%. The most notable movement is the 1-year performance, which reflects a 91.82% decrease from previous levels. The 24-hour trading volume stands at $16,533.79.
DexCheck maintains a market capitalization of approximately $880,323.91, with a circulating supply of 678,215,649 DCK tokens, representing 67.82% of the total supply of 960,416,884.58 tokens. The fully diluted market cap is calculated at $1,246,621.12, based on a maximum supply of 1,000,000,000 tokens. The token currently ranks #2,601 in market capitalization.
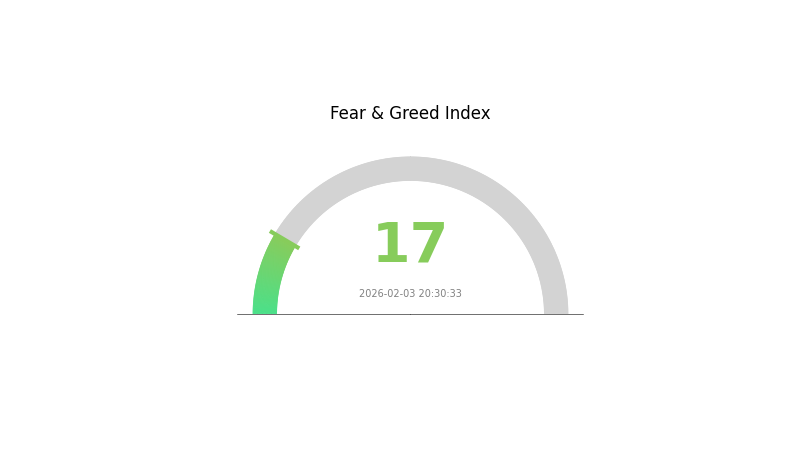
The platform serves 13,975 holders and is listed on 5 exchanges. Current market sentiment indicators show a reading of 17 on the volatility index, which corresponds to extreme fear conditions in the broader market environment.
Click to view current DCK market price
DCK Market Sentiment Indicator
2026-02-03 Fear and Greed Index: 17 (Extreme Fear)
Click to view current Fear & Greed Index
The cryptocurrency market is currently experiencing extreme fear, with the Fear and Greed Index at 17. This historically low reading indicates severe market pessimism and investor anxiety. When fear reaches such extreme levels, it often presents contrarian opportunities for long-term investors, as panic selling may create attractive entry points. However, traders should exercise caution and conduct thorough research before making investment decisions. Market conditions at such extremes can either signal a potential bottom or precede further downside movement. Professional portfolio management and risk assessment remain essential during periods of heightened market stress.
DCK Holding Distribution
The holding distribution chart illustrates how DCK tokens are allocated across different wallet addresses, providing crucial insights into the token's ownership structure and decentralization level. This metric serves as a key indicator for assessing potential concentration risks and market manipulation possibilities.
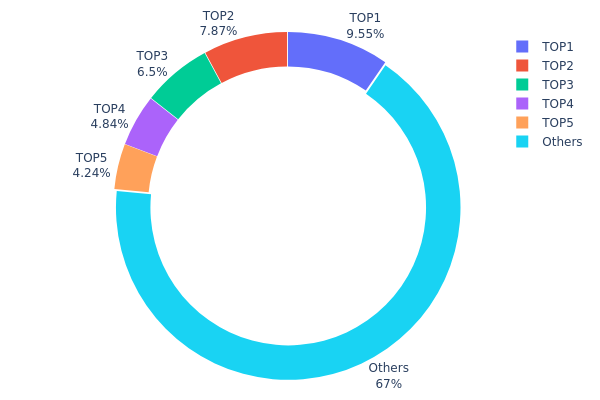
Based on the current data, DCK demonstrates a moderately concentrated holding pattern. The top five addresses collectively control 330,054K tokens, representing approximately 33% of the total supply. The largest holder (0x564e...d0f8f4) alone possesses 9.54% of all DCK tokens, followed by the second-largest address holding 7.86%. While this level of concentration is not uncommon in the cryptocurrency market, it does present certain structural considerations for investors.
The remaining 67.02% of DCK tokens are distributed among other addresses, suggesting a relatively broad base of smaller holders. This distribution pattern indicates a balanced ecosystem where no single entity possesses overwhelming control, yet the presence of several significant whale addresses warrants monitoring. Such a structure typically implies moderate price volatility potential, as large holders retain sufficient influence to impact market dynamics through substantial transactions. However, the diversified ownership base among the majority of holders contributes to overall market stability and reduces the likelihood of extreme price manipulation scenarios.
Click to view current DCK Holding Distribution
| Top | Address | Holding Qty | Holding (%) |
|---|---|---|---|
| 1 | 0x564e...d0f8f4 | 95452.78K | 9.54% |
| 2 | 0x6d83...30f063 | 78697.34K | 7.86% |
| 3 | 0x60aa...8c6696 | 65037.53K | 6.50% |
| 4 | 0x0e30...d75a9f | 48431.88K | 4.84% |
| 5 | 0x4982...6e89cb | 42434.35K | 4.24% |
| - | Others | 669946.12K | 67.02% |
II. Core Factors Influencing DCK's Future Price
Market Demand and Adoption Trends
- Market Demand: DCK's price prospects are influenced by market demand dynamics, with broader cryptocurrency market conditions playing a significant role in determining token valuation.
- Adoption Trends: The level of technology adoption and platform usage directly impacts DCK's market performance, as increased user engagement typically correlates with enhanced token value.
- Current Impact: Based on available market analysis, DCK demonstrates potential for steady growth, with projections suggesting a moderate annual growth trajectory in the coming years.
Institutional Participation and Economic Environment
- Institutional Involvement: Institutional participation represents a key driver for DCK's price movement, as larger players entering the market can significantly affect liquidity and price stability.
- Broader Economic Factors: The overall economic environment, including macroeconomic conditions and cryptocurrency market sentiment, continues to shape DCK's price trajectory.
- Market Growth Outlook: The cryptocurrency market is expected to maintain a growth trend in the coming years, which could provide a supportive backdrop for DCK's development.
Technology Development and Ecosystem Expansion
- Platform Development: Ongoing technology development within the DexCheck ecosystem may contribute to enhanced functionality and user experience, potentially supporting long-term value creation.
- Market Position: DCK's position within the broader cryptocurrency landscape and its ability to adapt to evolving market conditions will be important factors in determining future price performance.
III. 2026-2031 DCK Price Prediction
2026 Outlook
- Conservative prediction: $0.00087 - $0.0013
- Neutral prediction: Around $0.0013
- Optimistic prediction: Up to $0.00154 (requires favorable market conditions)
2027-2029 Outlook
- Market stage expectation: Progressive growth phase with gradual adoption
- Price range prediction:
- 2027: $0.00098 - $0.00159 (9% potential increase)
- 2028: $0.00137 - $0.00171 (15% potential increase)
- 2029: $0.00119 - $0.00232 (24% potential increase)
- Key catalysts: Ecosystem development, increased adoption, and market sentiment improvement
2030-2031 Long-term Outlook
- Baseline scenario: $0.00171 - $0.00216 (assuming steady market growth)
- Optimistic scenario: $0.00188 - $0.00297 (assuming accelerated adoption and favorable market conditions)
- Transformative scenario: Potential 51-58% increase from baseline by 2030-2031 (requires significant ecosystem expansion and mainstream adoption)
- 2026-02-04: DCK trading within the range of $0.00087 - $0.00154 (early stage development)
| Year | Predicted High Price | Predicted Average Price | Predicted Low Price | Price Change |
|---|---|---|---|---|
| 2026 | 0.00154 | 0.0013 | 0.00087 | 0 |
| 2027 | 0.00159 | 0.00142 | 0.00098 | 9 |
| 2028 | 0.00171 | 0.0015 | 0.00137 | 15 |
| 2029 | 0.00232 | 0.00161 | 0.00119 | 24 |
| 2030 | 0.00216 | 0.00196 | 0.00171 | 51 |
| 2031 | 0.00297 | 0.00206 | 0.00188 | 58 |
IV. DCK Professional Investment Strategies and Risk Management
DCK Investment Methodology
(1) Long-term Holding Strategy
- Target Investors: Cryptocurrency enthusiasts interested in AI-powered analytics platforms and Web3 data infrastructure
- Operational Recommendations:
- Consider accumulating positions during market corrections when DCK trades below $0.0015
- Monitor the development progress of DexCheck's Telegram bot suite and PRO features rollout
- Evaluate staking opportunities to earn platform revenue sharing and access exclusive features
- Storage Solution: Utilize Gate Web3 Wallet for secure storage with multi-signature protection
(2) Active Trading Strategy
- Technical Analysis Tools:
- Volume Analysis: Monitor the 24-hour trading volume (currently $16,533) for liquidity assessment and entry timing
- Support and Resistance Levels: Track key price levels with recent low at $0.001289 and 24-hour high at $0.001403
- Swing Trading Key Points:
- Capitalize on the volatility reflected in the 24-hour price range (8.8% fluctuation)
- Set stop-loss orders below the recent low of $0.001289 to manage downside risk
DCK Risk Management Framework
(1) Asset Allocation Principles
- Conservative Investors: 1-2% of crypto portfolio allocation
- Aggressive Investors: 3-5% of crypto portfolio allocation
- Professional Investors: Up to 8% with active monitoring and hedging strategies
(2) Risk Hedging Solutions
- Portfolio Diversification: Combine DCK with established blockchain infrastructure tokens to balance risk exposure
- Position Sizing: Gradually build positions during different market conditions rather than lump-sum investment
(3) Secure Storage Solutions
- Hot Wallet Recommendation: Gate Web3 Wallet for convenient trading and staking access
- Security Considerations: Enable two-factor authentication, regularly update security protocols, and never share private keys or seed phrases
V. DCK Potential Risks and Challenges
DCK Market Risks
- High Volatility: DCK has experienced a 91.82% decline over the past year, indicating significant price volatility
- Limited Liquidity: With a 24-hour trading volume of $16,533 and availability on only 5 exchanges, liquidity constraints may impact large transactions
- Market Correlation: The token's performance may be affected by broader crypto market sentiment and AI sector trends
DCK Regulatory Risks
- Jurisdictional Uncertainty: Evolving regulations around AI-powered financial analytics platforms may impact DexCheck's operations
- Compliance Requirements: Potential regulatory scrutiny on cryptocurrency analytics services and data privacy standards
- Cross-border Operations: Operating across multiple blockchain ecosystems may expose the project to varying regulatory frameworks
DCK Technical Risks
- Smart Contract Vulnerabilities: As a BSC-based token, DCK is subject to potential smart contract exploits or network-specific risks
- Platform Dependency: The token's value proposition relies heavily on the continued development and adoption of DexCheck's analytics platform
- Competition: The AI-powered crypto analytics space is increasingly competitive, with new platforms emerging regularly
VI. Conclusion and Action Recommendations
DCK Investment Value Assessment
DexCheck (DCK) presents an interesting proposition in the AI-powered blockchain analytics sector, offering practical utility through PRO features, staking rewards, and Telegram bot revenue sharing. However, the token currently faces challenges, including a market cap of approximately $880,323, a ranking of 2601, and notable price depreciation from its all-time high of $0.18378 in March 2024 to the current price of $0.001298. The circulating supply represents 67.82% of the total supply, with 13,975 holders demonstrating modest community engagement. While the platform's comprehensive Web3 data integration and AI-assisted analysis tools provide fundamental value, investors should carefully weigh the significant price volatility and limited trading volume against the long-term potential of the analytics platform's development.
DCK Investment Recommendations
✅ Beginners: Start with minimal allocation (under 1% of portfolio), focus on understanding DexCheck's platform features before investing, and utilize the free tier to evaluate utility ✅ Experienced Investors: Consider small speculative positions with strict risk management, monitor platform adoption metrics and user growth, and evaluate staking options for passive income opportunities ✅ Institutional Investors: Conduct thorough due diligence on team credentials and technology roadmap, assess competitive landscape in blockchain analytics sector, and consider strategic allocation only after comprehensive risk analysis
DCK Trading Participation Methods
- Spot Trading: Purchase DCK through Gate.com and other supporting exchanges with available liquidity
- Staking Programs: Participate in DexCheck's staking mechanism to earn rewards and access PRO features
- Platform Engagement: Utilize DexCheck's analytics tools to evaluate the platform's value proposition firsthand before making investment decisions
Cryptocurrency investments carry extremely high risks, and this article does not constitute investment advice. Investors should make prudent decisions based on their own risk tolerance and are advised to consult professional financial advisors. Never invest more than you can afford to lose.
FAQ
What is DCK? What are its basic information and uses?
DCK is a blockchain-based digital currency serving as the native token of the DCK platform. It functions for platform fee payments, transaction settlement, and ecosystem rewards within decentralized applications and digital asset trading.
What are the main factors affecting DCK price?
DCK price is primarily influenced by market sentiment, regulatory environment, trading volume, investor demand, and industry news. These factors directly impact market dynamics and price movements in the crypto market.
How to predict DCK price? What are the analysis methods?
DCK price prediction uses technical analysis and fundamental assessment. Key methods include moving averages, RSI indicators, trading volume analysis, and market sentiment evaluation. Chart patterns and support/resistance levels also guide predictions.
DCK的历史价格表现如何?过去有什么价格趋势?
DCK历史最高价达$0.18356862,最低价为$0.0015701456。过去一周下跌5.02%,总体呈波动下行趋势,短期承压。
What risks exist in DCK price predictions? How should I evaluate prediction accuracy?
DCK price prediction risks include market volatility and indicator variations. Evaluate accuracy by analyzing technical indicators (RSI, MACD), historical data reliability, trading volume trends, and market sentiment. Compare multiple prediction models for consistency.
How is DCK's price volatility compared to other cryptocurrencies?
DCK exhibits higher volatility compared to many cryptocurrencies, with prices fluctuating between $0.002817 and $0.004882 in 2025. The average price is $0.003756, with projections suggesting it could reach $0.008732 by 2030.
Share
Content
Introduction: DCK's Market Position and Investment Value
I. DCK Price History Review and Market Status
II. Core Factors Influencing DCK's Future Price
III. 2026-2031 DCK Price Prediction
IV. DCK Professional Investment Strategies and Risk Management
V. DCK Potential Risks and Challenges
VI. Conclusion and Action Recommendations
FAQ
How to Buy Cryptocurrency


Trending Cryptocurrencies


Survey Note: Detailed Analysis of the Best AI in 2025

What Is the Best AI Crypto in 2025?

What is the Best AI Now?

Why ChatGPT is Likely the Best AI Now?

How Does Solidus Ai Tech's Market Cap Compare to Other AI Cryptocurrencies?
MomoAI: AI-Powered Social Gaming Revolution on Solana

How Does Token Economic Model Balance Community, Team, and Investor Interests Through Deflationary Mechanisms?
What is Litecoin's fundamental analysis and why will LTC reach $250-$300 by 2030
What are the major security risks and vulnerabilities in cryptocurrency exchanges and smart contracts in 2026?

How does macroeconomic policy uncertainty affect UNI crypto price in 2026: Fed policy, inflation data, and stock market correlation analysis

How to Use RSI in Cryptocurrency Trading and Its Calculation Formula