This comprehensive DIO price prediction analysis examines Decimated's blockchain gaming token prospects from 2026 to 2031, starting with its current market position at $0.000642 with a $348,773 market cap. The article evaluates historical price evolution, current extreme fear market sentiment, and key influence factors including macroeconomic conditions, monetary policy, and energy market dynamics. Professional price forecasts range from conservative $0.0005-$0.00064 in 2026 to optimistic $0.00173 by 2031, with detailed predictions across five-year horizons. The analysis provides actionable investment strategies including long-term holding and active trading approaches, comprehensive risk management frameworks recommending 1-10% portfolio allocation, and security solutions via Gate Web3 Wallet. Key risk assessments address extreme volatility, low liquidity, regulatory uncertainties, and technical vulnerabilities, making this essential reading for risk-tolerant GameFi investors seeking data-driven market insig
Introduction: DIO's Market Position and Investment Value
Decimated (DIO), as a blockchain-based post-apocalyptic multiplayer survival game token developed by Fracture Labs, has been navigating the gaming and cryptocurrency intersection since its launch in 2019. As of February 7, 2026, DIO maintains a market capitalization of approximately $348,773, with a circulating supply of about 543.26 million tokens, and a price hovering around $0.000642. This gaming-focused digital asset, designed to enable true item scarcity and play-to-earn mechanics within its ecosystem, is playing an increasingly relevant role in the blockchain gaming sector.
This article will comprehensively analyze DIO's price trajectory from 2026 to 2031, combining historical patterns, market supply-demand dynamics, ecosystem development, and macroeconomic conditions to provide investors with professional price forecasts and practical investment strategies.
I. DIO Price History Review and Market Status
DIO Historical Price Evolution Trajectory
- 2021: Project launch phase, price experienced significant volatility with an all-time low recorded at $0.000000082531 on December 29, 2021
- 2022: Price reached its all-time high of $0.58793 on January 3, 2022, marking a peak period for the token
- 2022-2026: Extended bear market cycle, price declined substantially from the all-time high to current levels around $0.000642
DIO Current Market Landscape
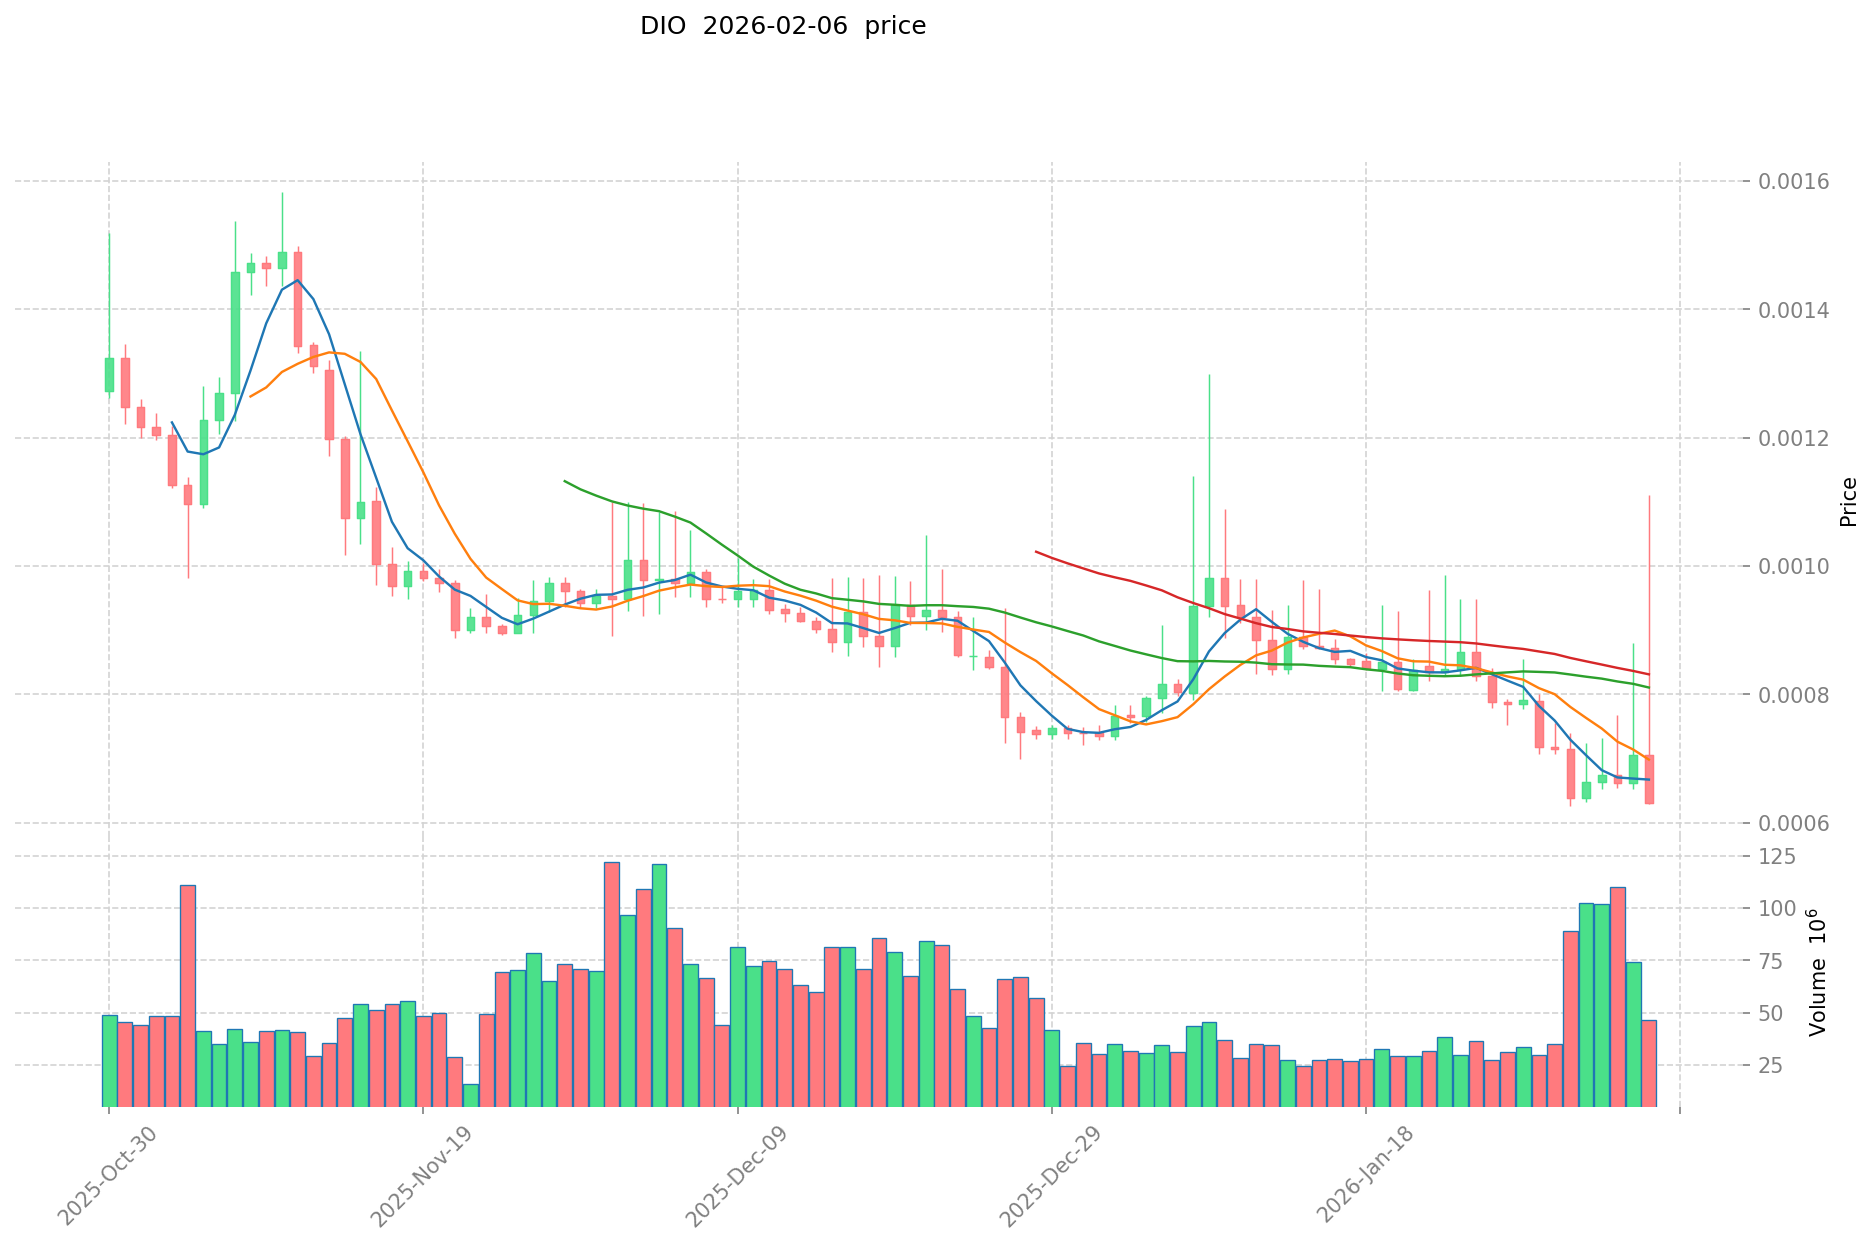
As of February 7, 2026, DIO is trading at $0.000642, reflecting notable short-term price movements across multiple timeframes. Over the past hour, the token has shown a modest recovery with a 0.74% increase. However, broader timeframes reveal downward pressure, with the 24-hour period recording a 5.49% decline, and the 7-day window showing a 10.34% decrease.
The 30-day performance indicates a 25.18% drop, while the annual perspective demonstrates a substantial 89.36% decline from year-ago levels. Within the past 24 hours, DIO has fluctuated between a high of $0.0007918 and a low of $0.0006, with trading volume reaching $31,491.94.
DIO currently holds a market ranking of #3362, with a circulating supply of 543,259,848.24 tokens out of a maximum supply of 1,000,000,000 tokens, representing a circulation ratio of approximately 54.33%. The circulating market capitalization stands at $348,772.82, while the fully diluted market cap is positioned at $642,000. The market capitalization to fully diluted valuation ratio is 54.33%, and DIO's market dominance is measured at 0.000025%.
The current market sentiment indicator shows a fear index score of 9, characterized as "Extreme Fear," reflecting broader market uncertainty. DIO is available for trading on 2 exchanges, with Gate.com supporting DIO trading pairs. The token's contract is deployed on the Solana blockchain at address BiDB55p4G3n1fGhwKFpxsokBMqgctL4qnZpDH1bVQxMD, and the project maintains 11,582 token holders.
Click to view current DIO market price
DIO Market Sentiment Index
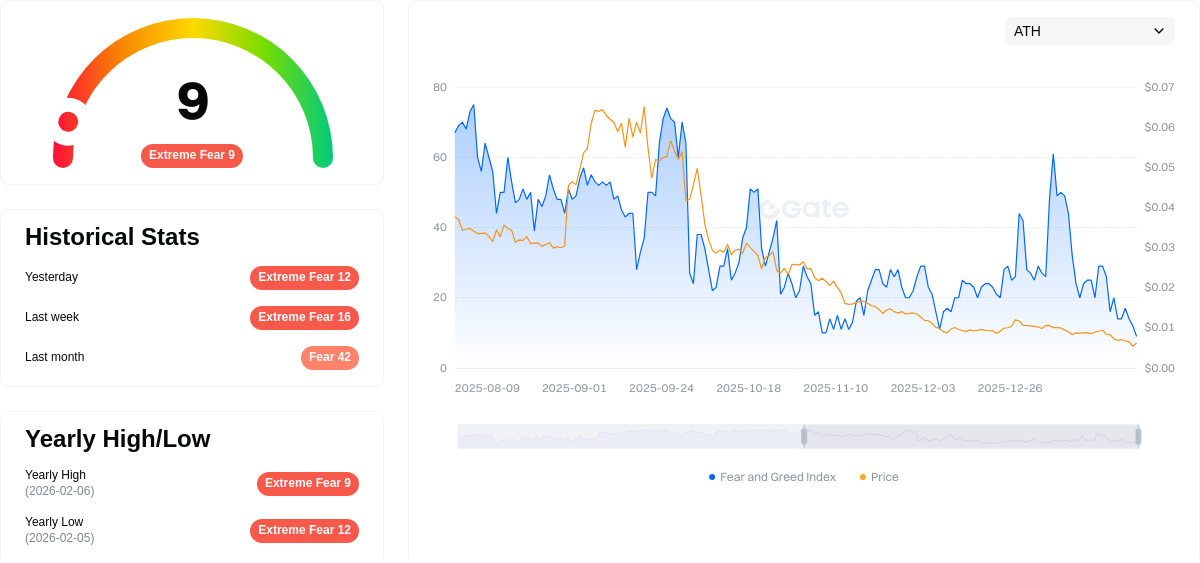
2026-02-06 Fear and Greed Index: 9 (Extreme Fear)
Click to view current Fear & Greed Index
The cryptocurrency market is currently experiencing extreme fear, with the Fear and Greed Index hitting just 9 points. This exceptionally low reading indicates severe market pessimism and investor anxiety. During such extreme fear periods, opportunities often emerge for contrarian investors, as panic selling may push asset prices below their intrinsic value. However, caution is warranted, as markets can remain irrational in the short term. Investors should carefully assess their risk tolerance and maintain disciplined trading strategies before making any investment decisions.
DIO Holdings Distribution
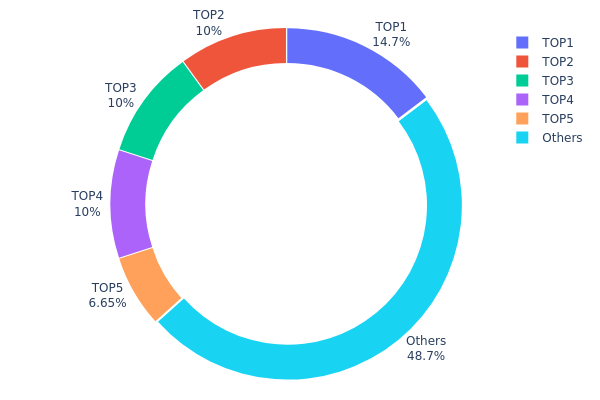
The holdings distribution chart illustrates how DIO tokens are allocated across different wallet addresses, providing crucial insights into the token's ownership concentration and decentralization level. This metric serves as a key indicator of market structure stability and potential manipulation risks.
Based on the current data, DIO exhibits a moderate concentration pattern. The top holder controls 14.68% of the total supply (146,850.01K tokens), while the second through fourth addresses each hold exactly 10.00% (100,000.00K tokens). The fifth-largest holder possesses 6.65% (66,520.50K tokens). Collectively, the top five addresses account for 51.33% of the total supply, with the remaining 48.67% distributed among other market participants. This distribution suggests a relatively balanced ownership structure compared to many emerging tokens, where top holders often control 70-80% of supply.
The current holdings pattern indicates moderate decentralization with acceptable diversification. While the top holder's 14.68% stake represents significant influence, the absence of any single entity controlling over 20% mitigates extreme manipulation risks. The near-equal distribution among addresses ranked 2-4 (each at 10%) suggests potential institutional or strategic allocations rather than concentrated whale control. However, the collective 51.33% held by top five addresses still presents potential volatility risks during coordinated selling events. The 48.67% held by others demonstrates healthy community participation, which typically contributes to market liquidity and price stability. This distribution structure reflects a maturing token ecosystem with reasonable on-chain governance potential, though monitoring large holder behavior remains essential for assessing short-term price dynamics.
Click to view current DIO Holdings Distribution
| Top |
Address |
Holding Qty |
Holding (%) |
| 1 |
8NBEbx...vEcMBE |
146850.01K |
14.68% |
| 2 |
BQBize...UcG35d |
100000.00K |
10.00% |
| 3 |
84nybe...Pd9rTU |
100000.00K |
10.00% |
| 4 |
D4Sd5K...BZMM5t |
100000.00K |
10.00% |
| 5 |
u6PJ8D...ynXq2w |
66520.50K |
6.65% |
| - |
Others |
486626.26K |
48.67% |
II. Core Factors Influencing DIO's Future Price
Macroeconomic Environment
-
Monetary Policy Impact: Market participants continue to assess the Federal Reserve's next interest rate adjustment timeline, with employment data returning to market focus. Following three consecutive rate cuts, the Federal Reserve announced it would maintain current interest rates, noting that the labor market is beginning to stabilize. ING economist James Knightley indicated that markets remain cautious about employment trends and are currently pricing in two 25-basis-point rate cuts this year. European Central Bank and Bank of England monetary policy decisions also draw attention, with expectations that central banks will maintain stable rates while monitoring inflation and currency strength dynamics.
-
Geopolitical Factors: Concerns over Middle East conflicts have significantly influenced commodity markets, with potential impacts on energy infrastructure and shipping routes through the Strait of Hormuz. Geopolitical tensions create market volatility that may affect risk asset sentiment. Additionally, ongoing developments in international relations and trade policies contribute to market uncertainty, with investors closely monitoring these evolving situations.
-
Inflation Hedge Characteristics: The precious metals market experienced significant volatility, with gold and silver futures showing sharp movements following monetary policy developments. Market strategist Claudio Weil from Julius Baer noted that geopolitical tensions formed a "perfect storm" supporting precious metals prices earlier, though recent Federal Reserve chair nomination speculation became a catalyst for reversal. Currency fluctuations, particularly US dollar strength, also impact assets priced in other currencies.
Economic Data and Market Sentiment
-
Employment Market Indicators: January US non-farm employment data is scheduled for release, providing critical insights into labor market health and monetary policy direction. Additional employment indicators include the December JOLTS report, January ADP private sector employment data, and weekly initial jobless claims. These data points serve as key benchmarks for assessing economic conditions.
-
Manufacturing and Consumer Confidence: Multiple core US economic health indicators are due for release, including the ISM Manufacturing PMI, Non-Manufacturing PMI, and University of Michigan Consumer Sentiment Index. These metrics offer perspectives on economic activity across different sectors.
-
Corporate Earnings Season: Major technology and consumer companies including Google, Amazon, Walt Disney, AMD, and Qualcomm are releasing earnings reports, with market attention focused on corporate performance indicators that may signal broader economic trends.
Energy Market Dynamics
- Oil Price Fluctuations: WTI crude oil near-month contracts rose 6.78% to $65.51 per barrel, while Brent crude near-month contracts increased 7.30% to $70.69 per barrel. Disruptions to Caspian pipeline facilities reduced Kazakhstan's crude oil exports, and strong winter storms across the United States elevated heating fuel demand while disrupting crude production in the Gulf of Mexico and other regions.
III. 2026-2031 DIO Price Prediction
2026 Outlook
- Conservative Forecast: $0.0005 - $0.00064
- Neutral Forecast: $0.00064 (average price expectation)
- Optimistic Forecast: Up to $0.00076 (requires sustained market momentum and increased trading activity)
2027-2029 Mid-term Outlook
- Market Stage Expectation: Gradual growth phase with potential volatility as the project matures and establishes stronger market presence
- Price Range Predictions:
- 2027: $0.00062 - $0.00102 (representing approximately 9% growth)
- 2028: $0.00051 - $0.00101 (showing 33% improvement in market positioning)
- 2029: $0.00077 - $0.00121 (reflecting 45% advancement in market valuation)
- Key Catalysts: Enhanced adoption rates, potential ecosystem developments, and broader cryptocurrency market trends could drive price appreciation during this period
2030-2031 Long-term Outlook
- Baseline Scenario: $0.00088 - $0.00138 (assuming steady market growth and maintained project development)
- Optimistic Scenario: $0.00107 - $0.00173 (contingent upon significant ecosystem expansion and favorable market conditions)
- Transformative Scenario: Approaching $0.00173 (requiring exceptional market circumstances, major adoption breakthroughs, and sustained bullish crypto market trends)
- February 7, 2026: DIO current market position serves as the baseline for these projections (initial assessment phase)
| Year |
Predicted High Price |
Predicted Average Price |
Predicted Low Price |
Price Change |
| 2026 |
0.00076 |
0.00064 |
0.0005 |
0 |
| 2027 |
0.00102 |
0.0007 |
0.00062 |
9 |
| 2028 |
0.00101 |
0.00086 |
0.00051 |
33 |
| 2029 |
0.00121 |
0.00093 |
0.00077 |
45 |
| 2030 |
0.00138 |
0.00107 |
0.00088 |
67 |
| 2031 |
0.00173 |
0.00123 |
0.00085 |
91 |
IV. DIO Professional Investment Strategies and Risk Management
DIO Investment Methodology
(1) Long-Term Holding Strategy
- Suitable for: Investors who believe in the GameFi sector's long-term potential and are willing to tolerate high volatility
- Operational Suggestions:
- Consider accumulating DIO tokens during market corrections when prices approach support levels
- Monitor the development progress of the Decimated game ecosystem and community growth indicators
- Store DIO tokens securely using Gate Web3 Wallet for convenient management and enhanced security
(2) Active Trading Strategy
- Technical Analysis Tools:
- Moving Averages: Use 50-day and 200-day moving averages to identify potential trend reversals and momentum shifts
- Volume Analysis: Monitor trading volume patterns to confirm price movements and detect potential breakouts
- Swing Trading Key Points:
- Pay attention to the 24-hour high ($0.0007918) and low ($0.0006) levels as potential resistance and support zones
- Consider the token's high volatility, with recent 7-day decline of 10.34% and 30-day decline of 25.18%, when setting stop-loss orders
DIO Risk Management Framework
(1) Asset Allocation Principles
- Conservative Investors: 1-2% of crypto portfolio allocation
- Aggressive Investors: 3-5% of crypto portfolio allocation
- Professional Investors: Up to 10% with active hedging strategies
(2) Risk Hedging Solutions
- Diversification Strategy: Combine DIO holdings with other gaming tokens and established cryptocurrencies to reduce concentration risk
- Stop-Loss Implementation: Set stop-loss orders at 15-20% below entry price to limit potential downside exposure
(3) Secure Storage Solutions
- Hot Wallet Recommendation: Gate Web3 Wallet for active trading and convenient access to DeFi features
- Cold Storage Solution: For long-term holdings exceeding $10,000, consider multi-signature wallets for enhanced security
- Security Precautions: Never share private keys, enable two-factor authentication, and regularly update wallet software to protect against vulnerabilities
V. DIO Potential Risks and Challenges
DIO Market Risks
- Extreme Volatility: DIO has experienced an 89.36% decline over the past year, reflecting significant market risk and price instability
- Low Liquidity: With a 24-hour trading volume of approximately $31,492 and market cap of $348,773, limited liquidity may result in high slippage during large transactions
- Market Cap Ranking: Currently ranked #3362, DIO maintains a relatively small market presence with only 0.000025% market dominance, indicating limited mainstream adoption
DIO Regulatory Risks
- Gaming Token Classification: Regulatory uncertainty surrounding blockchain gaming tokens may impact DIO's compliance status across different jurisdictions
- Securities Regulation: Potential classification as a security in certain regions could impose additional compliance requirements or trading restrictions
- Tax Implications: Earnings from gameplay and token transactions may be subject to varying tax treatments depending on local regulations
DIO Technical Risks
- Smart Contract Vulnerabilities: The token operates on the Solana blockchain (contract address: BiDB55p4G3n1fGhwKFpxsokBMqgctL4qnZpDH1bVQxMD), which carries inherent smart contract risks including potential bugs or exploits
- Game Development Risk: As Decimated is still in development, delays or failure to deliver promised features could negatively impact token value
- Competition Risk: The blockchain gaming sector faces intense competition from numerous projects, potentially affecting DIO's market position and user adoption
VI. Conclusion and Action Recommendations
DIO Investment Value Assessment
DIO presents a high-risk, high-volatility investment opportunity within the blockchain gaming sector. While the Decimated project offers an innovative post-apocalyptic multiplayer survival game concept with blockchain integration, the token has experienced considerable price decline with a 89.36% drop over the past year. The relatively small market cap of $348,773 and low liquidity suggest this is a speculative asset suitable only for risk-tolerant investors. The circulating supply of 543,259,848 tokens represents 54.33% of the maximum supply of 1 billion tokens. Long-term value depends heavily on successful game development, user adoption, and broader GameFi sector recovery.
DIO Investment Recommendations
✅ Beginners: Avoid or allocate no more than 0.5-1% of total crypto portfolio; focus on understanding blockchain gaming mechanics before investing
✅ Experienced Investors: Consider small speculative positions (2-3% of crypto portfolio) with strict stop-loss orders; monitor game development milestones closely
✅ Institutional Investors: Conduct thorough due diligence on the development team and project roadmap; consider waiting for increased liquidity and market validation before significant allocation
DIO Trading Participation Methods
- Spot Trading: Purchase DIO tokens on Gate.com and other supporting exchanges for direct exposure to price movements
- Dollar-Cost Averaging: Implement systematic purchases over time to reduce timing risk and smooth entry price across market cycles
- Community Engagement: Participate in the Decimated gaming community via Twitter and Reddit to stay informed about project updates and ecosystem developments
Cryptocurrency investment carries extremely high risk, and this article does not constitute investment advice. Investors should make prudent decisions based on their own risk tolerance and are advised to consult professional financial advisors. Never invest more than you can afford to lose.
FAQ
What is the current price of DIO token, and what are its all-time high and all-time low prices?
DIO token is currently trading at $0.000637. The all-time high price reached $0.5879 on January 3, 2022, while the all-time low was $0.078253 on December 29, 2021.
How to predict DIO price? What technical analysis methods can be referenced?
Predict DIO price using technical analysis methods such as moving averages and RSI. Analyze historical price data and candlestick charts to identify trends, support levels, and resistance levels for informed forecasting.
What are the main factors affecting DIO price fluctuations?
DIO price fluctuations are primarily driven by market demand, regulatory news, technology advances, trading volume, market sentiment, and global events. Supply and demand dynamics directly impact price movements in the cryptocurrency market.
What risks and uncertainties exist in DIO price predictions?
DIO price predictions face market volatility, regulatory uncertainty, and technical risks. Price fluctuations and market manipulation increase investment uncertainty. Network security vulnerabilities and protocol upgrades also present potential challenges to accurate forecasting.
What are professional analysts' price predictions for DIO in the future?
Professional analysts predict DIO price movements based on current market trends. WalletInvestor forecasts potential decline to $0.0006748, while PricePrediction.net suggests further downward pressure. Predictions vary by platform and timeframe analyzed.
How is the price correlation between DIO and mainstream cryptocurrencies such as BTC and ETH?
DIO shows low price correlation with BTC and ETH, operating independently in most market conditions. However, during significant market volatility, brief correlations may occur as the broader crypto market experiences coordinated movements.
* The information is not intended to be and does not constitute financial advice or any other recommendation of any sort offered or endorsed by Gate.