This comprehensive article analyzes Fireverse (FIR), an AI-powered Web3 music creation platform, providing detailed price predictions from 2026 to 2031 for cryptocurrency investors. The analysis combines historical price trends, market supply-demand dynamics, ecosystem development, and macroeconomic factors to forecast FIR's trajectory, ranging from conservative scenarios at $0.00337-$0.00462 in 2026 to optimistic projections reaching $0.01122 by 2031. The article examines FIR's current market position, including its $807,870 market cap and concentrated token distribution, identifies key risk factors such as price volatility and regulatory challenges, and presents professional investment strategies including long-term holding and active trading approaches. Designed for beginners to institutional investors, this guide emphasizes risk management, secure storage on Gate, and the importance of due diligence when participating in early-stage cryptocurrency projects within the emerging Web3 music ecosystem.
Introduction: FIR's Market Position and Investment Value
Fireverse (FIR), positioned as a decentralized music creation platform powered by AI and blockchain technology, has been revolutionizing music creation and monetization since its launch in 2025. As of February 2026, FIR maintains a market capitalization of approximately $807,870 with a circulating supply of 174.11 million tokens, trading at around $0.00464. This asset, described as a "Web3 music ecosystem enabler," is playing an increasingly significant role in the intersection of artificial intelligence, blockchain, and digital music creation.
This article provides a comprehensive analysis of FIR's price trends from 2026 to 2031, combining historical patterns, market supply-demand dynamics, ecosystem development, and macroeconomic conditions to offer professional price predictions and practical investment strategies for investors.
I. FIR Price History Review and Market Status
FIR Historical Price Evolution Trajectory
- 2025: Token launched in February at $0.081, price experienced significant growth reaching a peak of $0.13662 in August, representing approximately 68.7% increase from launch price
- 2025-2026: Following the August peak, FIR entered a correction phase, with price declining substantially through the end of 2025
- 2026: Price reached its lowest point of $0.004254 in early January, marking a decline of approximately 96.9% from the August 2025 peak
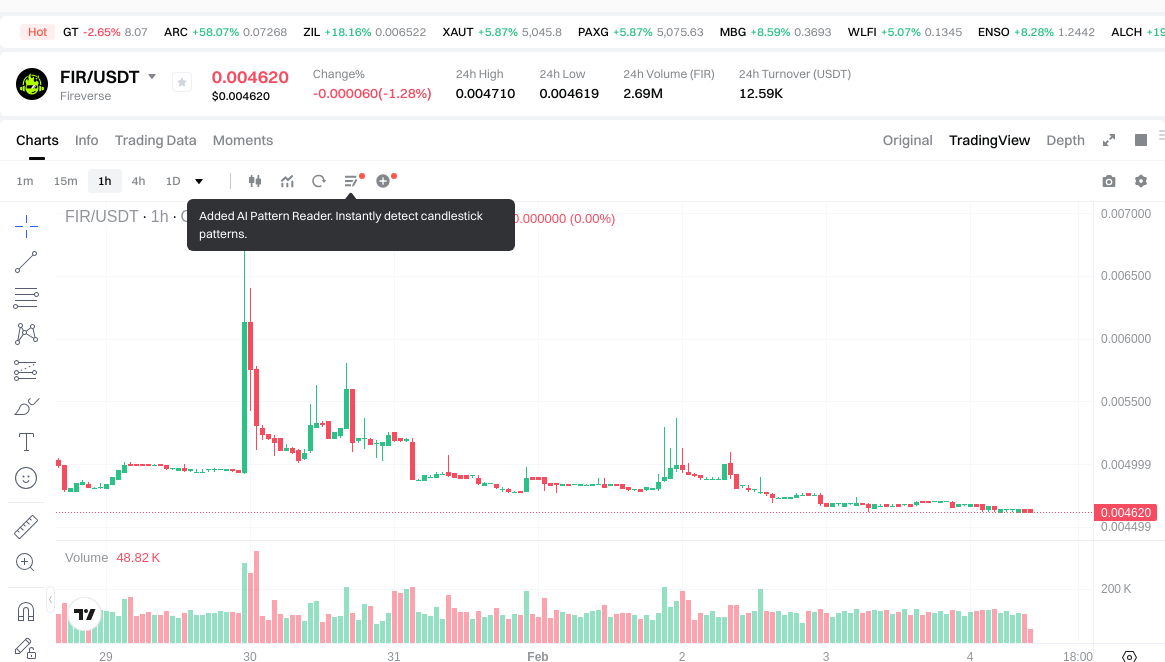
FIR Current Market Situation
As of February 4, 2026, FIR is trading at $0.00464, showing a slight recovery from the January low. The token has experienced a 0.64% decline over the past 24 hours, with trading volume reaching $12,577.55. Over shorter timeframes, FIR decreased 0.43% in the past hour, while the 7-day performance shows a 9.06% decline.
The market capitalization stands at approximately $807,870, with 174.11 million tokens in circulation, representing 17.41% of the total supply of 1 billion tokens. The fully diluted market cap is valued at $4.64 million. The token maintains a presence across 5 exchanges and has approximately 80,418 holders.
The broader market sentiment index currently sits at 14, indicating an "Extreme Fear" environment in the cryptocurrency market. FIR's market dominance remains minimal at 0.00017%, while the 24-hour trading range has been between $0.004619 and $0.00471.
Over the past year, FIR has experienced an 85.24% decline, with the 30-day performance showing a 12.05% decrease. The token operates on the BSC (Binance Smart Chain) using the BEP-20 standard.
Click to view current FIR market price
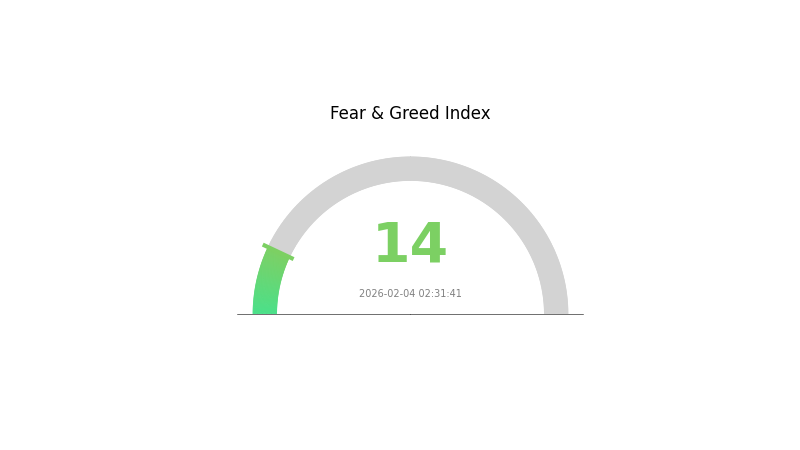
FIR Market Sentiment Index
2026-02-04 Fear and Greed Index: 14 (Extreme Fear)
Click to view current Fear & Greed Index
The cryptocurrency market is currently experiencing extreme fear, with the Fear and Greed Index plummeting to 14. This indicates significant market pessimism and widespread investor anxiety. During such periods, market volatility typically increases as risk-averse traders exit positions. However, extreme fear often presents contrarian opportunities for long-term investors seeking entry points at depressed valuations. Monitor key support levels closely, as further liquidations could occur. Consider dollar-cost averaging strategies to mitigate timing risks in this volatile environment.
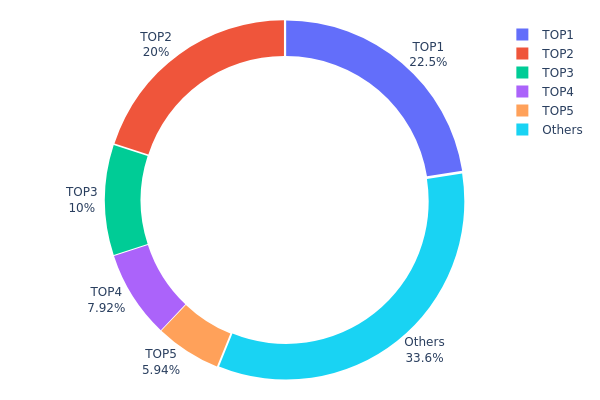
FIR Holding Distribution
The holding distribution chart illustrates the percentage of total token supply controlled by the top wallet addresses, serving as a key indicator of token concentration and decentralization levels. By analyzing the distribution pattern across major holders, we can assess the potential impact on market dynamics and price stability.
According to the current data, FIR exhibits a highly concentrated holding structure. The top five addresses collectively control 66.35% of the total supply, with the largest single address holding 22.50% (225 million tokens) and the second-largest holding 20.00% (200 million tokens). This concentration pattern suggests that a significant portion of FIR's circulating supply remains in the hands of a limited number of entities, which could potentially be early investors, project team members, or institutional participants.
Such a concentrated distribution pattern presents notable implications for market structure. The dominance of top holders creates an asymmetric power dynamic where price movements could be substantially influenced by the trading decisions of these major stakeholders. Any large-scale selling activity from top addresses could trigger significant downward pressure, while their holding behavior may also restrict available liquidity in the open market. However, the remaining 33.65% distributed among other addresses indicates some degree of retail participation, suggesting that the token has achieved partial circulation beyond initial core holders.
Click to view current FIR Holding Distribution
| Top |
Address |
Holding Qty |
Holding (%) |
| 1 |
0x55d0...913233 |
225000.00K |
22.50% |
| 2 |
0xf582...7f6a9b |
200000.00K |
20.00% |
| 3 |
0x869a...85aeb7 |
100000.00K |
10.00% |
| 4 |
0xcbfe...b1e5a2 |
79166.66K |
7.91% |
| 5 |
0x6510...47da7c |
59416.29K |
5.94% |
| - |
Others |
336417.05K |
33.65% |
II. Core Factors Influencing FIR's Future Price
Supply Mechanism
-
Market Demand and Supply Dynamics: Supply mechanisms play a fundamental role in determining price movements. When demand exceeds supply, inventory levels typically decline, often leading to upward price pressure in the near term. Conversely, when supply outpaces demand, inventory accumulation may exert downward pressure on prices.
-
Historical Patterns: Historical commodity price cycles demonstrate that supply-demand imbalances during economic recovery phases frequently result in price appreciation. Past cycles have shown that supply constraints, whether driven by production limitations or distribution disruptions, tend to create persistent gaps that support sustained price levels.
-
Current Impact: Supply dynamics remain influenced by multiple structural factors. Global supply chain conditions, production capacity constraints, and inventory management practices continue to shape the equilibrium between available supply and market demand. The pace of supply restoration relative to demand growth will likely remain a key determinant of near-term price direction.
Macroeconomic Environment
-
Monetary Policy Influence: Central bank policies, particularly regarding interest rates and liquidity provision, represent significant macroeconomic factors affecting asset markets. The stance of major central banks, including adjustments to policy rates and balance sheet management, influences financial conditions and capital flows across various asset classes.
-
Inflation Dynamics: Inflation levels, economic growth trajectories, and employment conditions constitute core variables in macroeconomic assessments. Current economic data suggest that inflation trends, labor market conditions, and overall economic activity patterns continue to evolve. The interplay between these factors shapes broader market expectations and risk appetite.
-
Geopolitical Considerations: International developments, including policy changes, trade dynamics, and regional developments, can influence market sentiment and capital allocation decisions. Geopolitical factors may affect supply chains, regulatory frameworks, and cross-border economic relationships, thereby creating potential impacts on various markets.
Technology Development and Ecosystem Construction
-
Technical Innovation: Technology advancement and innovation cycles represent important long-term factors. Improvements in production processes, operational efficiency enhancements, and the adoption of new technologies can influence cost structures and competitive dynamics within industries.
-
Ecosystem Growth: The development of supporting infrastructure, complementary services, and broader ecosystem participation contributes to long-term sustainability. Ecosystem maturation involves the expansion of use cases, enhancement of network effects, and deepening of market participation across different stakeholder groups.
-
Adoption Trends: The pace and scale of technology adoption, infrastructure deployment, and market integration affect the trajectory of ecosystem development. Market participants monitor adoption metrics, implementation progress, and the expansion of practical applications as indicators of long-term viability and growth potential.
III. 2026-2031 FIR Price Prediction
2026 Outlook
- Conservative forecast: $0.00337 - $0.00462
- Neutral forecast: $0.00462 (average price level)
- Optimistic forecast: $0.00582 (requires favorable market conditions)
2027-2029 Outlook
- Market stage expectation: FIR is anticipated to enter a gradual growth phase, with price fluctuations showing moderate upward momentum as the token seeks broader market recognition.
- Price range forecast:
- 2027: $0.00355 - $0.00574, with an expected average of $0.00522 (12% price change)
- 2028: $0.00455 - $0.00576, with an expected average of $0.00548 (18% price change)
- 2029: $0.00461 - $0.0073, with an expected average of $0.00562 (21% price change)
- Key catalysts: Progressive price increases may be driven by incremental adoption, ecosystem development, and overall cryptocurrency market sentiment during this period.
2030-2031 Long-term Outlook
- Baseline scenario: $0.00601 - $0.00646 by 2030 (assuming steady market conditions and continued project development, representing a 39% price change)
- Optimistic scenario: $0.00513 - $0.00801 by 2031 (assuming enhanced ecosystem utility and increased market participation)
- Transformative scenario: $0.01122 by 2031 (under exceptionally favorable conditions including widespread adoption and significant market expansion, representing a 72% price change)
- February 4, 2026: FIR trading within the projected range of $0.00337 - $0.00582 (early-stage valuation phase)
| Year |
Predicted High Price |
Predicted Average Price |
Predicted Low Price |
Price Change |
| 2026 |
0.00582 |
0.00462 |
0.00337 |
0 |
| 2027 |
0.00574 |
0.00522 |
0.00355 |
12 |
| 2028 |
0.00576 |
0.00548 |
0.00455 |
18 |
| 2029 |
0.0073 |
0.00562 |
0.00461 |
21 |
| 2030 |
0.00956 |
0.00646 |
0.00601 |
39 |
| 2031 |
0.01122 |
0.00801 |
0.00513 |
72 |
IV. FIR Professional Investment Strategies and Risk Management
FIR Investment Methodology
(1) Long-term Holding Strategy
- Suitable for: Investors who believe in the Web3 music ecosystem and AI-driven content creation
- Operational Recommendations:
- Consider gradual position building during market corrections to mitigate entry risk
- Monitor project development milestones, including AI music generation features and platform user growth
- Secure storage solution: Use Gate Web3 Wallet for enhanced security and convenient asset management
(2) Active Trading Strategy
- Technical Analysis Tools:
- Volume Analysis: Monitor the 24-hour trading volume (currently $12,577.55) to identify potential trend reversals
- Support and Resistance Levels: Track the 24-hour range between $0.004619 and $0.00471 for entry and exit points
- Swing Trading Essentials:
- Set stop-loss orders to limit downside risk, especially given recent price volatility
- Consider taking partial profits during recovery rallies to lock in gains
FIR Risk Management Framework
(1) Asset Allocation Principles
- Conservative Investors: 1-2% of crypto portfolio
- Aggressive Investors: 3-5% of crypto portfolio
- Professional Investors: Up to 7% of crypto portfolio with active hedging strategies
(2) Risk Hedging Solutions
- Portfolio Diversification: Balance FIR holdings with established cryptocurrencies and stablecoins
- Position Sizing: Limit single-token exposure to prevent concentration risk
(3) Secure Storage Solutions
- Hot Wallet Recommendation: Gate Web3 Wallet for daily trading and quick access
- Cold Storage Option: Hardware wallet solutions for long-term holdings
- Security Precautions: Enable two-factor authentication, regularly update security settings, and never share private keys
V. FIR Potential Risks and Challenges
FIR Market Risks
- Price Volatility: FIR has experienced significant fluctuations, with a 1-year decline of 85.24%, indicating high market volatility
- Low Liquidity: With a 24-hour trading volume of approximately $12,577.55, the token may face liquidity constraints
- Market Cap Risk: The current market cap of $807,870.4 represents a relatively small position in the broader crypto market
FIR Regulatory Risks
- Music Copyright Compliance: Evolving regulations around AI-generated content and blockchain-based copyright protection may impact platform operations
- Token Classification: Regulatory uncertainty regarding token incentive mechanisms could affect the project's operational model
- Cross-border Regulatory Challenges: Decentralized music platforms may face varying regulatory requirements across different jurisdictions
FIR Technical Risks
- Smart Contract Vulnerabilities: As a BEP-20 token on BSC, FIR is subject to potential smart contract security issues
- Platform Adoption Risk: The success of the AI music generation platform depends on user adoption and engagement
- Integration Challenges: Technical complexities in combining AI technology with blockchain infrastructure may affect platform performance
VI. Conclusion and Action Recommendations
FIR Investment Value Assessment
FIR presents an innovative approach to music creation through AI and blockchain integration, targeting the emerging Web3 music ecosystem. However, the token has experienced considerable price decline (down 85.24% over the past year) and maintains a relatively small market presence with limited trading volume. While the project's focus on AI-driven content creation and decentralized copyright protection aligns with industry trends, investors should carefully weigh the high-risk nature of this early-stage token against potential long-term opportunities in the digital music space.
FIR Investment Recommendations
✅ Beginners: Exercise extreme caution; if interested, allocate only a minimal portion (less than 1%) of your crypto portfolio and focus on learning about the project fundamentals
✅ Experienced Investors: Consider small speculative positions with strict risk management; monitor platform development and user growth metrics closely
✅ Institutional Investors: Conduct thorough due diligence on the project's technology stack, team credentials, and market positioning before any allocation
FIR Trading Participation Methods
- Spot Trading: Purchase FIR directly on Gate.com and other supported exchanges with available liquidity
- Dollar-Cost Averaging: Gradually accumulate positions over time to reduce timing risk
- Active Monitoring: Stay informed about project updates, partnership announcements, and platform milestones through official channels
Cryptocurrency investment carries extremely high risks, and this article does not constitute investment advice. Investors should make prudent decisions based on their own risk tolerance and are advised to consult professional financial advisors. Never invest more than you can afford to lose.
FAQ
What is FIR? What are the basic concepts of FIR price prediction?
FIR is the Fireverse token powering its ecosystem. FIR price prediction analyzes supply dynamics, market trends, and adoption rates. Analysts track tokenomics, sentiment shifts, and broader crypto market conditions to forecast FIR's future price movements and market potential.
What are the main factors affecting FIR price?
FIR price is influenced by market demand, trading volume, project development progress, regulatory environment, macroeconomic conditions, and sentiment in the crypto market.
Use Fireverse prediction tool by inputting expected growth percentage and clicking calculate button. Common methods include technical analysis examining price charts and trading volume trends, plus fundamental analysis evaluating project developments and market conditions.
What are the risks and limitations of FIR price prediction?
FIR price prediction faces risks from market volatility, limited historical data, and external factors like regulatory changes and macroeconomic conditions. Predictions may not account for sudden market shifts or technological developments, limiting accuracy and reliability.
What are professional analysts' predictions for FIR's future price?
Professional analysts project FIR will experience continued upward momentum over the next twelve months, driven by strengthening market fundamentals and increasing adoption. However, specific price targets remain subject to market volatility and evolving conditions.
How is FIR's price correlation with other cryptocurrencies and assets?
FIR shows strong price correlation with major cryptocurrencies and financial assets, though correlation intensity varies with market conditions. Market sentiment and significant news events significantly influence its price correlation dynamics across different time periods.
What do FIR's past price fluctuation trends and historical data indicate?
FIR demonstrates significant volatility, with a 2.18% increase over 24 hours but a 10.80% decline over 7 days. This historical pattern reflects market dynamics and trader sentiment, suggesting FIR remains an active trading asset with notable price movements driven by market demand and transaction volume.
* The information is not intended to be and does not constitute financial advice or any other recommendation of any sort offered or endorsed by Gate.