Trading Indicators: What They Are and How They Work

2026-02-04 05:01:49
Crypto Trading
Crypto Tutorial
Spot Trading
Trading Bots
Article Rating : 5
28 ratings
Top Indicators for Crypto Trading in 2024: MA, Bollinger Bands, RSI, MACD, Stochastic. Discover how to leverage leading technical indicators for cryptocurrency analysis on Gate. This comprehensive guide serves both novice and seasoned traders.
Trading Indicators: What They Are and How They Work

Understanding Indicators in Trading

Indicators are specialized technical analysis tools that enable traders to assess current market conditions and forecast potential future movements. These mathematical algorithms process historical price, trading volume, and other market data, turning them into intuitive visual signals.

Charles Dow, journalist and founder of Dow Jones, is widely regarded as the father of technical analysis. In 1896, he introduced the iconic Dow Jones Index. Dow theorized that tracking the movements of leading stocks would help investors gauge the overall market’s health—a view that proved entirely accurate. His approach laid the groundwork for modern technical analysis.

Today's market indicators follow similar principles but offer far greater functionality. Traders use them to automate the collection and analysis of asset data: tracking price shifts, examining trading volumes, evaluating investor interest, and more. This streamlines the process and reduces errors associated with manual data analysis.

Each indicator uses a mathematical algorithm to process market data and visualize results. Most commonly, these results appear as lines, histograms, or other graphical forms on price charts. Investors rely on these signals to make entry decisions, adjust positions, and plan future trades.

Some market indicators feature signal repainting, meaning they can revise previously issued signals as new data becomes available. Traders should factor this in when developing strategies, as historical signals from such tools may differ from those shown in real time.

Types of Indicators

Trading indicators fall into several main categories based on their function and methodology. Understanding these differences helps traders choose the right analysis tools for each market scenario.

Trend Indicators

Trend indicators primarily show who currently controls the market: bulls (buyers) or bears (sellers). They also help gauge the strength of an active trend. For example, weakening bullish momentum may signal that sellers are about to take over, potentially driving the asset’s price downward.

Trend indicators typically rely on integral algorithms to average market data and filter out noise. This enables clear long-term trend formation and helps avoid false signals from short-term price swings. These indicators work best in markets with strong directional movement.

Popular trend indicators include:

  • Moving Averages (MA) – a straightforward yet effective tool that smooths price fluctuations and displays the average price over a selected timeframe
  • Bollinger Bands (BB) – a volatility indicator with three lines that expand and contract in response to market activity
  • Average Directional Movement Index (ADX) – measures trend strength regardless of its direction, helping traders decide when to use trend-following strategies

Most of these indicators are available in multiple versions. For instance, different Bollinger Bands variants may factor in or disregard data from other indicators when generating signals, allowing traders to tailor tools to their specific needs.

Oscillators

Oscillators help traders spot short-term trends and potential price reversals. Unlike trend indicators—which excel during strong directional moves—oscillators are designed for range-bound markets (“flat” periods), when prices fluctuate within a set range without a defined trend.

Oscillators use differential algorithms to detect subtle shifts in market sentiment. Their main purpose is to track overbought and oversold conditions. When an oscillator reaches extreme levels, it may signal an upcoming price reversal.

Traders often call oscillators leading indicators, as they typically change direction ahead of price action. Used strategically, this feature enables traders to anticipate new market moves and enter positions before major price swings start.

Popular oscillators include:

  • Moving Average Convergence Divergence (MACD) – reveals the relationship between two moving averages and identifies trend changes
  • Relative Strength Index (RSI) – measures the speed and magnitude of price movements, highlighting overbought and oversold levels
  • Stochastic Oscillator – compares the current closing price to the price range over a specified period

One major subgroup of oscillators is volume indicators. These show traders the level of market activity and how engaged participants are with a specific asset. This data supports better investment decisions and precise risk assessment. High trading volumes usually confirm trend strength, while low volumes may indicate weakness.

Examples of volume indicators:

  • On Balance Volume (OBV) – a cumulative indicator connecting trading volume to price changes
  • Money Flow Index (MFI) – a volume-weighted indicator showing buying and selling pressure
  • Accumulation/Distribution – identifies whether an asset is being accumulated (bought) or distributed (sold)

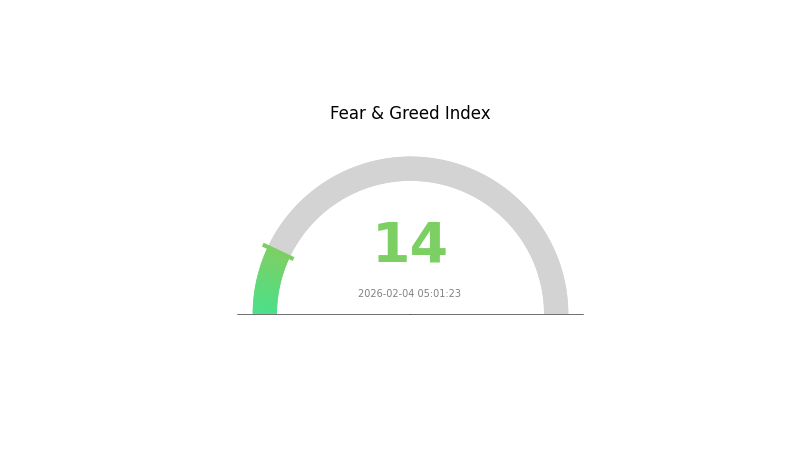
Other specialized tools exist outside the main indicator categories. For instance, many traders use the Fear and Greed Index, which analyzes market sentiment using various factors to determine whether the market is in a state of euphoria or panic. image_url

How to Use Indicators

Experienced traders often use multiple indicators from different categories in tandem. This approach offers a more complete market view and supports better decision-making when adjusting trading operations. Relying on a single indicator can result in false signals and losses.

There is no universal formula for the ideal indicator combination. Every trader develops unique preferences and effective instrument mixes tailored to their strategy. Some pair MACD with the Stochastic Oscillator, others combine RSI with Bollinger Bands, and some add volume indicators for confirmation.

When selecting indicators, consider key principles. First, combine different types—for example, a trend indicator with an oscillator—to get confirming signals and reduce false entries. Second, avoid cluttering your chart with too many indicators, as this can lead to conflicting data and harder analysis.

Keep in mind that indicators are support tools—they do not guarantee profits. They aid in market analysis and informed decision-making. Successful trading relies on a holistic approach, including risk management, psychological discipline, and continuous strategy improvement. Always test chosen indicator combinations on historical data before using them in real trading.

FAQ

What Are Trading Indicators and How Do They Help Traders Make Decisions?

Trading indicators are mathematical tools that analyze price and volume data to identify market trends. They help traders pinpoint optimal entry and exit points, assess trend strength, and make informed, data-driven decisions.

What Are the Most Common Technical Indicators? (Such as Moving Averages, RSI, MACD, etc.)

Key technical indicators include Moving Averages (MA) for trend identification, Relative Strength Index (RSI) for momentum analysis, MACD for price dynamics, and Bollinger Bands for support and resistance levels. These tools help traders analyze charts and make sound decisions.

How Should Trading Indicators Be Used to Identify Buy and Sell Signals?

Watch for moving average crossovers to spot trends, use RSI to identify overbought and oversold levels, analyze Bollinger Bands for volatility, and monitor trading volume changes to validate signals.

What Are the Benefits of Using Multiple Indicators Together? How Should They Be Combined?

Combining indicators enables deeper market analysis, reduces false signals, and improves entry accuracy. For maximum trading efficiency, pair complementary instruments such as technical and fundamental indicators.

What Are the Limitations and Risks of Technical Indicators? How Can You Avoid Overreliance?

Indicators can lag behind the market and may produce false signals. Avoid relying on a single indicator—use a combination of signals. Incorporate volume, support levels, and market context analysis for more reliable results.

Which Basic Indicators Should Beginner Traders Learn? Where Should They Start?

Begin with the fundamentals: learn order types, read candlestick charts, and identify support and resistance. Then study simple indicators—moving averages, RSI, MACD. Always apply risk management and practice on a demo account before trading live.

* The information is not intended to be and does not constitute financial advice or any other recommendation of any sort offered or endorsed by Gate.
Related Articles
How to Withdraw Money from Crypto Exchanges in 2025: A Beginner's Guide

How to Withdraw Money from Crypto Exchanges in 2025: A Beginner's Guide

Navigating the crypto exchange withdrawal process in 2025 can be daunting. This guide demystifies how to withdraw money from exchanges, exploring secure cryptocurrency withdrawal methods, comparing fees, and offering the fastest ways to access your funds. We'll tackle common issues and provide expert tips for a smooth experience in today's evolving crypto landscape.
2025-04-28 03:12:00
5 ways to get Bitcoin for free in 2025: Newbie Guide

5 ways to get Bitcoin for free in 2025: Newbie Guide

In 2025, getting Bitcoin for free has become a hot topic. From microtasks to gamified mining, to Bitcoin reward credit cards, there are numerous ways to obtain free Bitcoin. This article will reveal how to easily earn Bitcoin in 2025, explore the best Bitcoin faucets, and share Bitcoin mining techniques that require no investment. Whether you are a newbie or an experienced user, you can find a suitable way to get rich with cryptocurrency here.
2025-04-30 06:45:39
Treasure NFT Marketplace: A 2025 Guide for Web3 Gamers and Investors

Treasure NFT Marketplace: A 2025 Guide for Web3 Gamers and Investors

In 2025, the Treasure NFT marketplace stands at the forefront of the Web3 gaming revolution. As investors seek to capitalize on this booming ecosystem, understanding the intricacies of Treasure NFTs becomes crucial. From rarity assessment to cross-game integration, this article explores how Treasure NFTs are reshaping digital ownership and value in the gaming world.
2025-04-30 03:08:10
What Is TOAD Coin and How Does Its Tokenomics Work?

What Is TOAD Coin and How Does Its Tokenomics Work?

Dive into the fascinating world of TOAD cryptocurrency with our comprehensive fundamental analysis. From the Acid Toad project evaluation to TOAD price predictions, we'll explore this Ethereum ecosystem token's unique economics and investment potential. Discover why this meme coin is making waves in the crypto space and what it means for your portfolio.
2025-04-22 09:40:38
Crypto Assets Beginner's Guide: How to Buy, Store, and Trade Your First Crypto Coin

Crypto Assets Beginner's Guide: How to Buy, Store, and Trade Your First Crypto Coin

Crypto assets have swept the financial world, providing a decentralized alternative to traditional currencies. If you are new to the crypto space, the process of buying, storing, and trading your first crypto coin may seem daunting. This beginner-friendly guide will lead you through the important steps for getting started in 2025, ensuring you are confident in the crypto asset market. Let's get started!
2025-04-17 13:57:52
What Is the Best AI Crypto in 2025?

What Is the Best AI Crypto in 2025?

The AI crypto revolution is reshaping the digital landscape in 2025. From the best AI crypto projects to top AI-powered blockchain platforms, artificial intelligence in cryptocurrency is driving innovation. Machine learning for crypto trading and AI-driven market analysis are transforming how we interact with digital assets, promising a future where technology and finance converge seamlessly.
2025-05-13 02:47:20
Recommended for You
What is OOE: A Comprehensive Guide to Object-Oriented Engineering and Its Applications in Modern Software Development

What is OOE: A Comprehensive Guide to Object-Oriented Engineering and Its Applications in Modern Software Development

OpenOcean (OOE) is a comprehensive blockchain-based aggregation platform launched in 2021 to solve fragmented liquidity across decentralized and centralized exchanges. This guide explores how OpenOcean optimizes crypto trading through intelligent routing algorithms that minimize slippage and provide optimal execution prices. Discover the platform's decentralized architecture, security mechanisms powered by public-private key cryptography, and multi-chain deployment across major blockchains. Learn about OOE's market performance, utility token functions including governance and liquidity mining rewards, and its active ecosystem with over 8,000 token holders. The article covers practical applications in DeFi trading, strategic partnerships, participation methods on Gate, and OpenOcean's roadmap for becoming a leading aggregation platform. Whether you're a trader seeking efficient execution or a developer exploring integration opportunities, this comprehensive guide demonstrates why OpenOcean represents a valuabl
2026-02-04 06:42:07
What is MCRT: A Comprehensive Guide to Monte Carlo Ray Tracing in Modern Graphics Rendering

What is MCRT: A Comprehensive Guide to Monte Carlo Ray Tracing in Modern Graphics Rendering

MagicCraft (MCRT) is a blockchain-based PvP Castle Siege MMORPG launched on Binance Smart Chain in 2021, designed to provide players with skill-based competitive gaming and genuine digital asset ownership. This comprehensive guide examines MCRT's technical architecture built on BSC's PoSA consensus mechanism, market performance showing 5.04 billion circulating tokens across 17,716 holders, and ecosystem applications centered on play-to-earn mechanics and guild-based warfare. The article analyzes MCRT's price volatility, on-chain metrics with current market cap of $779,421, and community engagement on X platform. It addresses challenges including market fluctuations and competitive pressures while detailing participation methods through Gate and other exchanges. Whether exploring GameFi opportunities or researching blockchain gaming projects, this guide provides essential insights into MagicCraft's position within the evolving gaming and cryptocurrency landscape.
2026-02-04 06:41:16
What is ZKWASM: A Comprehensive Guide to Zero-Knowledge WebAssembly Technology

What is ZKWASM: A Comprehensive Guide to Zero-Knowledge WebAssembly Technology

ZKWASM is a groundbreaking zero-knowledge WebAssembly virtual machine developed by Delphinus Lab that enables verifiable off-chain computation and scalable blockchain infrastructure. As the first open-source VM supporting zero-knowledge proof generation for WebAssembly, ZKWASM addresses critical challenges in verifiable dApps and modular rollup architecture. Backed by top-tier investors including HashKey Capital and Mirana Ventures, the ecosystem features a zk-native Launchpad for deploying provable applications. This comprehensive guide explores ZKWASM's technical architecture combining cryptographic proofs with WebAssembly compatibility, analyzes market performance and on-chain metrics, and examines its strategic partnerships and real-world applications. Whether for developers building trustless applications or investors exploring zero-knowledge infrastructure on Gate.com, this article provides essential insights into ZKWASM's positioning, capabilities, and potential within the evolving Web3 landscape.
2026-02-04 06:41:07
Miner viruses: what are they and how to remove a miner from your PC

Miner viruses: what are they and how to remove a miner from your PC

Discover what a crypto miner virus is, how it works, common infection vectors, warning signs, and removal strategies. This complete guide provides proven methods to safeguard your computer and smartphone from cryptojacking, including practical instructions and expert recommendations.
2026-02-04 06:40:16
2026 HOUSE Price Prediction: Expert Analysis and Market Trends for the Coming Year

2026 HOUSE Price Prediction: Expert Analysis and Market Trends for the Coming Year

This article provides comprehensive price analysis for Housecoin (HOUSE), a meme-themed cryptocurrency hedging the real estate market launched in 2025. It examines HOUSE's market position, historical price trajectory from $0.33 peak to current $0.0007697 levels, and core influencing factors including supply dynamics, macroeconomic conditions, and demographic trends. The analysis offers detailed price predictions through 2031, with 2026 targeting $0.00043-$0.00096 range. Professional investment strategies cover long-term holding and active trading approaches, alongside comprehensive risk management frameworks and secure storage solutions via Gate Web3 Wallet. The article addresses market volatility, liquidity constraints, and regulatory uncertainties while providing actionable investment recommendations tailored to different investor profiles, from beginners to institutional participants seeking exposure to this speculative meme asset.
2026-02-04 06:33:27
2026 ZKWASM Price Prediction: Expert Analysis and Future Market Outlook for Zero-Knowledge WebAssembly Token

2026 ZKWASM Price Prediction: Expert Analysis and Future Market Outlook for Zero-Knowledge WebAssembly Token

This comprehensive analysis examines ZKWASM's price trajectory from 2026 to 2031, combining historical market data, supply-demand dynamics, and ecosystem development factors. Currently trading at $0.006457 with a market cap of $777,183, ZKWASM serves as the first open-source virtual machine enabling zero-knowledge proofs for WebAssembly. The article projects conservative forecasts of $0.00473-$0.00648 for 2026 and optimistic scenarios reaching $0.01793 by 2031. Key investment strategies include long-term holding for believers in zk-infrastructure and active trading approaches with proper risk management. However, investors should carefully assess high volatility (84.23% annual decline), limited liquidity, regulatory uncertainties, and concentrated token holdings before participation on Gate exchange.
2026-02-04 06:32:31