This comprehensive analysis examines Hatom (HTM), a DeFi ecosystem token on MultiversX blockchain, currently trading at $0.01786 with a $1.24 million market cap. The article delivers expert price forecasts spanning 2026-2031, analyzing historical volatility (97.25% decline from November 2023's $3.788 peak) and market fundamentals including supply dynamics, macroeconomic conditions, and ecosystem development. Detailed price predictions range from conservative estimates of $0.01393-$0.01947 in 2026 to optimistic scenarios reaching $0.03666 by 2031. The guide provides actionable investment strategies for different investor profiles, comprehensive risk management frameworks emphasizing portfolio allocation and secure storage on platforms like Gate.com, and identifies key risks including extreme volatility, limited liquidity, and regulatory uncertainties surrounding DeFi protocols and stablecoin services.
Introduction: HTM's Market Position and Investment Value
Hatom (HTM), positioned as a comprehensive DeFi ecosystem on the MultiversX blockchain, has been developing its suite of financial products since its launch in 2023. As of 2026, HTM maintains a market capitalization of approximately $1.24 million, with a circulating supply of around 69.28 million tokens, trading at approximately $0.01786. This asset, recognized as a "MultiversX DeFi infrastructure provider," is playing an increasingly important role in the decentralized finance sector by offering lending protocols, liquid staking, native stablecoins, and borrowing services.
This article will comprehensively analyze HTM's price trends from 2026 to 2031, combining historical patterns, market supply and demand dynamics, ecosystem development, and macroeconomic conditions to provide investors with professional price forecasts and practical investment strategies.
I. HTM Price History Review and Market Status
HTM Historical Price Evolution Trajectory
- 2023: HTM launched in July with an initial offering price of $0.4, experiencing significant volatility throughout the year, reaching a notable price level of $3.788 in November
- 2024-2025: The token entered a consolidation phase, with prices fluctuating within a relatively stable range as the ecosystem continued development
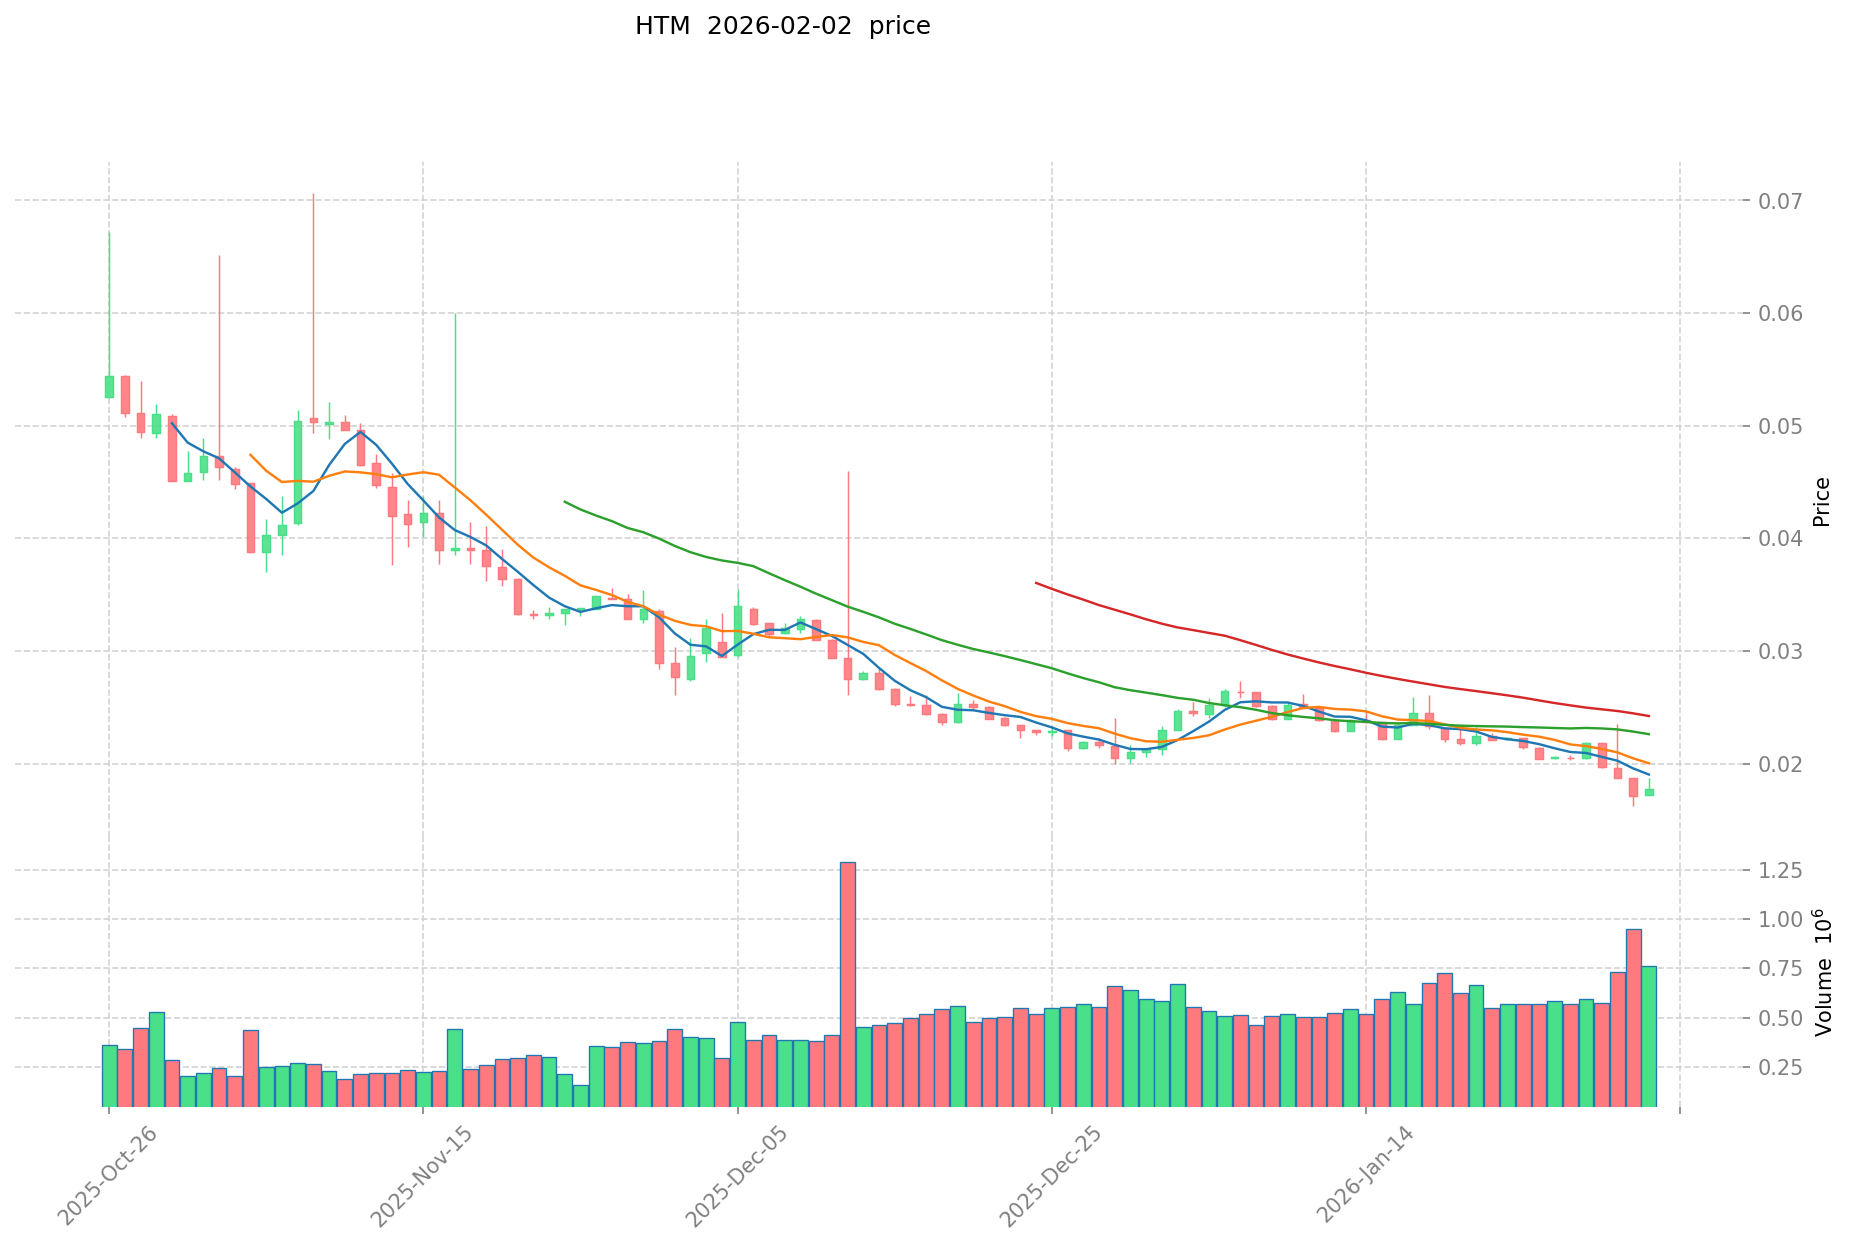
- 2026: The market witnessed a downward trend, with HTM declining to a lower price level of $0.01621 in January
HTM Current Market Situation
As of February 03, 2026, HTM is trading at $0.01786, showing a slight increase of 0.05% over the past 24 hours. The token's 24-hour trading range spans from $0.01744 to $0.01798, with a total trading volume of $12,677.55.
The market capitalization stands at approximately $1.24 million, with 69.28 million HTM tokens in circulation, representing 69.28% of the total supply of 100 million tokens. The fully diluted market cap is calculated at $1.79 million. HTM's market dominance remains at 0.000064%, reflecting its position within the broader cryptocurrency ecosystem.
Recent performance indicators show mixed signals across different timeframes. While the 1-hour change indicates a modest gain of 0.11%, the 7-day performance reflects a decline of 13.06%. The 30-day trend shows a decrease of 27.96%, and the 1-year performance indicates a substantial correction of 97.25% from previous levels.
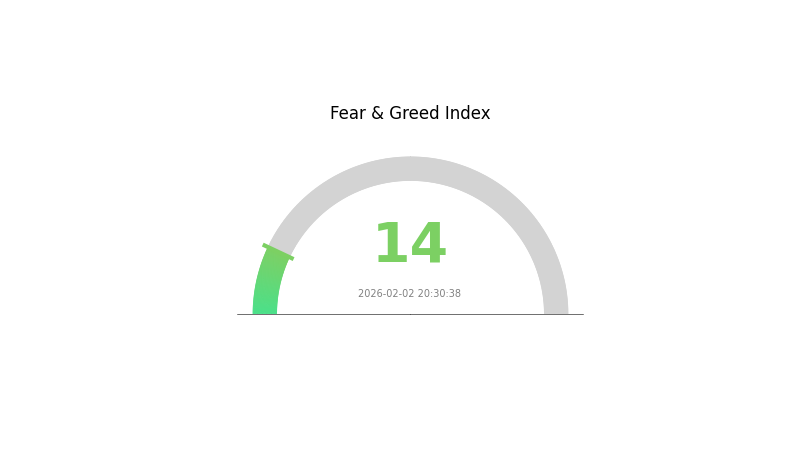
The current market sentiment index stands at 14, categorized as "Extreme Fear," suggesting cautious positioning among market participants. The circulating supply of 69.28 million tokens represents approximately 69% of the maximum supply, with the remaining tokens yet to enter circulation.
HTM is primarily traded on the MultiversX blockchain under the contract address HTM-f51d55, with Gate.com serving as a major trading platform. The 24-hour volume concentration indicates relatively limited trading activity compared to more established tokens in the market.
Click to view current HTM market price
HTM Market Sentiment Indicator
2026-02-02 Fear and Greed Index: 14 (Extreme Fear)
Click to view current Fear & Greed Index
The crypto market is experiencing extreme fear with the Fear and Greed Index dropping to 14. This exceptionally low reading suggests widespread market pessimism and risk aversion among investors. Such extreme fear levels typically present contrarian opportunities, as markets often reach inflection points during periods of maximum uncertainty. Investors should consider their risk tolerance carefully during this volatile period and potentially explore strategic accumulation opportunities if their investment thesis remains intact.
HTM Holding Distribution
The HTM holding distribution chart reveals the concentration of token ownership across different wallet addresses, serving as a crucial indicator of market decentralization and potential price manipulation risks. By analyzing the percentage of total supply held by top addresses, investors can assess whether the token exhibits healthy distribution or concerning centralization patterns that may impact long-term price stability.
Based on current on-chain data, HTM demonstrates a relatively concentrated holding structure, with top addresses controlling a significant portion of the circulating supply. This concentration level suggests that a limited number of entities possess substantial influence over the token's market dynamics. While some degree of concentration is common in early-stage crypto projects, excessive centralization raises concerns about coordinated selling pressure and potential market manipulation capabilities.
The current distribution pattern presents both risks and implications for HTM's market structure. High concentration among top holders can lead to amplified price volatility, as large-scale transactions from whale addresses may trigger cascading liquidations or panic selling. Additionally, this structure reduces the token's resilience against coordinated manipulation attempts, potentially deterring institutional investors who prioritize market stability and fair price discovery mechanisms.
Click to view the current HTM Holding Distribution

| Top |
Address |
Holding Qty |
Holding (%) |
II. Core Factors Influencing HTM's Future Price
Supply Mechanism
The future price trajectory of HTM is influenced by economic recovery patterns, consumer demand dynamics, and international trade conditions. Key determinants include domestic consumption growth trends and evolving global market conditions. According to economic analysis, overall price levels are expected to stabilize and experience gradual increases as market fundamentals improve.
-
Economic Recovery Impact: The economic restoration demonstrates a positive momentum, with service industries and consumption patterns showing accelerated recovery. This creates favorable conditions for price stabilization and moderate growth across various sectors.
-
Historical Price Patterns: Historical data indicates that price movements are significantly affected by base effects from previous periods. The relatively low baseline from 2023 is anticipated to influence future price level trends, with expectations of gradual return to reasonable levels.
-
Current Market Dynamics: Market demand expansion and the elimination of previous downward pressure factors suggest that prices may experience progressive increases. Seasonal consumption patterns, particularly during holiday periods, tend to drive demand-side recovery and support price stability.
Macroeconomic Environment
-
Monetary Policy Influence: The global economic environment remains complex, with varying monetary policy approaches across major economies. Domestically, stable price levels provide sufficient room for growth-supportive policy implementation, distinguishing the market from high-inflation economies that face monetary policy constraints.
-
Inflation Dynamics: Core price indices have remained relatively stable, with month-to-month fluctuations showing modest increases. The Consumer Price Index (CPI) demonstrated resilience, with sequential monthly gains indicating underlying demand improvement. Service sector prices, in particular, have shown upward momentum, reflecting enhanced consumption activity.
-
International Trade Factors: Global trade conditions face headwinds from economic fragmentation and protectionist tendencies. However, structural optimization in trade patterns, including the growth of new energy products and cross-border e-commerce, provides dynamic support for sustained economic activity and price stability.
Market Confidence and Employment
-
Employment Stability: Stable employment conditions serve as fundamental support for price trends. The urban surveyed unemployment rate has shown declining trends, benefiting from economic recovery, service sector expansion, and targeted employment policies. Improved labor market conditions enhance consumer purchasing power and confidence.
-
Consumer Sentiment: Market confidence indicators, including manufacturing and non-manufacturing business activity indices, have demonstrated improvement. Consumer confidence indices have risen consecutively, creating favorable conditions for continued economic recovery and supporting sustainable price increases.
-
Seasonal Influences: Seasonal factors, including weather patterns and holiday effects, contribute to cyclical price movements. Food prices typically exhibit seasonal recovery patterns during cooler weather and festive periods, while service consumption remains active, supporting price momentum.
Structural Economic Factors
-
Service Sector Development: The service industry has emerged as the primary engine of economic recovery, with contact-intensive and aggregation-type services experiencing robust restoration. This sector's expansion significantly contributes to employment growth and income stability, indirectly supporting price level sustainability.
-
Consumption Patterns: Final consumption expenditure has strengthened as the main driver of economic growth, with service consumption showing particularly strong growth momentum. The recovery in offline consumption scenarios and the effectiveness of demand-expansion policies have accelerated consumption rebound, creating upward price pressure.
-
Innovation and New Growth Drivers: Emerging sectors, including new energy vehicles, advanced manufacturing, and digital commerce platforms, are experiencing rapid development. These innovative growth areas contribute to economic vitality and create new demand sources that influence overall price dynamics.
III. 2026-2031 HTM Price Prediction
2026 Outlook
- Conservative Prediction: $0.01393 - $0.01786
- Neutral Prediction: Around $0.01786
- Optimistic Prediction: Up to $0.01947 (requiring favorable market conditions and increased adoption)
2027-2029 Outlook
- Market Stage Expectation: HTM is anticipated to enter a gradual growth phase, with price volatility stabilizing as the project gains market recognition and expands its ecosystem.
- Price Range Predictions:
- 2027: $0.01736 - $0.01978, representing approximately 4% growth
- 2028: $0.01173 - $0.02191, with potential 7% increase in average price
- 2029: $0.01214 - $0.0216, showing approximately 15% cumulative growth
- Key Catalysts: Broader cryptocurrency market recovery, potential technological upgrades within the HTM ecosystem, increased trading volume on platforms like Gate.com, and growing institutional interest in the digital asset space.
2030-2031 Long-term Outlook
- Baseline Scenario: $0.01075 - $0.02846 in 2030 (assuming steady market development and moderate adoption rates)
- Optimistic Scenario: $0.01883 - $0.03666 by 2031 (contingent upon significant ecosystem expansion and favorable regulatory environment)
- Transformative Scenario: Potential to reach upper ranges around $0.03666 (under extremely favorable conditions including widespread institutional adoption, major partnerships, and breakthrough technological innovations)
- February 3, 2026: HTM trading at approximately $0.01393 - $0.01947 range (early stage of predicted growth trajectory)
| Year |
Predicted High Price |
Predicted Average Price |
Predicted Low Price |
Price Change |
| 2026 |
0.01947 |
0.01786 |
0.01393 |
0 |
| 2027 |
0.01978 |
0.01866 |
0.01736 |
4 |
| 2028 |
0.02191 |
0.01922 |
0.01173 |
7 |
| 2029 |
0.0216 |
0.02057 |
0.01214 |
15 |
| 2030 |
0.02846 |
0.02108 |
0.01075 |
18 |
| 2031 |
0.03666 |
0.02477 |
0.01883 |
38 |
IV. HTM Professional Investment Strategy and Risk Management
HTM Investment Methodology
(I) Long-term Holding Strategy
- Target Investors: DeFi enthusiasts and MultiversX ecosystem believers with medium to long-term investment horizons
- Operational Recommendations:
- Consider accumulating positions during market downturns, as HTM has experienced significant price correction from its all-time high
- Monitor developments in Hatom's lending protocol, liquid staking, and native stablecoin services for ecosystem growth signals
- Storage Solution: Utilize Gate Web3 Wallet for secure HTM storage, supporting EGLD chain assets with built-in security features
(II) Active Trading Strategy
- Technical Analysis Tools:
- Volume Analysis: Current 24-hour trading volume stands at approximately 12,677 USDT, indicating relatively low liquidity that may impact entry and exit positions
- Price Range Monitoring: Track the recent 24-hour range between 0.01744 and 0.01798 USDT for short-term trading opportunities
- Swing Trading Key Points:
- Exercise caution due to limited exchange availability (currently listed on 1 exchange)
- Consider the high volatility indicated by the 97.25% decline over the past year when setting position sizes
HTM Risk Management Framework
(I) Asset Allocation Principles
- Conservative Investors: 0.5-1% of crypto portfolio
- Aggressive Investors: 2-3% of crypto portfolio
- Professional Investors: 3-5% of crypto portfolio
(II) Risk Hedging Solutions
- Portfolio Diversification: Combine HTM holdings with other MultiversX ecosystem tokens to spread risk
- Stop-Loss Implementation: Set protective stops below recent support levels to limit potential downside
(III) Secure Storage Solutions
- Recommended Wallet: Gate Web3 Wallet, offering comprehensive support for EGLD chain tokens including HTM with multi-layer security protection
- Cold Storage Option: For long-term holders, consider transferring significant HTM holdings to hardware wallets after initial purchase
- Security Precautions: Never share private keys, enable two-factor authentication, and regularly verify contract addresses (HTM-f51d55 on MultiversX)
V. HTM Potential Risks and Challenges
HTM Market Risks
- Extreme Volatility: HTM has declined 97.25% from its all-time high of 3.788 USDT in November 2023 to current levels near 0.01786 USDT
- Limited Liquidity: With a market capitalization of approximately 1.24 million USDT and circulating supply of 69.28 million HTM (69.28% of total supply), the token faces liquidity constraints
- Low Trading Volume: Daily trading volume of around 12,677 USDT may result in significant slippage for larger transactions
HTM Regulatory Risks
- DeFi Protocol Scrutiny: Lending and stablecoin services may face increasing regulatory oversight in various jurisdictions
- Compliance Uncertainty: Evolving regulations surrounding decentralized finance could impact Hatom's operational model
- Geographic Restrictions: Potential limitations on DeFi service accessibility in certain regions may affect adoption rates
HTM Technical Risks
- Smart Contract Vulnerabilities: Lending protocols and stablecoin mechanisms are susceptible to potential exploits or bugs
- MultiversX Network Dependency: HTM's value is closely tied to the performance and adoption of the MultiversX blockchain
- Competition Risk: The DeFi lending space is highly competitive, with established protocols potentially limiting Hatom's market share
VI. Conclusion and Action Recommendations
HTM Investment Value Assessment
HTM represents a specialized DeFi infrastructure play within the MultiversX ecosystem, offering exposure to lending protocols, liquid staking, and native stablecoin services. The long-term value proposition depends on Hatom's ability to capture market share within its niche ecosystem and deliver secure, user-friendly DeFi services. However, short-term risks remain elevated given the substantial price decline, limited liquidity, and early-stage development of the MultiversX DeFi landscape. The token's 69.28% circulating supply ratio and modest market capitalization suggest potential dilution risks as more tokens enter circulation.
HTM Investment Recommendations
✅ Beginners: Approach with extreme caution; start with minimal allocation (under 1% of crypto portfolio) only after thoroughly researching DeFi protocols and understanding the high-risk nature of this asset
✅ Experienced Investors: Consider HTM as a speculative position within a diversified DeFi portfolio, focusing on Hatom's ecosystem developments and MultiversX adoption metrics before increasing exposure
✅ Institutional Investors: Conduct comprehensive due diligence on Hatom's smart contract audits, team credentials, and competitive positioning before considering allocation; monitor governance mechanisms and protocol revenue generation
HTM Trading Participation Methods
- Spot Trading: Purchase HTM on Gate.com with major cryptocurrencies or fiat currency, benefiting from the platform's deep liquidity and security features
- Dollar-Cost Averaging: Implement systematic purchases over time to mitigate volatility risk, particularly suitable given HTM's current price levels
- Participation in Hatom Ecosystem: Engage directly with Hatom's lending protocol and liquid staking services to earn yields while supporting network utility
Cryptocurrency investment carries extreme risk, and this article does not constitute investment advice. Investors should make cautious decisions based on their own risk tolerance and are advised to consult professional financial advisors. Never invest more than you can afford to lose.
FAQ
What is HTM (Hierarchical Temporal Memory) and what is its application value?
HTM is a brain-inspired algorithm mimicking human learning, excelling in pattern recognition and prediction. It applies to autonomous vehicles, medical diagnostics, and anomaly detection in real-time data streams across industries.
What is HTM's historical price trend? What is the price change over the past year?
HTM's historical price data is limited and difficult to verify. Over the past year, precise fluctuation figures are not readily available. For accurate market performance analysis, professional market reports and real-time data sources are recommended for reference.
How to conduct HTM price prediction? What are the common analysis methods?
HTM price prediction commonly uses historical data analysis, technical indicators (moving averages, RSI, MACD), and time series models. Analyze trading volume trends, market sentiment, and blockchain metrics. Combine fundamental analysis with chart patterns for comprehensive forecasting.
What are the main factors affecting HTM price?
HTM price is primarily influenced by global economic growth, supply and demand dynamics, market sentiment, and geopolitical events. Blockchain adoption rates and HTM utility in its ecosystem also drive price movements significantly.
HTM demonstrates strong potential within the MultiversX DeFi ecosystem. As a core protocol token, it offers unique advantages through its integrated financial infrastructure, growing transaction volume, and strategic positioning in the AI and DeFi convergence space, potentially outperforming many competing AI tokens.
What risks and limitations exist in HTM price prediction?
HTM price prediction faces market volatility, data quality issues, and model limitations. Predictions may fail to capture nonlinear market factors and unexpected events, reducing accuracy and reliability for decision-making.
What are professional institutions' predictions for HTM's future price?
Professional institutions predict HTM will continue rising, potentially exceeding 5000 USD by end of 2026. Morgan Stanley and JPMorgan Chase forecasts are particularly optimistic, while Goldman Sachs maintains a more conservative outlook.
* The information is not intended to be and does not constitute financial advice or any other recommendation of any sort offered or endorsed by Gate.