This comprehensive guide provides expert analysis of INFRA token's price trajectory from 2026 through 2031, combining historical market data with fundamental ecosystem factors. As of February 2026, INFRA trades at $0.065 with extreme market fear sentiment, down 97.44% from its 2024 peak. The article examines critical factors including token supply mechanics, AI infrastructure growth, and macroeconomic influences shaping INFRA's valuation. Price predictions span conservative ($0.048-$0.065), neutral, and optimistic ($0.083) scenarios for 2026, with growth potential to $0.103-$0.146 by 2031 under favorable conditions. The guide details professional investment strategies for different investor profiles, emphasizing position sizing of 1-10% portfolio allocation on Gate exchange. Critical risk factors include limited liquidity with only 473 holders, highly concentrated token distribution (92.63% held by top three addresses), and regulatory uncertainties. Ideal for Web3 infrastructure investors seeking data-driven
Introduction: INFRA's Market Position and Investment Value
Bware (INFRA), as a provider of high-end decentralized blockchain API infrastructure, has been establishing its presence in the Web3 infrastructure sector since its mainnet launch in February 2023. As of 2026, INFRA maintains a market capitalization of approximately $325,535, with a circulating supply of about 5 million tokens, and its price hovers around $0.065. This asset, recognized for its role in decentralized API services through the Blast Protocol platform, is playing an increasingly important role in supporting Web3 development and infrastructure scalability.
This article will comprehensively analyze INFRA's price trends from 2026 to 2031, combining historical patterns, market supply and demand dynamics, ecosystem development, and macroeconomic environment factors to provide investors with professional price forecasts and practical investment strategies.
I. INFRA Price History Review and Market Status
INFRA Historical Price Evolution Trajectory
- 2024: On January 24, INFRA reached a price peak of $2.5433, representing a significant milestone in the token's trading history
- 2025-2026: The token experienced a substantial correction period, with the price declining approximately 60.99% over the year
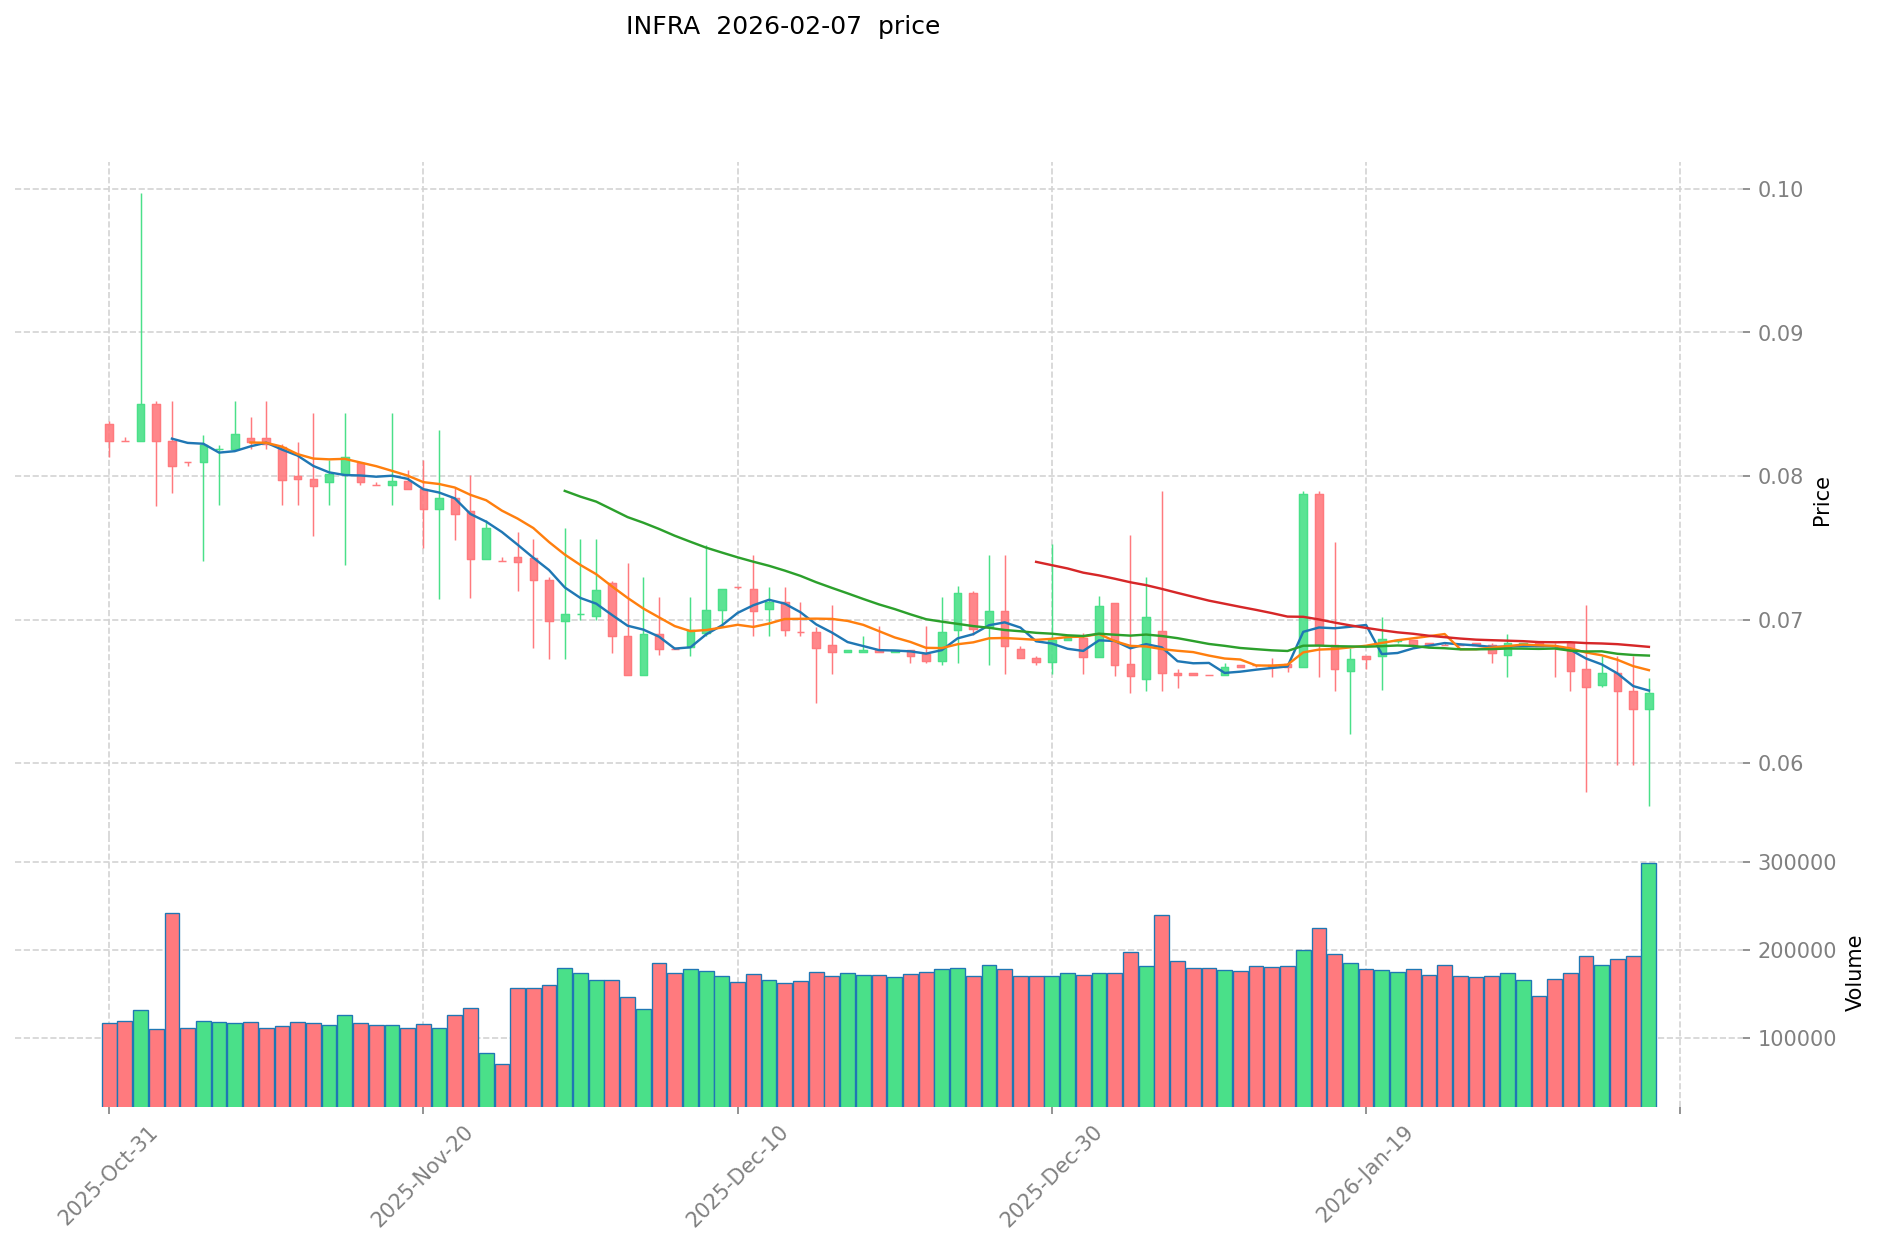
- 2026: On February 6, INFRA recorded its lowest price point at $0.057, marking the bottom of the current cycle
INFRA Current Market Situation
As of February 7, 2026, INFRA is trading at $0.06501, showing a modest recovery of 1.91% over the past 24 hours. The 24-hour trading range has been between $0.057 and $0.0659, with a total trading volume of $19,534.58.
From a short-term perspective, INFRA demonstrated slight negative momentum over the past hour with a decline of 0.22%. The weekly performance shows a decrease of 4.87%, while the monthly trend indicates a decline of 2.16%. The current market capitalization stands at approximately $325,535, with a circulating supply of 5,007,463 INFRA tokens out of a maximum supply of 100,000,000 tokens, representing a circulation ratio of 5.01%.
The fully diluted market cap is calculated at $6,501,000, and the token maintains a market dominance of 0.00026%. INFRA is held by 473 addresses and is available for trading on Gate.com. The current market sentiment index registers at 6, indicating an "Extreme Fear" condition in the broader cryptocurrency market.
The token has recovered approximately 14.04% from its recent low of $0.057, though it remains substantially below its historical peak, down approximately 97.44% from the all-time high of $2.5433.
Click to view current INFRA market price
INFRA Market Sentiment Indicator
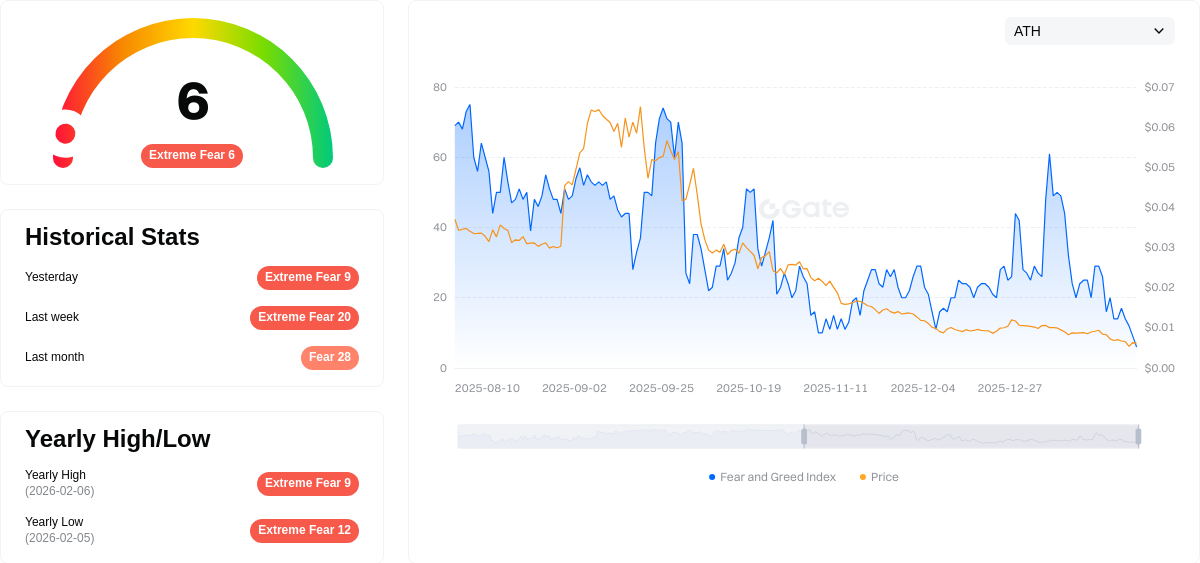
2026-02-07 Fear and Greed Index: 6 (Extreme Fear)
Click to view the current Fear & Greed Index
The INFRA market is currently experiencing extreme fear with an index reading of 6. This exceptionally low sentiment level indicates significant market pessimism and heightened anxiety among investors. During periods of extreme fear, market volatility typically increases as participants adopt more defensive positions. Such conditions often present contrarian opportunities for long-term investors, as excessive fear may have already priced in worst-case scenarios. However, caution remains essential, as further downside movements are possible before stabilization occurs.
INFRA Token Holding Distribution
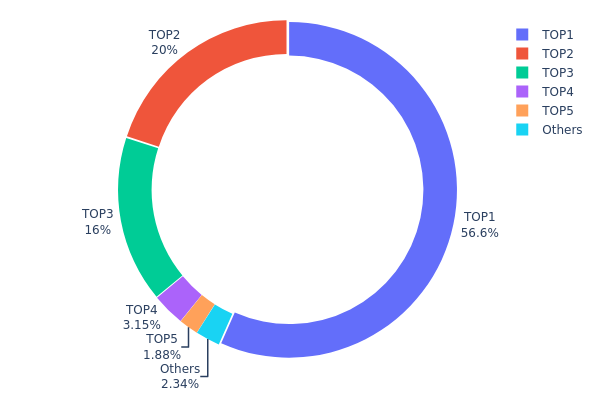
The holding distribution chart reflects the concentration level of token allocation across different addresses on the blockchain, serving as a critical indicator for assessing decentralization and potential market manipulation risks. According to the current on-chain data, INFRA exhibits a highly concentrated holding structure with the top address controlling 56.63% of the total supply (56,635.72K tokens), while the second and third largest addresses hold 20.00% and 16.00% respectively. Collectively, the top three addresses account for 92.63% of the circulating supply, indicating an extremely centralized distribution pattern.
This concentration level presents significant structural concerns for INFRA's market dynamics. The dominance of a single address holding over half the supply creates substantial vulnerability to price manipulation and introduces heightened volatility risks. In scenarios where major holders execute large-scale transactions, the limited liquidity depth could trigger dramatic price fluctuations. Furthermore, the minimal allocation to the "Others" category (2.36%) suggests a narrow holder base, which typically correlates with reduced trading activity and weaker price discovery mechanisms.
From a decentralization perspective, INFRA's current holding distribution reflects an immature token economy structure. Such concentration patterns are commonly observed in early-stage projects where team allocations, private sale lockups, or ecosystem reserves remain undistributed. While this doesn't inherently indicate malicious intent, it does suggest that the project's on-chain governance and risk resistance capabilities require substantial improvement before achieving a more balanced and sustainable token distribution model.
Click to view current INFRA Holding Distribution
| Top |
Address |
Holding Qty |
Holding (%) |
| 1 |
0x8eb8...e3ab28 |
56635.72K |
56.63% |
| 2 |
0x65bc...dad3dd |
20000.00K |
20.00% |
| 3 |
0x831f...e7ff39 |
16000.00K |
16.00% |
| 4 |
0x0825...6db51f |
3145.00K |
3.14% |
| 5 |
0xd4c3...17ebfd |
1875.87K |
1.87% |
| - |
Others |
2343.40K |
2.36% |
II. Core Factors Influencing INFRA's Future Price
Supply Mechanism
- Market Sentiment-Driven Volatility: Price fluctuations in INFRA reflect the broader market sentiment toward infrastructure management solutions. As market participants assess the utility and adoption prospects of the token, sentiment shifts can trigger significant price movements.
- Historical Patterns: Technology advancements and application trends have historically influenced INFRA's price trajectory. Periods of increased technological innovation and ecosystem expansion have typically coincided with positive price momentum.
- Current Impact: The ongoing growth in AI infrastructure development and global supply chain optimization continues to shape market expectations. As these sectors expand, demand dynamics for infrastructure-related tokens may experience corresponding shifts.
Institutional and Whale Dynamics
Insufficient data is available in the provided materials regarding specific institutional holdings, major enterprise adoption, or national-level policy frameworks directly pertaining to INFRA.
Macroeconomic Environment
- Monetary Policy Influence: External economic factors, including interest rate trajectories and monetary policy adjustments by major central banks, play a role in shaping risk appetite across digital asset markets. These macro conditions can indirectly affect INFRA's valuation as investors reassess portfolio allocations.
- Inflation Hedge Characteristics: The materials do not provide specific data on INFRA's performance during inflationary periods.
- Geopolitical Factors: Global supply chain dynamics and international trade relationships represent external influences that may impact infrastructure-related tokens. Regulatory changes across jurisdictions also contribute to the evolving risk landscape.
Technological Development and Ecosystem Building
- AI Infrastructure Growth: The rapid expansion of AI computing infrastructure represents a significant technological trend. Developments in distributed computing, GPU cluster optimization, and intelligent resource scheduling are reshaping the infrastructure landscape. DeepSeek's recent advancements, which demonstrated efficient large-scale model training with optimized hardware configurations, exemplify how technological breakthroughs can influence infrastructure requirements and utilization patterns.
- Computing and Communication Integration: The evolution of AI infrastructure increasingly emphasizes the integration of computing power with high-speed interconnection capabilities. Innovations in GPU-to-GPU communication, network optimization, and hardware-software co-design are driving efficiency improvements. These technological advances may create new demand scenarios for infrastructure management solutions.
- Ecosystem Applications: The materials reference the emergence of various AI applications and cloud computing platforms, though specific decentralized applications (DApps) or ecosystem projects directly related to INFRA are not detailed in the provided sources.
III. 2026-2031 INFRA Price Prediction
2026 Outlook
- Conservative Prediction: $0.04811 - $0.06501
- Neutral Prediction: Around $0.06501
- Optimistic Prediction: Up to $0.08321 (requires favorable market conditions and increased adoption)
2027-2029 Outlook
- Market Stage Expectation: The token is anticipated to enter a gradual growth phase, with price volatility potentially stabilizing as the ecosystem matures and user engagement strengthens.
- Price Range Prediction:
- 2027: $0.04891 - $0.07782, with an average around $0.07411
- 2028: $0.0433 - $0.10103, with an average around $0.07596
- 2029: $0.05752 - $0.10797, with an average around $0.0885
- Key Catalysts: Potential ecosystem expansion, technological upgrades, strategic partnerships, and broader adoption within the blockchain infrastructure sector could drive price appreciation during this period.
2030-2031 Long-term Outlook
- Baseline Scenario: $0.05403 - $0.10707 in 2030, with an average around $0.09823 (assuming steady market development and continued project execution)
- Optimistic Scenario: $0.08623 - $0.14577 by 2031, with an average around $0.10265 (contingent upon accelerated ecosystem growth and favorable regulatory environment)
- Transformative Scenario: Approaching $0.14577 by 2031 (dependent upon breakthrough technological developments, mass adoption, and sustained bull market conditions)
- February 7, 2026: INFRA price predictions suggest potential growth trajectory over the next five years, with estimated cumulative change reaching approximately 51-57% by 2030-2031 under favorable conditions.
| Year |
Predicted High Price |
Predicted Average Price |
Predicted Low Price |
Price Change |
| 2026 |
0.08321 |
0.06501 |
0.04811 |
0 |
| 2027 |
0.07782 |
0.07411 |
0.04891 |
14 |
| 2028 |
0.10103 |
0.07596 |
0.0433 |
16 |
| 2029 |
0.10797 |
0.0885 |
0.05752 |
36 |
| 2030 |
0.10707 |
0.09823 |
0.05403 |
51 |
| 2031 |
0.14577 |
0.10265 |
0.08623 |
57 |
IV. INFRA Professional Investment Strategy and Risk Management
INFRA Investment Methodology
(1) Long-term Holding Strategy
- Target Investors: Web3 infrastructure enthusiasts and blockchain technology believers
- Operational Recommendations:
- Consider accumulating positions during significant market pullbacks, given INFRA's one-year decline of approximately 61%
- Monitor node operator performance metrics and platform request volume growth as indicators of ecosystem health
- Utilize secure storage solutions such as Gate Web3 Wallet for long-term asset custody
(2) Active Trading Strategy
- Technical Analysis Tools:
- Volume Analysis: Track the 24-hour trading volume ($19,534) relative to market cap to identify liquidity patterns
- Support/Resistance Levels: Monitor the recent low of $0.057 (February 6, 2026) and 24-hour high of $0.0659 as key trading zones
- Swing Trading Considerations:
- The 24-hour price change of 1.91% suggests limited short-term volatility
- Weekly decline of 4.87% may present entry opportunities for mean-reversion strategies
INFRA Risk Management Framework
(1) Asset Allocation Principles
- Conservative Investors: 1-2% of crypto portfolio allocation
- Aggressive Investors: 3-5% of crypto portfolio allocation
- Professional Investors: Up to 10% with active monitoring
(2) Risk Hedging Solutions
- Portfolio Diversification: Combine INFRA with established infrastructure tokens to reduce sector-specific risk
- Position Sizing: Implement scaled entry points to average cost basis across different price levels
(3) Secure Storage Solutions
- Hot Wallet Recommendation: Gate Web3 Wallet for active trading and staking participation
- Cold Storage Option: Hardware wallet solutions for long-term holdings exceeding trading requirements
- Security Precautions: Enable two-factor authentication, verify contract addresses (ETH: 0x013062189dc3dcc99e9Cee714c513033b8d99e3c, AVAX C-Chain: 0xa4FB4F0Ff2431262D236778495145EcBC975c38B), and maintain secure backup of recovery phrases
V. INFRA Potential Risks and Challenges
INFRA Market Risks
- Limited Liquidity: With only 473 holders and daily trading volume of approximately $19,535, exit liquidity may be constrained during volatile periods
- Price Volatility: The token has experienced significant decline from its high of $2.54 (January 24, 2024) to current levels around $0.065
- Low Circulation: Only 5.01% of total supply is currently circulating, which may lead to supply pressure as more tokens enter the market
INFRA Regulatory Risks
- Infrastructure Token Classification: Evolving regulatory frameworks may impact how decentralized API platforms and their tokens are classified
- Node Operator Compliance: Changes in regulations affecting node operators could impact the Blast Protocol's operational model
- Cross-Chain Considerations: Deployment on multiple chains (Ethereum and Avalanche) may introduce additional regulatory complexity
INFRA Technical Risks
- Platform Competition: The Web3 infrastructure space faces intense competition from both centralized and decentralized API providers
- Node Performance Dependencies: The protocol's reward structure relies on node operator performance, creating potential centralization pressures toward high-performing operators
- Smart Contract Vulnerabilities: As with any blockchain protocol, potential security vulnerabilities in smart contracts could impact token value and platform operations
VI. Conclusion and Action Recommendations
INFRA Investment Value Assessment
INFRA represents a position in the decentralized blockchain infrastructure sector through Blast Protocol's API platform services. The project targets a critical need in the Web3 ecosystem with competitive response times and participation from established Web3 companies. However, investors should carefully weigh the long-term technological value proposition against current challenges, including limited liquidity (market cap of approximately $325,535), significant price depreciation over the past year, and low token circulation. The project's mainnet operation since February 2023 provides operational track record, but the small holder base and trading volume suggest early-stage market adoption.
INFRA Investment Recommendations
✅ Beginners: Consider observing from the sidelines until greater market liquidity develops, or limit exposure to less than 1% of total crypto portfolio
✅ Experienced Investors: May allocate 2-3% for strategic positioning with awareness of liquidity constraints and implementation of strict stop-loss protocols
✅ Institutional Investors: Conduct thorough due diligence on node operator economics, platform request metrics, and competitive positioning before considering allocation
INFRA Trading Participation Methods
- Spot Trading: Available on Gate.com with INFRA trading pairs for direct purchase and sale
- Node Participation: Users can participate as node providers or protocol delegates according to platform documentation
- Portfolio Integration: Consider INFRA as part of a broader Web3 infrastructure theme alongside other sector tokens
Cryptocurrency investment carries extreme risk, and this article does not constitute investment advice. Investors should make prudent decisions based on their own risk tolerance and are advised to consult professional financial advisors. Never invest more than you can afford to lose.
FAQ
What is INFRA token and what is its practical utility?
INFRA is the core token of InfraX platform, used for GPU and AI resource allocation. It enables ecosystem participation, ensuring transparent and secure resource distribution through blockchain technology.
How to predict INFRA price trends? What are the main factors affecting its price?
INFRA price is influenced by prediction event quality, market demand, social media influence, and competitive dynamics. Key factors include participant credibility, event randomness, trading volume, and community engagement levels.
INFRA's price has risen driven by strong AI infrastructure demand and advanced semiconductor production expansion. Currently in a growth stage with sustained bullish momentum, supported by robust order volumes and long-term infrastructure investments. Expected to maintain upward trajectory through 2026.
What are the risks to pay attention to when investing in INFRA tokens?
INFRA token investments carry market volatility risk, project execution risk, and regulatory uncertainty. Market prices fluctuate significantly based on adoption rates, competitive landscape, and macroeconomic conditions. Token value depends on protocol utility and network growth.
What are the advantages and disadvantages of INFRA compared to other infrastructure tokens?
INFRA offers innovative blockchain infrastructure with strong technical foundations and broad application potential. Advantages include robust platform architecture and ecosystem growth. Disadvantages may involve market competition intensity and adoption challenges compared to established infrastructure solutions.
What are professional analysts' predictions for INFRA's future price?
Professional analysts predict INFRA will trade between USD7 and USD15 over the next 12 months with a neutral rating. The target price is USD11.45, offering +16.65% upside potential.
* The information is not intended to be and does not constitute financial advice or any other recommendation of any sort offered or endorsed by Gate.