This comprehensive analysis examines Karura (KAR) token's price trajectory from 2026 to 2031, providing investors with professional market forecasts and strategic guidance. As a decentralized financial hub within the Kusama ecosystem, KAR currently trades at $0.001868 with a market capitalization of approximately $217,933. The article explores KAR's historical price evolution, current market sentiment indicating extreme fear conditions, and critical factors influencing future performance including supply-demand dynamics, technological innovation, and macroeconomic trends. Detailed price predictions range from conservative to optimistic scenarios across six-year periods, with projected average prices ranging from $0.00165 in 2026 to $0.00323 in 2031. The guide delivers actionable investment strategies, risk management frameworks, and storage solutions through Gate, alongside comprehensive analysis of market risks, regulatory uncertainties, and technical challenges for informed decision-making.
Introduction: KAR's Market Position and Investment Value
Karura (KAR), as a decentralized financial hub for the Kusama ecosystem and Acala's sister platform, has been serving the cross-chain DeFi space since its launch in 2021. As of 2026, KAR has a market capitalization of approximately $217,933, with a circulating supply of around 116.67 million tokens, and its price is maintained at approximately $0.001868. This asset, recognized as a "multi-collateralized DeFi platform," is playing an increasingly important role in cross-chain financial applications and decentralized exchange services.
This article will comprehensively analyze KAR's price trends from 2026 to 2031, combining historical patterns, market supply and demand dynamics, ecosystem development, and macroeconomic environment factors to provide investors with professional price predictions and practical investment strategies.
I. KAR Price History Review and Market Status
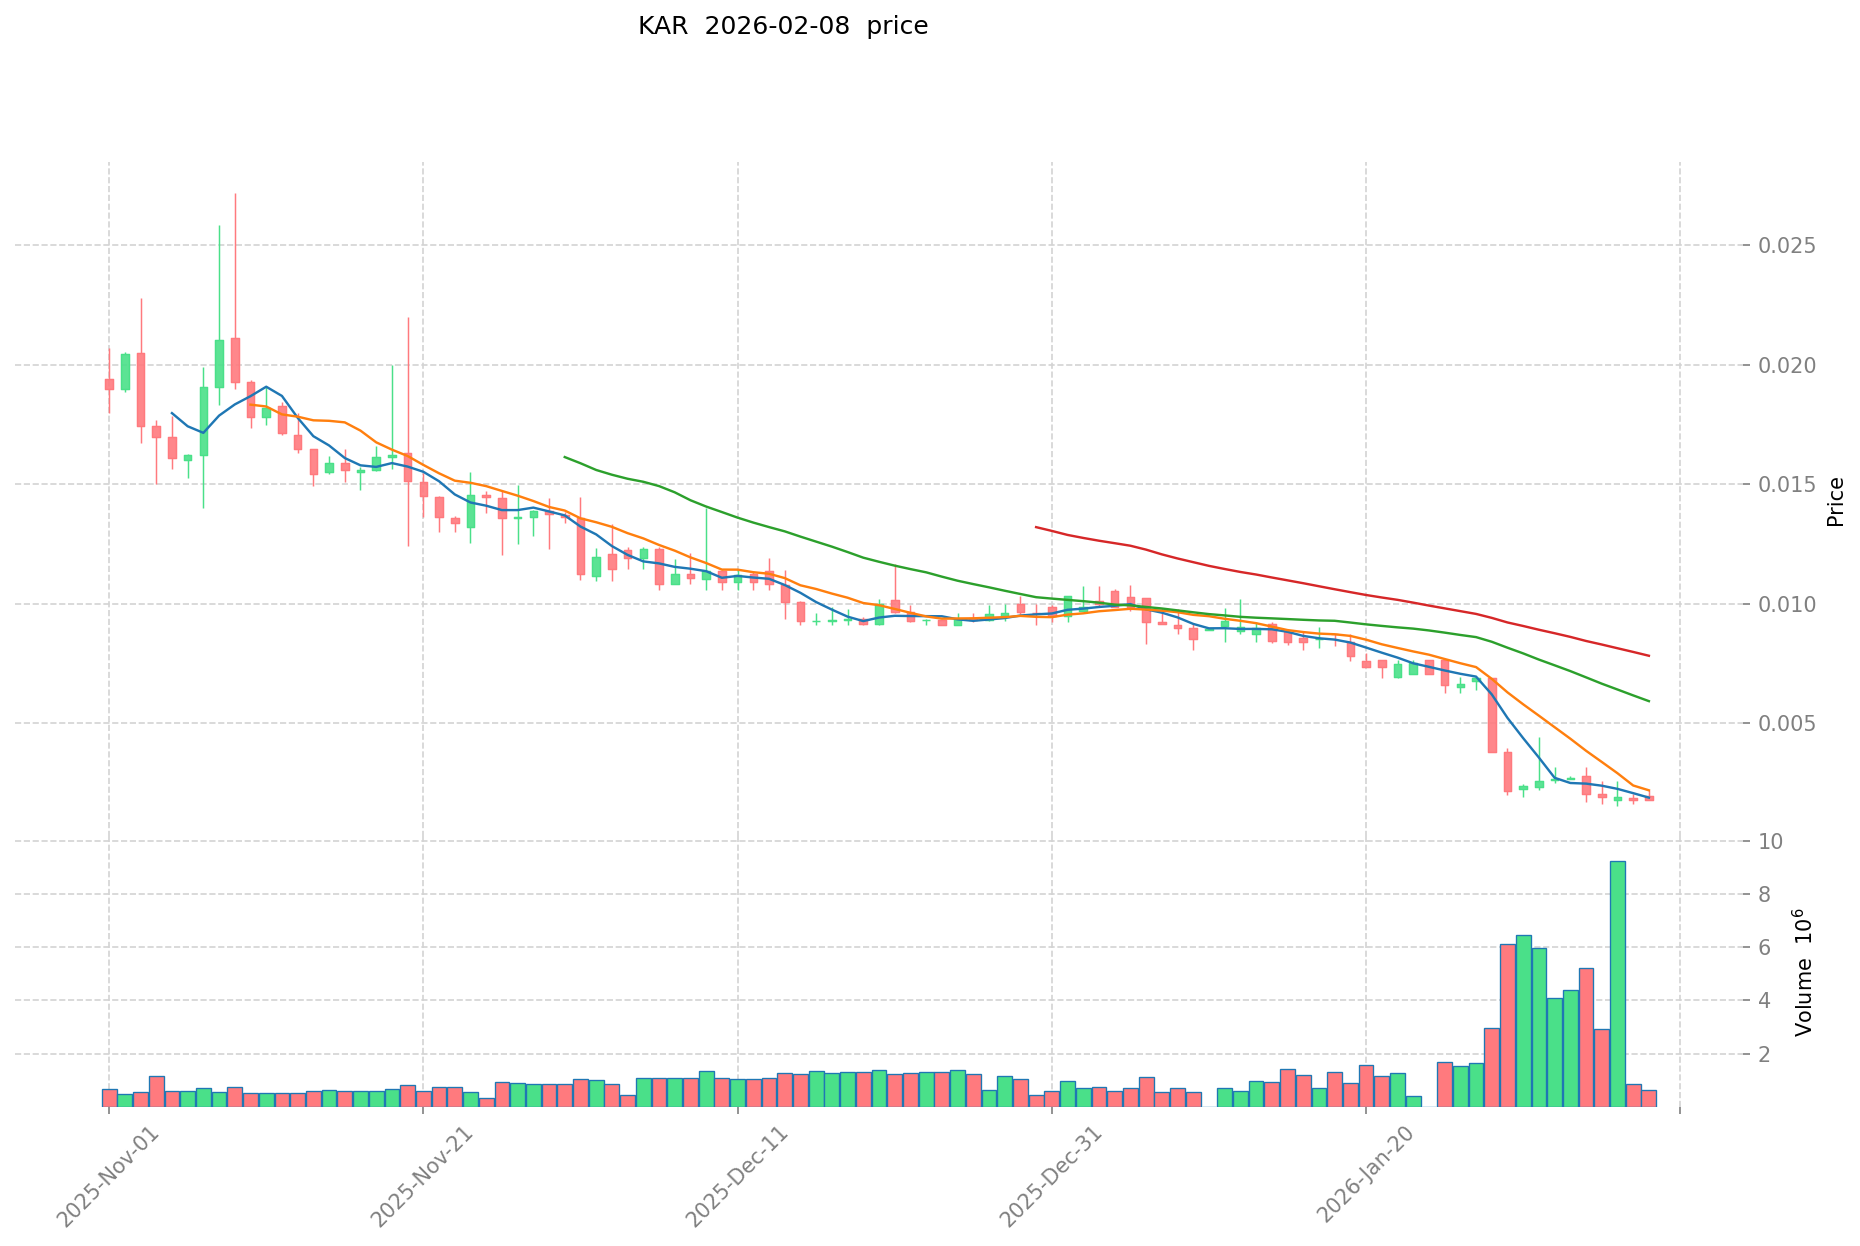
KAR Historical Price Evolution Trajectory
- 2021: Token launch in September, reaching an all-time high of $13.2 on September 16, marking the peak performance period
- 2021-2025: Extended downtrend phase across multiple market cycles, with significant price corrections
- 2026: Price declined to an all-time low of $0.00147133 on February 6, reflecting continued market pressure
KAR Current Market Situation
As of February 8, 2026, KAR is trading at $0.001868, showing negative momentum across multiple timeframes. The token has experienced a decline of 0.56% over the past hour and 7.75% in the last 24 hours, with trading activity reaching $1,102.57 in daily volume.
Over extended periods, the bearish trend intensifies, with the token down 33.98% over the past week and 79.63% over the last 30 days. The annual performance indicates a decline of 96.58%, reflecting sustained downward pressure throughout the year.
The market capitalization stands at approximately $217,933, with a circulating supply of 116.67 million KAR tokens out of a maximum supply of 160 million, representing a circulation ratio of 72.92%. The fully diluted market cap is estimated at $298,880. Within the past 24 hours, the token has fluctuated between a low of $0.001668 and a high of $0.002189.
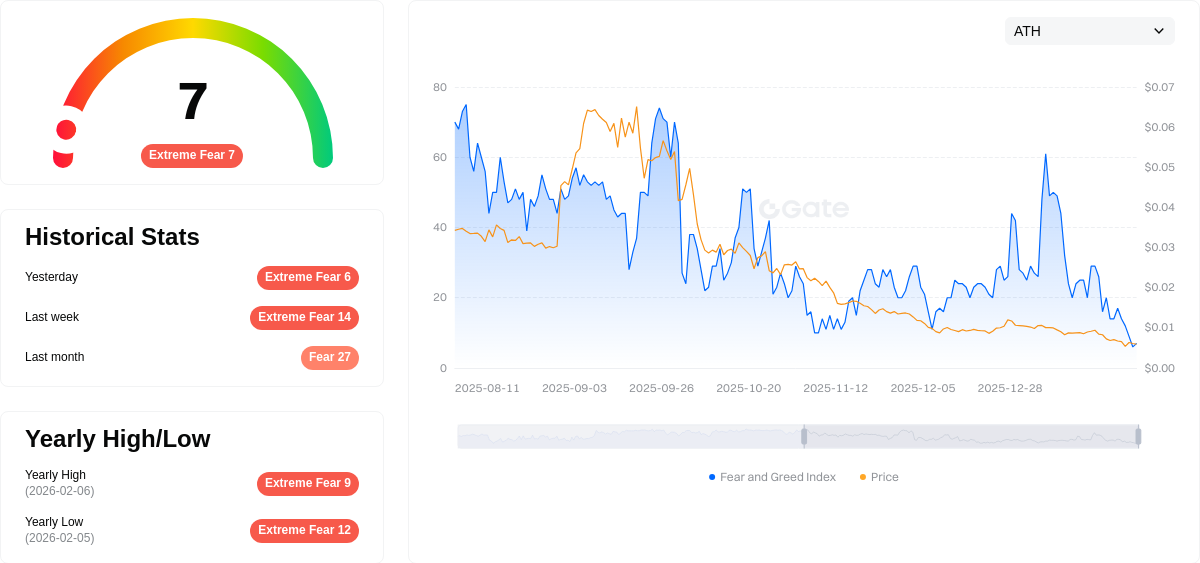
The current market sentiment index registers at 7, indicating extreme fear conditions in the broader cryptocurrency market.
Click to view current KAR market price
KAR Market Sentiment Index
2026-02-08 Fear and Greed Index: 7 (Extreme Fear)
Click to view current Fear & Greed Index
The cryptocurrency market is experiencing extreme fear, with the Fear and Greed Index dropping to 7. This severe sentiment reading suggests significant market pessimism and risk aversion among investors. Such extreme fear levels often signal potential capitulation, where panic selling may have reached peak levels. Historically, these periods have preceded market reversals and recovery opportunities. Investors should remain cautious while monitoring for stabilization signals. Market conditions remain highly volatile and uncertain.
KAR Token Holder Distribution
The holder distribution chart illustrates the concentration of KAR tokens across different wallet addresses, providing insights into the decentralization level and potential market control dynamics. A more dispersed distribution typically indicates healthier market structure, while excessive concentration in top addresses may signal elevated risks of price manipulation and increased volatility.
Based on current on-chain data, KAR demonstrates a relatively concentrated holding pattern, with the top 10 addresses collectively controlling a significant portion of the circulating supply. This concentration level, while not uncommon for emerging DeFi tokens, does present certain structural considerations. The largest holder maintains a substantial percentage of total supply, which could potentially influence price discovery mechanisms and create liquidity imbalances during periods of market stress.
From a market microstructure perspective, this distribution pattern suggests that KAR's price action may be susceptible to larger volatility swings compared to more broadly distributed assets. The concentration among top addresses indicates that relatively few entities possess the capability to materially impact market depth and trading dynamics. However, it's worth noting that many concentrated holdings may represent protocol-controlled wallets, ecosystem reserves, or locked liquidity pools rather than individual speculative positions, which could provide some stability to the overall token economics.
View current KAR holder distribution

| Top |
Address |
Holding Qty |
Holding (%) |
II. Core Factors Influencing KAR's Future Price
Supply and Demand Dynamics
- Market Demand: The future price trajectory of KAR is closely tied to market demand patterns. As demand fluctuates in response to broader cryptocurrency market sentiment and specific use case adoption, price movements may reflect these shifts.
- Supply-Demand Balance: The equilibrium between available supply and market demand serves as a primary driver of price behavior. When demand outpaces supply, upward price pressure may emerge, while oversupply relative to demand could create downward momentum.
- Market Competition: Competitive positioning within the cryptocurrency landscape influences KAR's market share and adoption rate, which in turn affects demand levels and price stability.
Technological Innovation and Efficiency
- Production Cost Optimization: Technological advancements may contribute to improved operational efficiency and reduced production costs. As enterprises adopt automated equipment to address rising labor costs and efficiency requirements, similar dynamics could apply to blockchain operations and token economics.
- Innovation Impact: Technical innovations within the KAR ecosystem could enhance system performance and reduce operational overhead, potentially influencing long-term value propositions and market positioning.
Macroeconomic Environment
- Industry Trends: Broader industry developments, including the shift toward automation and digital transformation in traditional sectors, may create analogous pressures and opportunities in the cryptocurrency space.
- Risk Management: Market participants increasingly focus on risk mitigation strategies. The ability of KAR to demonstrate resilience during market volatility could affect investor confidence and holding patterns.
- Cost Structure: As with manufacturing enterprises seeking to lower unit costs through technology adoption, cryptocurrency projects that demonstrate operational efficiency may gain competitive advantages in attracting users and investors.
III. 2026-2031 KAR Price Forecast
2026 Outlook
- Conservative Estimate: $0.00124 - $0.00165
- Neutral Estimate: $0.00165 average price level
- Optimistic Estimate: $0.00201 (requires favorable market conditions and increased adoption)
Based on the forecast data, KAR is expected to experience an 11% decline in 2026 compared to current levels, with price movements ranging between $0.00124 and $0.00201. The average price is projected to settle around $0.00165, reflecting a period of market consolidation.
2027-2029 Mid-Term Outlook
- Market Phase Expectation: Gradual recovery and growth trajectory, transitioning from consolidation to moderate expansion
- Price Range Forecast:
- 2027: $0.00135 - $0.00221, with a projected 2% decline year-over-year
- 2028: $0.00164 - $0.00297, showing an 8% increase as market sentiment improves
- 2029: $0.00225 - $0.00334, demonstrating a significant 33% growth acceleration
- Key Catalysts: Enhanced ecosystem development, potential network upgrades, and broader cryptocurrency market recovery trends may drive price appreciation during this period
The mid-term outlook suggests KAR could enter a growth phase starting from 2028, with momentum building significantly into 2029 as market conditions potentially improve.
2030-2031 Long-Term Outlook
- Baseline Scenario: $0.00251 - $0.00353 (assuming steady ecosystem growth and sustained market interest)
- Optimistic Scenario: $0.00292 - $0.00353 in 2030, with 56% year-over-year growth (contingent on strong adoption and positive market dynamics)
- Extended Growth Scenario: $0.00216 - $0.00332 in 2031, maintaining elevated levels with 72% cumulative growth from 2026 baseline (requires sustained technological advancement and market expansion)
The long-term forecast indicates potential for substantial appreciation, with 2030 marking a possible peak period. By 2031, the average price is projected to stabilize around $0.00323, though volatility ranges suggest price discovery may continue throughout this timeframe. These projections assume continued project development and favorable broader market conditions.
| Year |
Predicted High Price |
Predicted Average Price |
Predicted Low Price |
Price Change |
| 2026 |
0.00201 |
0.00165 |
0.00124 |
-11 |
| 2027 |
0.00221 |
0.00183 |
0.00135 |
-2 |
| 2028 |
0.00297 |
0.00202 |
0.00164 |
8 |
| 2029 |
0.00334 |
0.00249 |
0.00225 |
33 |
| 2030 |
0.00353 |
0.00292 |
0.00251 |
56 |
| 2031 |
0.00332 |
0.00323 |
0.00216 |
72 |
IV. KAR Professional Investment Strategy and Risk Management
KAR Investment Methodology
(I) Long-term Holding Strategy
- Suitable for: Investors seeking exposure to Kusama DeFi ecosystem development
- Operational Recommendations:
- Consider accumulating positions during market corrections when technical indicators show oversold conditions
- Monitor Karura platform development milestones and ecosystem partnerships as potential catalysts
- Implement secure storage solutions using Gate Web3 Wallet for multi-signature protection
(II) Active Trading Strategy
- Technical Analysis Tools:
- Moving Averages: Use 50-day and 200-day moving averages to identify trend directions and potential reversal points
- Volume Analysis: Monitor 24-hour trading volume fluctuations to assess market participation strength
- Swing Trading Points:
- Set stop-loss orders at 8-10% below entry price to manage downside risk
- Consider taking partial profits during significant price rallies above key resistance levels
KAR Risk Management Framework
(I) Asset Allocation Principles
- Conservative Investors: 1-2% of crypto portfolio
- Aggressive Investors: 3-5% of crypto portfolio
- Professional Investors: 5-8% of crypto portfolio with active monitoring
(II) Risk Hedging Solutions
- Portfolio Diversification: Balance KAR holdings with established cryptocurrencies and stablecoins
- Position Sizing: Avoid concentration risk by limiting single-asset exposure
(III) Secure Storage Solutions
- Hot Wallet Option: Gate Web3 Wallet for active trading and liquidity management
- Cold Storage Approach: Hardware wallet solutions for long-term holdings
- Security Precautions: Enable two-factor authentication, regularly update security settings, and never share private keys
V. KAR Potential Risks and Challenges
KAR Market Risks
- High Volatility: KAR experienced significant price decline of 96.58% over the past year, indicating substantial market volatility
- Liquidity Concerns: Limited daily trading volume of approximately 1,102 USD may result in wider bid-ask spreads and slippage
- Low Market Capitalization: Current market cap of approximately 217,933 USD positions KAR as a micro-cap asset with heightened risk exposure
KAR Regulatory Risks
- DeFi Regulatory Uncertainty: Evolving regulatory frameworks for decentralized finance platforms may impact Karura operations
- Cross-chain Asset Compliance: Multi-collateral stablecoin mechanisms may face scrutiny under emerging digital asset regulations
- Jurisdictional Variations: Different regulatory approaches across regions may affect platform accessibility
KAR Technical Risks
- Smart Contract Vulnerabilities: Complex financial applications on the parachain may contain undiscovered security flaws
- Cross-chain Bridge Risks: Dependencies on cross-chain asset transfers introduce potential technical failure points
- Network Dependency: Performance relies on Kusama network stability and ongoing technical maintenance
VI. Conclusion and Action Recommendations
KAR Investment Value Assessment
KAR represents a specialized DeFi infrastructure play within the Kusama ecosystem, offering exposure to cross-chain financial applications. However, the token faces significant challenges including extreme price volatility, minimal liquidity, and substantial distance from historical price levels. While the platform's technical capabilities provide long-term potential, short-term risks remain elevated due to market conditions and limited trading activity.
KAR Investment Recommendations
✅ Beginners: Exercise extreme caution; consider observing market dynamics before participation, and limit exposure to funds prepared for potential complete loss
✅ Experienced Investors: Approach as a speculative position with strict risk parameters; implement dollar-cost averaging during favorable market conditions
✅ Institutional Investors: Conduct thorough due diligence on platform fundamentals and ecosystem development; consider strategic allocation only within diversified DeFi portfolio
KAR Trading Participation Methods
- Spot Trading: Access KAR through Gate.com spot markets for direct token ownership
- DeFi Participation: Engage with Karura platform directly for staking and liquidity provision opportunities
- Portfolio Integration: Incorporate KAR as a minor component within broader Kusama ecosystem exposure strategy
Cryptocurrency investment carries extremely high risk, and this article does not constitute investment advice. Investors should make prudent decisions based on their own risk tolerance and are advised to consult professional financial advisors. Never invest more than you can afford to lose.
FAQ
What is KAR token and what is its purpose?
KAR is the native token of Karura platform, used for paying transaction fees and participating in platform governance. It enables lending, borrowing, and investment activities within the ecosystem.
KAR has demonstrated a 6.93% gain over the past year. The 52-week price range spans from 1.200 to 2.170, reflecting moderate volatility in the cryptocurrency market during this period.
What is the KAR price prediction for 2024? What are the future prospects?
KAR price prediction remains uncertain with high volatility. While potential recovery exists, substantial uncertainty persists. Market timing is dynamic, and investors should monitor fundamental developments and ecosystem growth to assess long-term value prospects.
What are the main factors affecting KAR price?
KAR price is influenced by market sentiment, major partnerships, adoption rates, and regulatory developments. Positive news and collaborations typically drive price up, while negative events and security concerns cause declines.
What are KAR's advantages compared to other DeFi tokens?
KAR offers an efficient decentralized finance ecosystem with unique community governance mechanisms, enabling superior performance in competitive DeFi markets through optimized transaction processing and enhanced user participation.
Is KAR a good time to buy now? What are the investment risks?
KAR presents moderate buying opportunity with strong fundamentals. Key risks include market volatility, regulatory changes in crypto space, and liquidity fluctuations. Consider dollar-cost averaging strategy.
* The information is not intended to be and does not constitute financial advice or any other recommendation of any sort offered or endorsed by Gate.