This comprehensive analysis provides a professional price forecast for MDUS from 2026 to 2031, combining historical market data with ecosystem development insights. The article examines MDUS's current market position, trading at $0.000224 with extreme market fear conditions, and evaluates core influencing factors including supply dynamics, institutional adoption, and technical development. Detailed price predictions span from conservative scenarios ($0.00013-$0.00022 in 2026) to transformative scenarios ($0.00052 by 2031). The guide offers tailored investment strategies for different investor profiles, comprehensive risk management frameworks including asset allocation principles, and practical trading methods on Gate. Additionally, it addresses significant challenges including volatility risks, liquidity constraints, regulatory uncertainties, and technical vulnerabilities. Ideal for investors evaluating blockchain-based healthcare opportunities seeking evidence-based market analysis and risk-informed decisio
Introduction: MDUS Market Position and Investment Value
Medieus (MDUS), positioned as a blockchain-based MediFi commercial platform, has been developing its ecosystem since its launch in 2024. As of February 2026, MDUS maintains a market capitalization of approximately $398,398, with a circulating supply of around 1.78 billion tokens, and the price hovering around $0.000224. This asset, operating within the intersection of healthcare and decentralized finance, is playing a role in reshaping how medical service information is shared and monetized through blockchain technology.
This article will comprehensively analyze MDUS price trends from 2026 to 2031, combining historical patterns, market supply and demand dynamics, ecosystem development, and macroeconomic conditions to provide investors with professional price forecasts and practical investment strategies.
I. MDUS Price History Review and Market Status
MDUS Historical Price Evolution Trajectory
- 2024: The token launched on March 12, 2024, with a publish price of $0.0074, representing the initial market entry point for MDUS.
- 2024: On May 27, 2024, MDUS reached its peak price of $0.2376, marking a significant appreciation from its launch price.
- 2024: The token experienced substantial volatility throughout the year, declining from the May high of $0.2376 to a low of $0.00008 on November 7, 2024.
MDUS Current Market Status
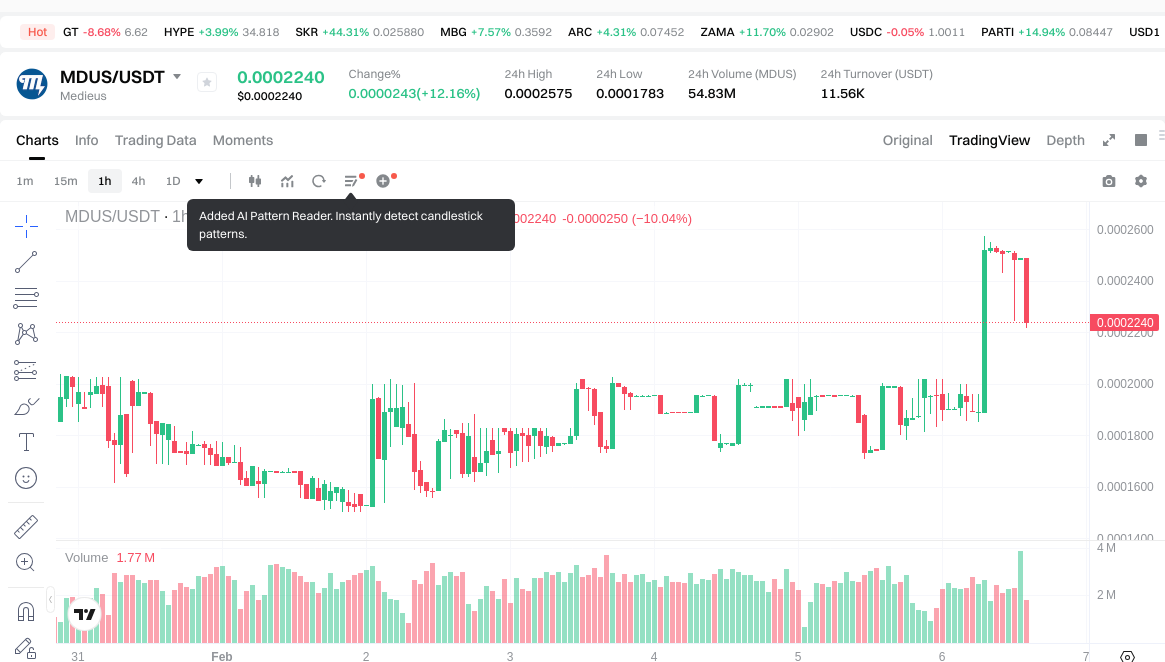
As of February 6, 2026, MDUS is trading at $0.000224, reflecting mixed short-term momentum. Over the past 24 hours, the token has shown positive movement with a gain of 12.16%, though the 1-hour performance indicates a decline of 10.04%. The 24-hour trading range has been between $0.0001783 and $0.0002575.
From a broader perspective, the 7-day performance shows a modest increase of 4.27%, while the 30-day trend reveals a decline of 25.18%. The annual performance indicates a decrease of 29.38%, suggesting ongoing price challenges over the longer term.
The token currently holds a market capitalization of approximately $398,398, ranking #3210 in the cryptocurrency market with a market share of 0.000037%. The circulating supply stands at 1,778,563,325 MDUS tokens, representing 44.46% of the maximum supply of 4,000,000,000 tokens. The 24-hour trading volume is recorded at $11,473.51.
The fully diluted market cap is calculated at $896,000, and MDUS operates on the Polygon network with over 106,200 holders. Current market sentiment analysis indicates a reading of 9 on the volatility index, corresponding to extreme fear conditions in the broader market.
Click to view current MDUS market price
MDUS Market Sentiment Index
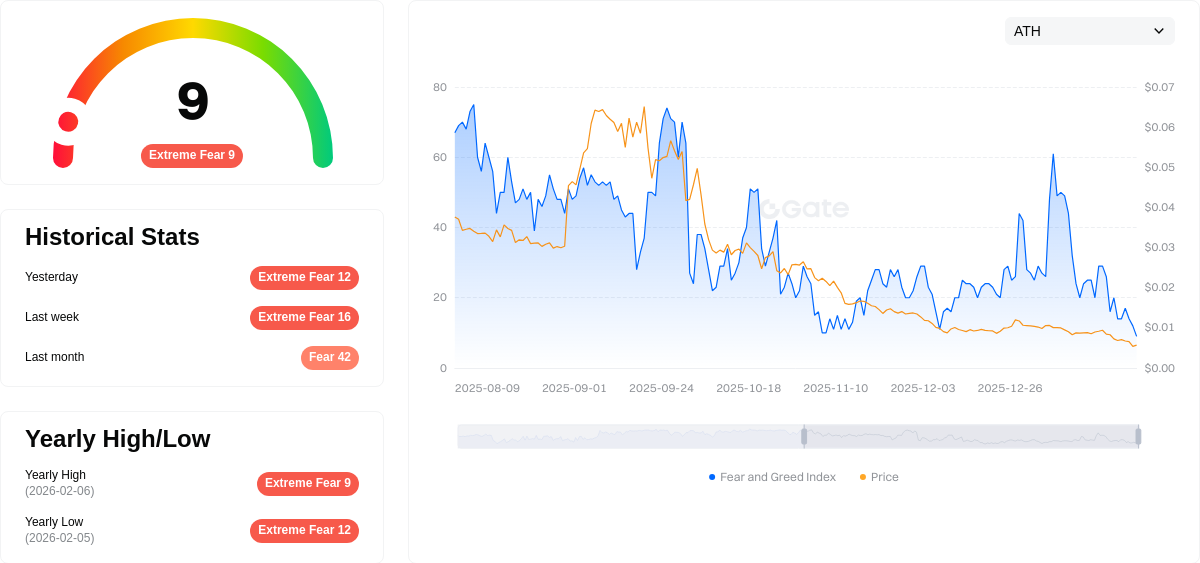
2026-02-06 Fear and Greed Index: 9 (Extreme Fear)
Click to view current Fear & Greed Index
The cryptocurrency market is experiencing extreme fear, with the index hitting just 9 points. This exceptionally low reading suggests significant market pessimism and heightened risk aversion among investors. When fear reaches such extreme levels, it often creates contrarian opportunities for long-term investors, as assets may become oversold. However, caution remains warranted as market volatility could persist. Traders should carefully assess their risk tolerance and portfolio positioning during this period of intense market stress.
MDUS Holding Distribution
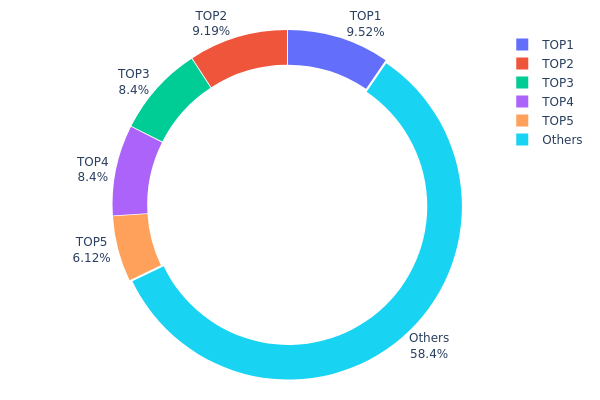
According to the on-chain data, MDUS currently exhibits a relatively concentrated holding pattern. The top five addresses collectively hold 41.61% of the total supply, while the remaining 58.39% is distributed among other addresses. Among these, the largest holder controls approximately 380.8 million tokens (9.51%), followed by the second and third largest addresses holding 9.19% and 8.40% respectively. This distribution structure indicates that MDUS has not yet achieved a highly decentralized state, with a significant portion of tokens concentrated in the hands of a few major holders.
From a market structure perspective, this concentration level presents both opportunities and risks. The substantial holdings by top addresses may suggest strong confidence from early investors or institutional participants, potentially providing price support during market downturns. However, this also introduces considerable volatility risk—any large-scale selling action by these major holders could trigger significant price fluctuations and create selling pressure on the secondary market. Additionally, such concentrated distribution may increase the possibility of price manipulation, as major holders possess sufficient market influence to impact short-term price movements.
Overall, MDUS's current holding distribution reflects the typical characteristics of emerging digital assets in their early development stage. While the concentration level has not reached an extreme state of concern, the market still requires gradual optimization of token distribution through organic circulation and broader community participation to enhance decentralization and improve on-chain structural stability.
Click to view current MDUS Holding Distribution
| Top |
Address |
Holding Qty |
Holding (%) |
| 1 |
0x0073...a7c6ca |
380799.90K |
9.51% |
| 2 |
0x0d07...b492fe |
367615.01K |
9.19% |
| 3 |
0x0458...2cf27e |
336000.00K |
8.40% |
| 4 |
0x4a38...3cc272 |
335999.90K |
8.39% |
| 5 |
0x6cf2...d7a657 |
244992.49K |
6.12% |
| - |
Others |
2334592.71K |
58.39% |
II. Core Factors Influencing MDUS Future Price Trends
Supply Mechanism
- Market Growth Dynamics: The multi-device user synchronization (MDUS) market demonstrates strong expansion potential, with projected compound annual growth rate of 15.6% during the forecast period. This growth trajectory reflects increasing adoption across residential and commercial sectors.
- Historical Patterns: Technology innovation and market expansion have historically served as primary drivers for MDUS development, establishing a foundation for sustained growth momentum.
- Current Impact: Ongoing technological advancements and broadening market penetration are expected to continue supporting favorable supply-demand dynamics throughout the forecast period.
Institutional and Major Stakeholder Activity
- Institutional Holdings: As of 2025, MDUS has established itself as a benchmark project in the medical blockchain sector, with holder numbers exceeding 100,000 participants.
- Enterprise Adoption: Property management companies are increasingly implementing centralized MDUS solutions, particularly within multi-dwelling unit environments including apartment complexes and gated communities, representing the fastest-growing end-user segment.
- Regulatory Environment: Market development continues to be shaped by evolving technological standards and adoption patterns across institutional participants.
Macroeconomic Environment
- Market Demand Factors: Prevailing market demand conditions, coupled with technological progress and regulatory policy frameworks, constitute fundamental determinants of MDUS price trajectory.
- Economic Context: Broader economic trends and investment patterns influence adoption rates and market valuation dynamics within the MDUS ecosystem.
Technical Development and Ecosystem Construction
- Innovation Integration: Technical innovation remains a core driver supporting MDUS market expansion, with continued development efforts focused on enhancing system capabilities and user experience.
- Ecosystem Applications: The MDUS framework supports diverse applications across residential property management systems and commercial building operations, with growing implementation in smart building infrastructure.
- Market Position: MDUS has achieved recognition as an innovative benchmark project within its sector, supported by expanding user base and evolving technical architecture designed to meet multi-device synchronization requirements.
III. 2026-2031 MDUS Price Prediction
2026 Outlook
- Conservative forecast: $0.00013 - $0.00022
- Neutral forecast: $0.00022 (average market scenario)
- Optimistic forecast: $0.00027 (requires favorable market conditions)
2027-2029 Outlook
- Market stage expectation: Early growth phase with gradual price appreciation as MDUS continues to establish market presence
- Price range forecast:
- 2027: $0.00017 - $0.0003
- 2028: $0.00025 - $0.00029
- 2029: $0.00026 - $0.00037
- Key catalysts: Steady market adoption and potential ecosystem development could drive price movements during this period
2030-2031 Long-term Outlook
- Baseline scenario: $0.00032 - $0.00033 (assuming continued market stability and adoption)
- Optimistic scenario: $0.00038 - $0.00043 (with enhanced utility and broader market recognition)
- Transformative scenario: $0.00052 (under exceptionally favorable conditions including significant adoption breakthroughs)
- 2026-02-06: MDUS trading within the projected range of $0.00013 - $0.00027 (early stage development phase)
| Year |
Predicted High Price |
Predicted Average Price |
Predicted Low Price |
Price Change |
| 2026 |
0.00027 |
0.00022 |
0.00013 |
0 |
| 2027 |
0.0003 |
0.00025 |
0.00017 |
9 |
| 2028 |
0.00029 |
0.00028 |
0.00025 |
22 |
| 2029 |
0.00037 |
0.00028 |
0.00026 |
25 |
| 2030 |
0.00043 |
0.00033 |
0.00032 |
45 |
| 2031 |
0.00052 |
0.00038 |
0.00031 |
68 |
IV. MDUS Professional Investment Strategy and Risk Management
MDUS Investment Methodology
(1) Long-Term Holding Strategy
- Target Investors: Investors seeking exposure to blockchain-based healthcare innovations with moderate risk tolerance
- Operational Recommendations:
- Consider accumulating positions during market corrections when MDUS trades near historical support levels
- Monitor the platform's user growth metrics and medical service provider partnerships as indicators of long-term viability
- Store assets in secure wallet solutions such as Gate Web3 Wallet for enhanced security and accessibility
(2) Active Trading Strategy
- Technical Analysis Tools:
- Moving Averages: Utilize 20-day and 50-day moving averages to identify potential trend reversals and momentum shifts
- Volume Analysis: Monitor 24-hour trading volume changes to gauge market interest and potential breakout opportunities
- Swing Trading Key Points:
- Pay attention to the 24-hour price volatility range, which currently spans from $0.0001783 to $0.0002575
- Consider taking partial profits during upward momentum periods exceeding 10% daily gains
MDUS Risk Management Framework
(1) Asset Allocation Principles
- Conservative Investors: 1-2% of crypto portfolio allocation
- Aggressive Investors: 3-5% of crypto portfolio allocation
- Professional Investors: Up to 8% with active risk monitoring
(2) Risk Hedging Solutions
- Diversification Strategy: Balance MDUS holdings with established healthcare-focused blockchain projects
- Position Sizing: Implement gradual entry strategies rather than single large purchases given the token's volatility
(3) Secure Storage Solutions
- Hot Wallet Recommendation: Gate Web3 Wallet for active trading and quick access
- Cold Storage Option: Consider hardware wallet solutions for long-term holdings exceeding $1,000
- Security Precautions: Enable two-factor authentication, regularly update security protocols, and never share private keys or seed phrases
V. MDUS Potential Risks and Challenges
MDUS Market Risks
- High Volatility: MDUS has experienced significant price fluctuations with a 30-day decline of 25.18% and yearly decline of 29.38%
- Limited Liquidity: With a 24-hour trading volume of approximately $11,473, the market depth may be insufficient for large transactions without significant price impact
- Low Market Capitalization: The circulating market cap of approximately $398,398 indicates vulnerability to market manipulation and elevated price volatility
MDUS Regulatory Risks
- Healthcare Data Privacy: Medical information sharing platforms may face stringent regulatory requirements regarding patient data protection and HIPAA-like compliance standards
- Token Classification Uncertainty: Regulatory authorities may scrutinize tokens that facilitate medical service payments, potentially affecting platform operations
- Cross-Border Compliance: International medical service marketplaces may encounter varying regulatory frameworks across different jurisdictions
MDUS Technical Risks
- Smart Contract Vulnerabilities: As a Polygon-based token, MDUS is subject to potential smart contract exploits or security breaches
- Platform Adoption Risk: The success of MDUS depends on widespread adoption by medical service providers and consumers, which remains unproven
- Network Dependency: Reliance on Polygon infrastructure means any network congestion or technical issues could impact MDUS transaction efficiency
VI. Conclusion and Action Recommendations
MDUS Investment Value Assessment
MDUS represents an experimental approach to integrating blockchain technology with healthcare services through its MediFi platform. While the project addresses real-world needs in medical service transparency and information sharing, investors should note the significant challenges ahead. The token's substantial price decline over recent periods, combined with limited liquidity and low market capitalization, suggests elevated investment risk. The long-term value proposition depends heavily on successful platform adoption, regulatory navigation, and the ability to build trust within the medical community. Short-term risks include continued price volatility, liquidity constraints, and potential regulatory scrutiny.
MDUS Investment Recommendations
✅ Beginners: Consider allocating no more than 1% of your crypto portfolio to MDUS, and only after thoroughly researching the project's fundamentals and understanding blockchain-based healthcare platforms
✅ Experienced Investors: Monitor platform development milestones and partnership announcements before establishing positions; consider dollar-cost averaging to mitigate volatility risk
✅ Institutional Investors: Conduct comprehensive due diligence on regulatory compliance, technical infrastructure, and market positioning before considering exposure; maintain strict position sizing limits
MDUS Trading Participation Methods
- Spot Trading: Purchase MDUS directly on Gate.com with support for various trading pairs and competitive fees
- Wallet Storage: Utilize Gate Web3 Wallet for secure storage and easy access to trading opportunities
- Market Monitoring: Track platform developments, holder growth (currently over 106,000 holders), and circulating supply changes to inform trading decisions
Cryptocurrency investment carries extremely high risks, and this article does not constitute investment advice. Investors should make prudent decisions based on their own risk tolerance and are advised to consult professional financial advisors. Never invest more than you can afford to lose.
FAQ
What is the historical price trend of MDUS? What is the price change in the past year?
MDUS has demonstrated strong performance over the past year, with a gain of approximately 33.37%. The 52-week price range spans from $19.95 to $48.31, reflecting significant volatility and upward momentum in the market.
What are the main factors affecting MDUS price?
MDUS price is primarily influenced by market sentiment, investor confidence, and adoption rates. Technical breakthroughs, trading volume, and overall cryptocurrency market conditions also play significant roles in price fluctuations.
How to conduct technical and fundamental analysis on MDUS to predict price?
Analyze MDUS technical aspects by monitoring network protocol efficiency, transaction speed, and on-chain metrics. For fundamental analysis, evaluate market demand, user growth, ecosystem development, and tokenomics. Combine these with market trends and investor sentiment for price prediction.
What are the advantages and disadvantages of MDUS compared to other mainstream cryptocurrencies?
MDUS excels in decentralized trading and privacy protection with lower transaction fees. However, it has slower transaction speeds and lower market recognition compared to mainstream cryptocurrencies like Bitcoin and Ethereum.
What are professional analysts' predictions for MDUS future price?
Professional analysts predict MDUS could reach highs of 26.00 USD and lows of 21.00 USD based on current market trends and performance metrics. These predictions may evolve over time as market conditions change.
What risks and uncertainties exist in MDUS price prediction?
MDUS price prediction faces market volatility and uncertainty. Predictions are based on current data and trend analysis, but future prices may be affected by multiple factors. Treat predictions as reference only, not guaranteed accuracy.
How is MDUS liquidity and trading volume, and what impact does it have on price prediction?
MDUS maintains 24-hour trading volume of approximately US$11,939, reflecting moderate market activity. Lower liquidity may increase price volatility and reduce prediction accuracy. However, growing adoption could strengthen both metrics, potentially stabilizing price movements and improving forecast reliability going forward.
* The information is not intended to be and does not constitute financial advice or any other recommendation of any sort offered or endorsed by Gate.