This comprehensive analysis examines Matrix Layer Protocol (MLP), an AI-driven infrastructure token trading at $0.0005192 with a $320,865 market cap as of February 2026. The article reviews MLP's volatile price history since its November 2024 launch on Gate, detailed technical analysis of market dynamics, and expert price forecasts ranging from $0.00045 to $0.00137 through 2031. It addresses core factors influencing MLP valuation including market sentiment, holding distribution concentration (96.85% held by top five addresses), and technical indicators. The guide provides professional investment strategies for beginners through institutional investors, emphasizing risk management frameworks and secure storage solutions via Gate Web3 Wallet. Critical discussions cover market risks including extreme volatility, liquidity constraints, and regulatory uncertainties, alongside actionable recommendations for spot trading and dollar-cost averaging approaches on Gate's platform for interested investors.
Introduction: MLP's Market Position and Investment Value
Matrix Layer Protocol (MLP), as an AI-driven communication and infrastructure protocol designed for decentralized network ecosystems, has been building its position in the blockchain infrastructure space since its launch in 2024. As of 2026, MLP has a market capitalization of approximately $320,865, with a circulating supply of around 618 million tokens, and the price is maintained at around $0.0005192. This asset, positioned as a multi-dimensional data transmission solution provider, is playing an increasingly important role in IoT, Web3, and Metaverse communication scenarios.
This article will comprehensively analyze MLP's price trends from 2026 to 2031, combining historical patterns, market supply and demand dynamics, ecosystem development, and macroeconomic environment factors to provide investors with professional price forecasts and practical investment strategies.
I. MLP Price History Review and Market Status
MLP Historical Price Evolution Trajectory
- November 2024: Matrix Layer Protocol (MLP) launched on Gate.com at an initial price of $0.01, marking its entry into the cryptocurrency market.
- December 2024: The token experienced significant volatility, reaching a peak of $0.077 on December 31, 2024, representing a 670% increase from its launch price.
- October 2025: MLP reached its lowest recorded price of $0.00024, reflecting a substantial decline of approximately 99.7% from its peak value.
- February 2026: The token is trading at $0.0005192, showing a 38.24% increase over the past 24 hours, though still 99.3% below its historical high.
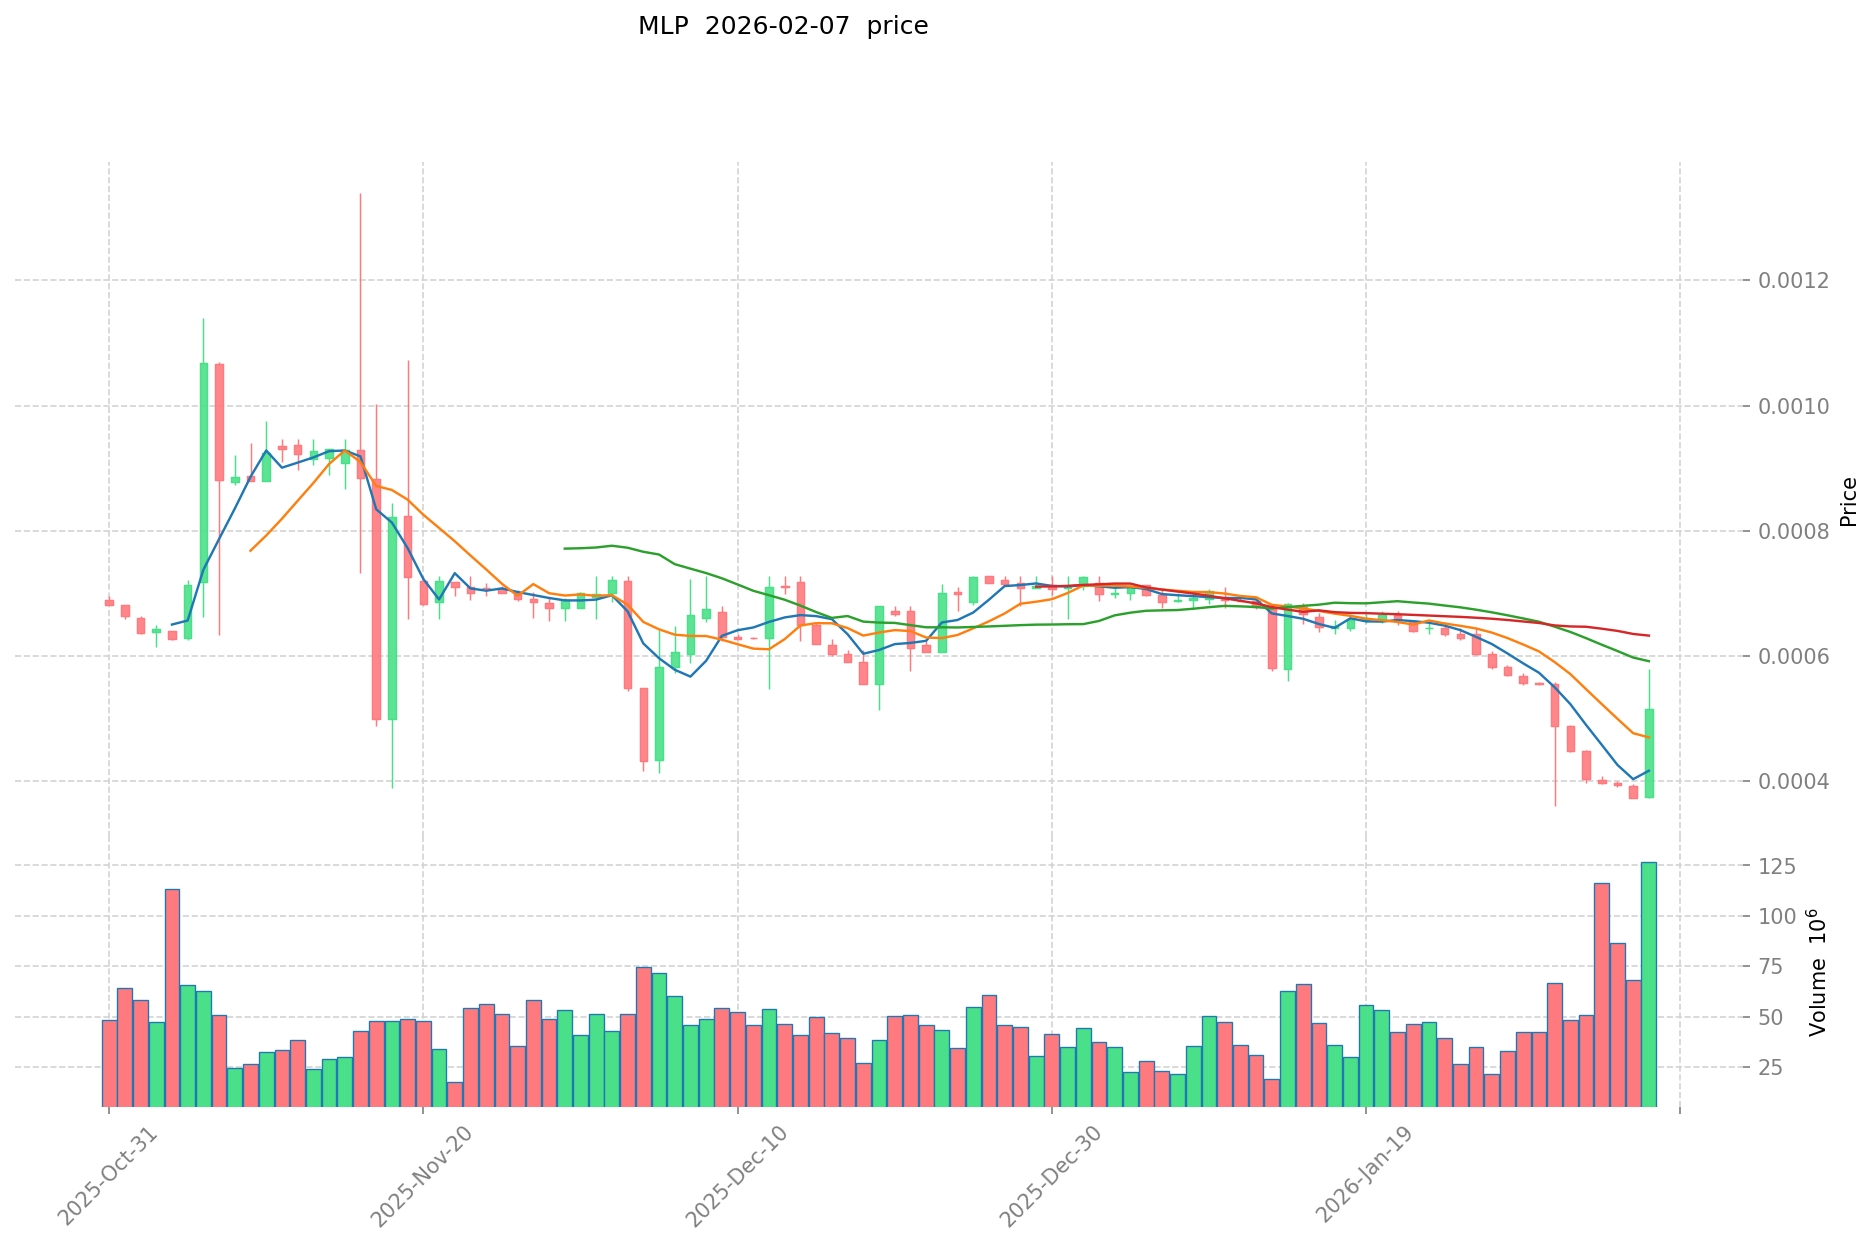
MLP Current Market Situation
As of February 7, 2026, Matrix Layer Protocol is trading at $0.0005192, with a 24-hour trading volume of $54,281. The token has demonstrated notable short-term price movement, gaining 38.24% in the last 24 hours and 0.70% in the past hour. However, the broader trend shows weakness, with a 7.93% decline over the past week and a 25.96% decrease over the past 30 days.
The project maintains a circulating supply of 618 million MLP tokens out of a maximum supply of 5 billion, representing a circulation rate of 12.36%. The current market capitalization stands at approximately $320,866, with a fully diluted valuation of $2.596 million. The token holds 15,621 holders and maintains a market dominance of 0.00010%.
MLP operates on the BSC (BEP-20) standard, with its contract address verified on BscScan. The cryptocurrency market sentiment indicator shows a reading of 6, indicating "Extreme Fear" conditions, which may be influencing broader market dynamics including MLP's price action.
Click to view the current MLP market price
MLP Market Sentiment Index
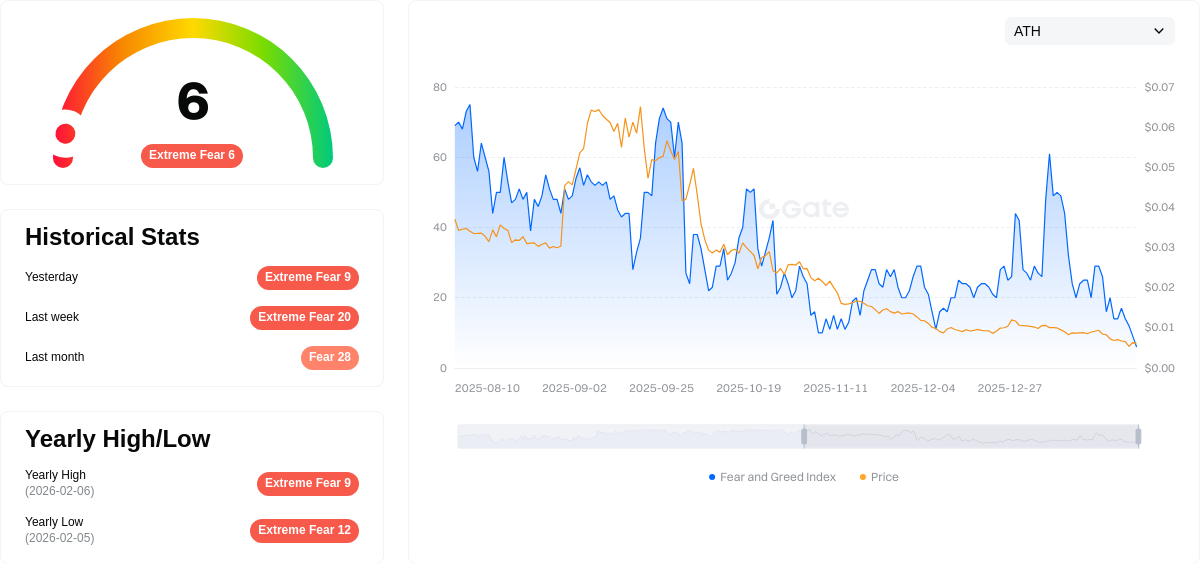
2026-02-07 Fear and Greed Index: 6 (Extreme Fear)
Click to view the current Fear & Greed Index
The cryptocurrency market is currently experiencing extreme fear, with the Fear and Greed Index hitting just 6 points. This exceptionally low reading indicates panic selling and significant market pessimism. Investors are showing strong risk aversion, with substantial capital flowing out of digital assets. Such extreme fear conditions often present contrarian opportunities, as markets typically stabilize after reaching these levels. Traders should exercise caution and consider their risk tolerance carefully during this volatile period.
MLP Holding Distribution
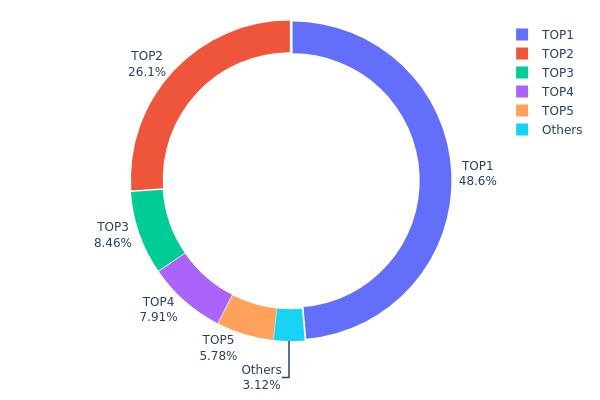
The holding distribution chart reflects the proportion of total token supply controlled by different wallet addresses, serving as a key indicator of decentralization and market structure. Current data reveals a highly concentrated holding pattern in MLP, with the top five addresses collectively controlling 96.85% of the total supply. The largest address alone holds 48.62% (2.43 billion tokens), while the second-largest holds 26.10% (1.31 billion tokens). This two-address dominance of nearly 75% of circulating supply represents an extreme centralization scenario.
Such concentration levels present significant structural risks to the MLP market. The dominant position of major holders grants them substantial influence over price formation, potentially enabling coordinated selling pressure that could trigger sharp volatility. The minimal 3.15% distribution among remaining addresses indicates limited retail participation and suggests the token operates more as a centralized entity rather than a decentralized asset. This structure creates vulnerability to single-point liquidity events and reduces market resilience against large-scale transactions.
From a market health perspective, MLP's current holding distribution reflects a nascent or tightly controlled ecosystem with limited organic adoption. The extreme imbalance between top holders and the broader community raises concerns about fair price discovery mechanisms and long-term sustainability. Investors should recognize that such concentration typically correlates with heightened volatility risk and reduced decentralization benefits that characterize mature blockchain assets.
Click to view current MLP Holding Distribution
| Top |
Address |
Holding Qty |
Holding (%) |
| 1 |
0x1434...79475c |
2431382.71K |
48.62% |
| 2 |
0x0d07...b492fe |
1305262.34K |
26.10% |
| 3 |
0x3c5d...f59647 |
422917.96K |
8.45% |
| 4 |
0x456f...5ccf09 |
395467.63K |
7.90% |
| 5 |
0x782d...7d7128 |
289115.61K |
5.78% |
| - |
Others |
155853.75K |
3.15% |
II. Core Factors Influencing MLP's Future Price
Market Volatility and Trading Dynamics
- Volatility Prediction Mechanism: Multi-layer perceptron (MLP) models demonstrate varying predictive capabilities depending on market conditions. Research indicates that MLP performance in forecasting price movements is influenced by sample size limitations and model parameter optimization. In volatile market environments, predictive accuracy tends to fluctuate significantly.
- Historical Pattern Analysis: Studies examining options markets have shown that MLP models exhibit relatively weaker predictive power in small-sample scenarios compared to ensemble methods like Random Forest and XGBoost. Historical volatility patterns suggest that MLP's effectiveness improves when combined with genetic algorithm (GA) optimization techniques.
- Current Market Impact: The model's predictive performance for future price trends depends heavily on feature selection quality and data preprocessing methods. Technical indicators processed through advanced techniques such as Maximum Overlap Discrete Wavelet Transform (MODWT) may enhance prediction accuracy.
Technical Indicators and Model Optimization
- Feature Engineering: Key factors affecting MLP price predictions include momentum indicators, volatility surface characteristics, and volume-price correlations. Research demonstrates that constructing approximately 16 features covering momentum, volatility levels, and correlation metrics can provide comprehensive market information coverage.
- Algorithm Enhancement: Genetic algorithm optimization has shown potential to improve MLP model parameters, including neuron quantities, neural layer configurations, and learning rates. Optimized GA-MLP models have demonstrated enhanced predictive performance, particularly during periods of significant price fluctuations.
- Performance Metrics: Evaluation indicators such as Mean Squared Error (MSE), Mean Absolute Error (MAE), and R² coefficients serve as critical benchmarks for assessing model effectiveness. Studies suggest that optimized MLP models can achieve R² values exceeding 0.98 under certain conditions.
Data Quality and Market Conditions
- Multi-source Data Integration: The integration of numerical information with textual data through embedding models represents an emerging approach to price prediction. Combining price-volume data with technical indicators may enhance overall model performance.
- Market Environment Adaptation: MLP model effectiveness varies across different market conditions. Research indicates that decision tree-based models tend toward bullish signals, while MLP models may exhibit bearish tendencies in certain scenarios, highlighting the importance of market context in model application.
- Predictive Horizon Considerations: Short-term price predictions (such as next-day returns) present greater challenges compared to volatility forecasting. Studies suggest that 5-day return predictions require more sophisticated feature engineering and model architectures to achieve satisfactory accuracy levels.
III. 2026-2031 MLP Price Predictions
2026 Outlook
- Conservative estimate: $0.00045
- Neutral estimate: $0.00051
- Optimistic estimate: $0.00062
Based on the forecast data, MLP may experience a slight decline of approximately 1% in 2026, with prices expected to fluctuate between $0.00045 and $0.00062. The average trading price is projected to settle around $0.00051 during this period.
2027-2029 Mid-term Outlook
- Market stage expectation: Recovery and gradual growth phase
- Price range predictions:
- 2027: $0.0004 - $0.00074, with an average of $0.00057 (9% increase)
- 2028: $0.00039 - $0.00095, with an average of $0.00065 (25% increase)
- 2029: $0.00063 - $0.00092, with an average of $0.0008 (54% increase)
- Key catalysts: The data suggests potential market momentum building through this period, with price change percentages showing progressive improvement from 9% to 54% year-over-year growth.
2030-2031 Long-term Outlook
- Baseline scenario: $0.0005 - $0.00109 (assuming steady market conditions and moderate adoption)
- Optimistic scenario: $0.00065 - $0.00137 (supported by enhanced market participation and technological developments)
- Transformational scenario: Prices could potentially reach the upper ranges if significant favorable conditions align, including broader ecosystem adoption and positive regulatory developments
The forecast indicates that MLP may show substantial growth potential between 2030 and 2031, with predicted increases of 66% and 87% respectively. By 2031, the average price is projected to reach $0.00097, with a potential high of $0.00137, representing significant appreciation from 2026 levels.
Note: These predictions are based on historical data analysis and market trends. Actual prices may vary significantly due to market volatility, regulatory changes, technological developments, and broader macroeconomic factors.
| Year |
Predicted High Price |
Predicted Average Price |
Predicted Low Price |
Price Change |
| 2026 |
0.00062 |
0.00051 |
0.00045 |
-1 |
| 2027 |
0.00074 |
0.00057 |
0.0004 |
9 |
| 2028 |
0.00095 |
0.00065 |
0.00039 |
25 |
| 2029 |
0.00092 |
0.0008 |
0.00063 |
54 |
| 2030 |
0.00109 |
0.00086 |
0.0005 |
66 |
| 2031 |
0.00137 |
0.00097 |
0.00065 |
87 |
IV. MLP Professional Investment Strategy and Risk Management
MLP Investment Methodology
(1) Long-term Holding Strategy
- Target Investors: Individuals who believe in the long-term development of decentralized communication infrastructure and AI-driven network protocols, with a medium to high risk tolerance
- Operational Recommendations:
- Consider accumulating positions during periods of market volatility, avoiding concentrated purchases at elevated price levels
- Monitor project development milestones, including technological upgrades and ecosystem expansion progress
- Storage Solution: Use Gate Web3 Wallet for secure asset custody, enabling multi-signature protection and regular backup of private keys
(2) Active Trading Strategy
- Technical Analysis Tools:
- Moving Averages: Utilize 20-day and 50-day moving averages to identify potential trend reversals and entry/exit points
- Volume Analysis: Monitor 24-hour trading volume changes to assess market participation intensity and liquidity conditions
- Swing Trading Key Points:
- Set reasonable stop-loss levels (recommended 5-10% below entry price) to control downside risk
- Take partial profits during significant price increases to lock in gains while maintaining exposure
MLP Risk Management Framework
(1) Asset Allocation Principles
- Conservative Investors: Allocate no more than 1-2% of cryptocurrency portfolio to MLP
- Aggressive Investors: May allocate 3-5% of cryptocurrency portfolio to MLP based on risk appetite
- Professional Investors: Employ dynamic allocation strategies based on market conditions and project development progress
(2) Risk Hedging Solutions
- Diversification Strategy: Combine MLP with other infrastructure protocol tokens to reduce single-asset concentration risk
- Position Management: Implement staged entry and exit strategies, avoiding full position deployment at single price levels
(3) Secure Storage Solutions
- Hot Wallet Recommendation: Gate Web3 Wallet for convenient trading and moderate-amount storage
- Cold Storage Solution: Transfer significant holdings to hardware wallets or multi-signature wallets for enhanced security
- Security Precautions: Never share private keys or seed phrases; verify recipient addresses carefully before transactions; enable two-factor authentication
V. MLP Potential Risks and Challenges
MLP Market Risks
- High Volatility: MLP has experienced significant price fluctuations, with a 98.9% decline over the past year, indicating substantial market instability
- Limited Liquidity: With a 24-hour trading volume of approximately $54,281 and listing on only one exchange, liquidity constraints may impact trade execution
- Low Market Capitalization: Current market cap of approximately $320,866 suggests higher susceptibility to market manipulation and price swings
MLP Regulatory Risks
- Infrastructure Protocol Uncertainty: Evolving regulatory frameworks for decentralized communication and AI-driven protocols may impact project operations
- Compliance Requirements: Potential future requirements for enhanced transparency and regulatory compliance could affect project development
- Cross-border Operational Challenges: Global regulatory differences may create obstacles for international expansion and adoption
MLP Technical Risks
- Implementation Complexity: Advanced features including multi-dimensional network topologies and AI integration present significant technical challenges
- Competition Pressure: Established infrastructure protocols and emerging competitors may limit market share and adoption rates
- Adoption Uncertainty: Success depends on widespread integration across IoT, Web3, and Metaverse ecosystems, which remains unproven
VI. Conclusion and Action Recommendations
MLP Investment Value Assessment
Matrix Layer Protocol presents an innovative approach to decentralized communication infrastructure with potential applications across IoT, Web3, and Metaverse sectors. However, the project faces significant challenges including limited market presence, high price volatility, and early-stage development risks. The substantial year-over-year price decline and low circulation ratio (12.36%) suggest considerable uncertainty. Long-term value depends on successful technological implementation, ecosystem partnerships, and market adoption, while short-term risks remain elevated due to liquidity constraints and market sentiment.
MLP Investment Recommendations
✅ Beginners: Exercise extreme caution; avoid allocating significant capital until the project demonstrates sustained development progress and improved liquidity metrics
✅ Experienced Investors: Consider small speculative positions (no more than 1-2% of portfolio) with strict stop-loss protocols and regular portfolio rebalancing
✅ Institutional Investors: Conduct comprehensive due diligence on technical architecture, team credentials, and competitive positioning before considering allocation
MLP Trading Participation Methods
- Spot Trading: Acquire MLP through Gate.com's spot trading platform with limit orders to optimize entry prices
- Dollar-Cost Averaging: Implement systematic accumulation strategies during market downturns to reduce timing risk
- Risk Monitoring: Regularly review project developments, market conditions, and portfolio performance to adjust positions accordingly
Cryptocurrency investments carry extremely high risks, and this article does not constitute investment advice. Investors should make prudent decisions based on their own risk tolerance and are advised to consult professional financial advisors. Never invest more than you can afford to lose.
FAQ
What is MLP (Master Limited Partnership) and how is its price determined?
MLP is a US energy sector corporate structure mainly for oil and gas pipeline operators. Its price is determined by transportation and processing volumes, market demand, and energy commodity prices. Revenue correlates directly with throughput and operational efficiency.
What are the main factors affecting MLP price?
MLP price is primarily influenced by energy infrastructure demand, commodity prices, dividend yields, interest rate changes, and market sentiment. These factors collectively determine MLP market performance and trading volume.
How to predict and analyze the future price of MLP?
Analyze MLP price trends by examining historical trading volume, market sentiment, on-chain metrics, and technical indicators. Monitor development milestones, ecosystem adoption, and macroeconomic factors to forecast potential price movements and identify market opportunities.
What are the risks of MLP investment and what causes price fluctuations?
MLP price fluctuations stem from market volatility, macroeconomic factors, liquidity conditions, and regulatory changes. Oil price movements, energy demand shifts, and policy adjustments directly impact MLP valuations and trading volume.
What are the advantages and disadvantages of MLP compared to other energy investment products?
MLP offers stable yields with lower drawdowns during oil price fluctuations. However, returns are influenced by upstream energy sector performance and may underperform other energy investments during rising oil prices.
MLP's distribution yield policy directly impacts its price performance. Higher dividend policies typically drive up MLP prices, while policy changes can cause yield fluctuations affecting market performance. Distribution policy is a key driver of MLP price movements.
* The information is not intended to be and does not constitute financial advice or any other recommendation of any sort offered or endorsed by Gate.