2026 MUSE Price Prediction: Expert Analysis and Market Forecast for Decentralized Music Platform Token

Introduction: MUSE's Market Position and Investment Value
Muse (MUSE), positioned as a governance token for the NFT20 decentralized exchange protocol, has been facilitating NFT tokenization and trading since its launch in 2021. As of 2026, MUSE maintains a market capitalization of approximately $240,749, with a circulating supply of around 827,602 tokens, and the price hovering around $0.29. This asset, recognized as a "governance and fee distribution mechanism" within the NFT liquidity infrastructure, continues to play a role in the decentralized NFT trading ecosystem.
This article will comprehensively analyze MUSE's price trajectory from 2026 to 2031, incorporating historical patterns, market supply-demand dynamics, ecosystem development, and macroeconomic conditions to provide investors with professional price forecasts and practical investment strategies.
I. MUSE Price History Review and Market Status
MUSE Historical Price Evolution Trajectory
- 2021: MUSE reached its all-time high of $124.14 on March 14, with significant price volatility during the early NFT market boom
- 2021: Price experienced sharp decline from its peak, dropping to its all-time low of $0.124326 on January 22
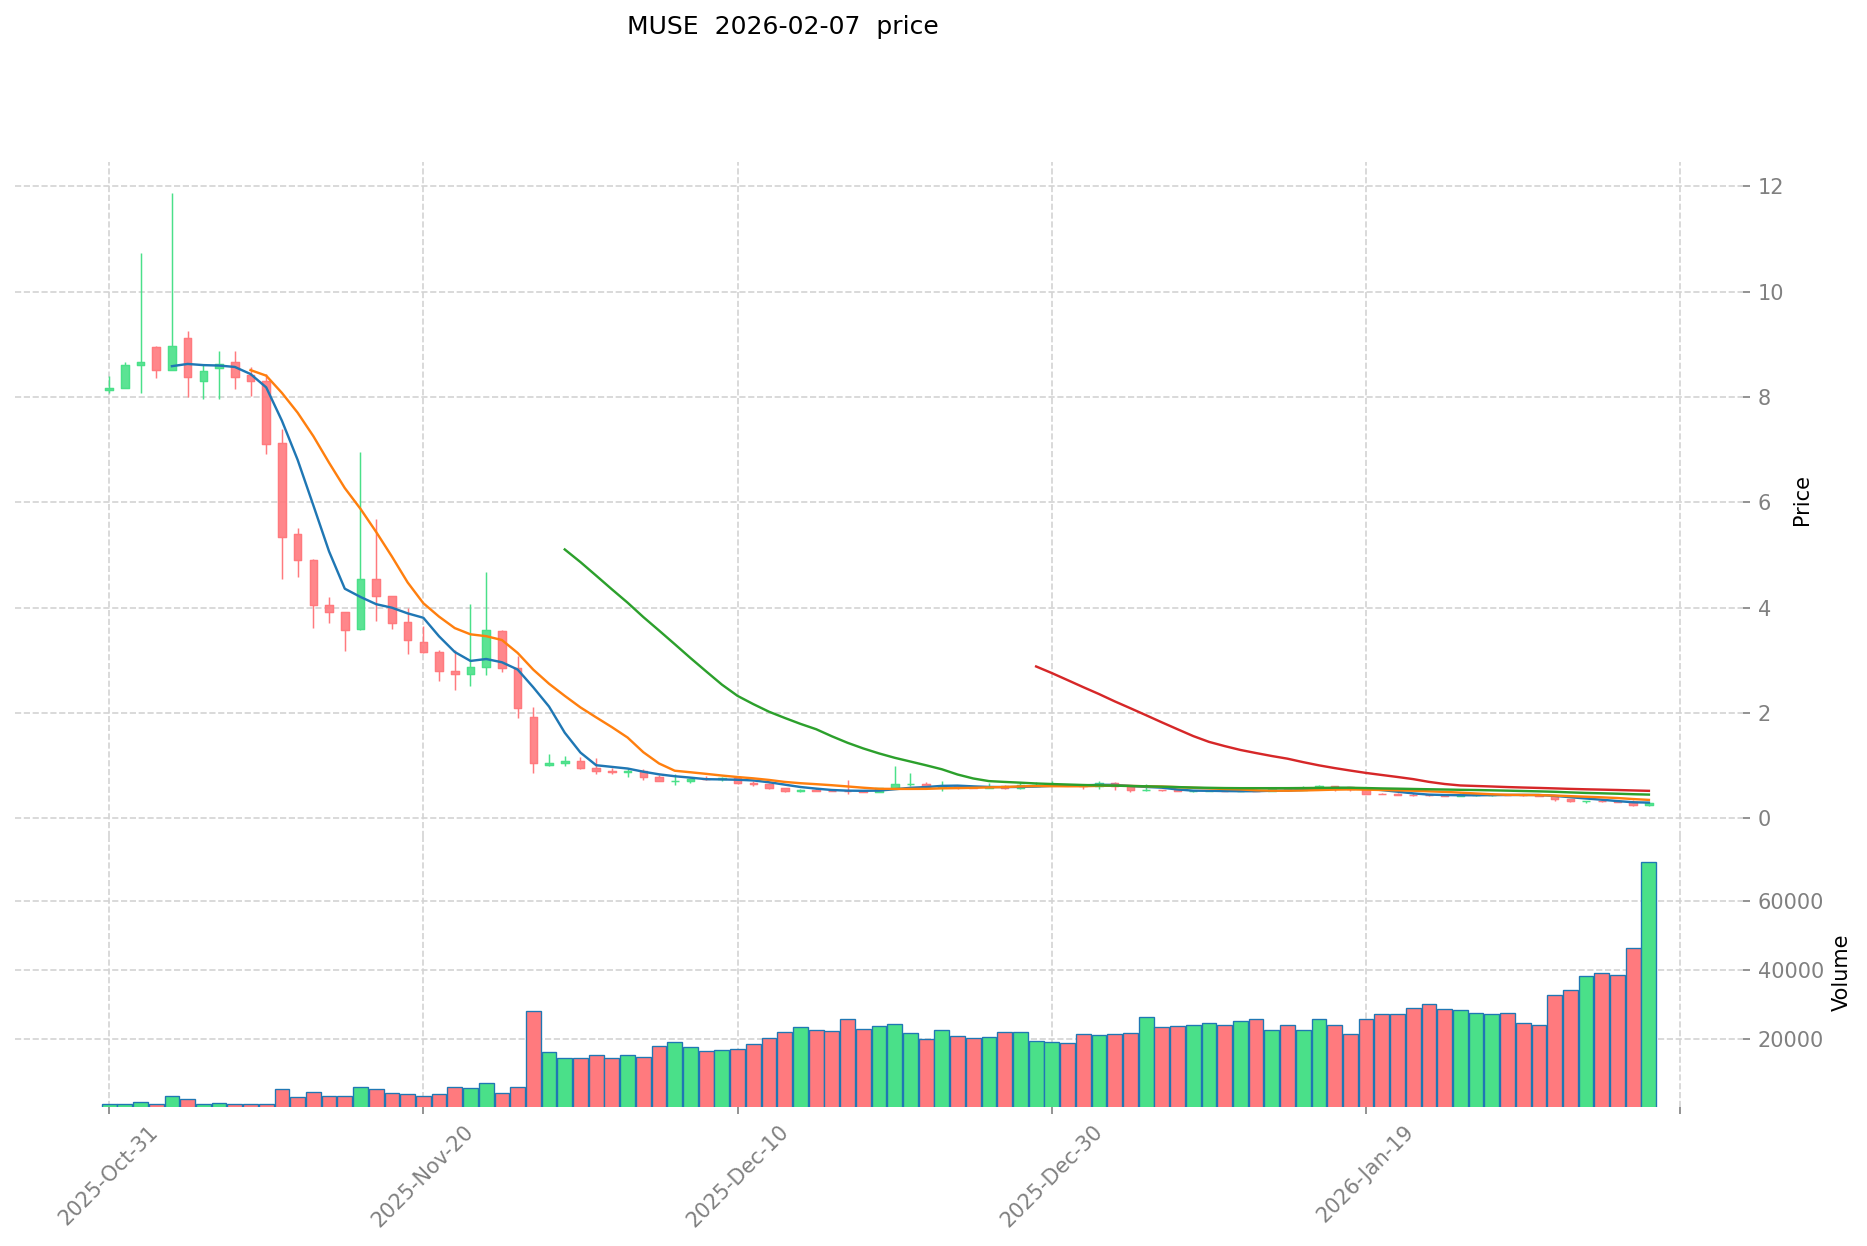
- 2025-2026: Market entered extended bearish cycle, with price declining approximately 97.17% over the past year from $10.28 to current levels
MUSE Current Market Status
As of February 8, 2026, MUSE is trading at $0.2909, representing a 0.54% decrease over the past 24 hours. The token has experienced notable bearish momentum across multiple timeframes, declining 21.09% over the past week and 43.01% over the past month.
The current 24-hour trading range shows MUSE fluctuating between $0.2803 and $0.30, with total trading volume reaching $20,144.18. The market capitalization stands at approximately $240,750, with a circulating supply of 827,603 MUSE tokens, representing 82.76% of the maximum supply of 1 million tokens.
MUSE maintains a fully diluted market cap of $241,213 and holds a market dominance of 0.0000096%. The market cap to FDV ratio of 82.76% indicates relatively high circulation compared to maximum supply. The token is currently held by 3,943 addresses.
Click to view current MUSE market price
MUSE Market Sentiment Index
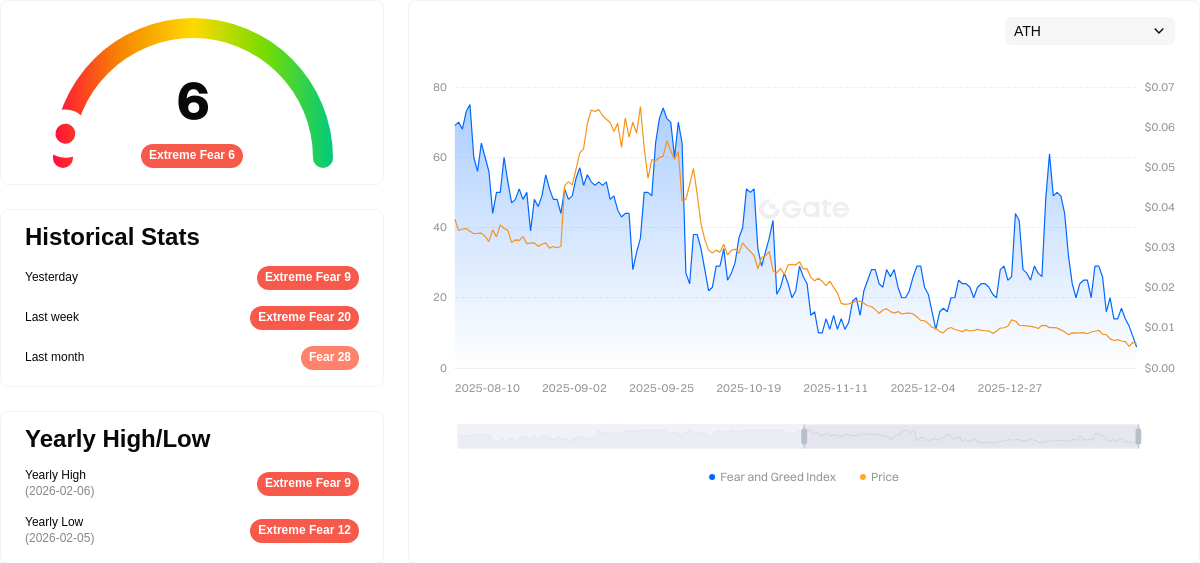
2026-02-07 Fear and Greed Index: 6 (Extreme Fear)
Click to view current Fear & Greed Index
The cryptocurrency market is experiencing extreme fear, with the Fear and Greed Index dropping to 6. This historically low reading reflects significant market anxiety and pessimism among investors. During such periods, panic selling often dominates, creating potential opportunities for contrarian traders. However, extreme fear typically indicates oversold conditions, suggesting a potential market bottom may be forming. Investors should exercise caution while remaining alert to potential recovery signals. Consider dollar-cost averaging strategies to manage risk during heightened volatility. Monitor key support levels closely for signs of stabilization or reversal.
MUSE Holding Distribution
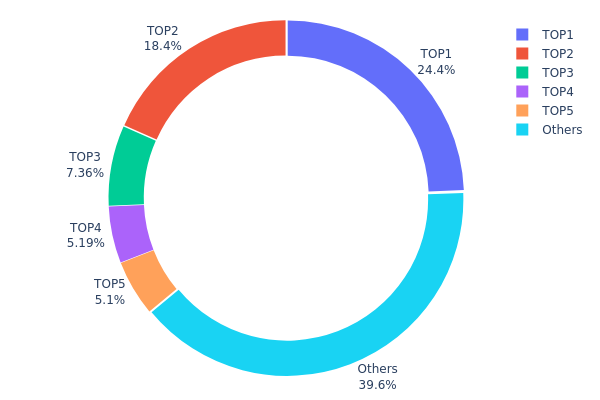
The holding distribution chart reveals the allocation of MUSE tokens across different wallet addresses, serving as a key indicator of decentralization and market structure. Based on the current data, the top 5 addresses collectively hold approximately 60.4% of the total supply, with the largest single address controlling 24.39% (202.32K tokens), followed by the second-largest holding 18.38% (152.41K tokens). The remaining 39.6% is distributed among other addresses, indicating a relatively concentrated ownership structure.
This concentration level suggests moderate centralization risks within the MUSE ecosystem. The dominance of the top two addresses, which together account for over 42% of the supply, creates potential vulnerabilities for price manipulation and heightened volatility. Large holders possess significant market influence, capable of triggering substantial price movements through coordinated selling or strategic accumulation. However, the presence of a diverse "Others" category holding nearly 40% provides some counterbalance, indicating active participation from smaller holders and reducing complete control by whale addresses.
From a market stability perspective, this distribution pattern reflects a developing token economy that has not yet achieved optimal decentralization. While the concentration is concerning for retail investors, it may also indicate early-stage institutional accumulation or strategic reserves held by project stakeholders. Monitoring changes in this distribution over time will be crucial for assessing whether MUSE is progressing toward broader token dispersion or maintaining its current centralized structure, both of which carry distinct implications for long-term price dynamics and ecosystem health.
Click to view the current MUSE Holding Distribution
| Top | Address | Holding Qty | Holding (%) |
|---|---|---|---|
| 1 | 0xa9d1...1d3e43 | 202.32K | 24.39% |
| 2 | 0x6fba...c5a148 | 152.41K | 18.38% |
| 3 | 0x20d2...70bf43 | 61.02K | 7.35% |
| 4 | 0x8502...0702f8 | 43.01K | 5.18% |
| 5 | 0x1fdc...184476 | 42.31K | 5.10% |
| - | Others | 328.12K | 39.6% |
II. Core Factors Influencing MUSE's Future Price
Supply Mechanism
- Fixed Supply: MUSE has established a fixed maximum supply, and this scarcity characteristic may help drive prices upward when demand grows.
- Historical Pattern: Crypto assets with fixed supply have historically tended to experience price appreciation during periods of increased demand, as the limited availability creates upward pressure on valuations.
- Current Impact: The fixed supply structure may positively influence MUSE's price trajectory as market interest develops, though actual market dynamics and overall cryptocurrency market conditions remain important determining factors.
Institutional and Major Holder Dynamics
Insufficient information is available in the provided materials regarding institutional holdings, enterprise adoption, or national-level policies specifically related to MUSE.
Macroeconomic Environment
- Monetary Policy Impact: Overall cryptocurrency market volatility, influenced by broader macroeconomic conditions and central bank policies, may affect MUSE's price performance.
- Inflation Hedge Attributes: Crypto assets with fixed supply characteristics have historically been considered by some market participants as potential inflation hedges, though this relationship varies based on market conditions.
- Geopolitical Factors: International trade tensions and geopolitical developments may indirectly influence cryptocurrency market sentiment and price movements.
Technology Development and Ecosystem Building
The provided materials do not contain specific information regarding MUSE's technology upgrades, ecosystem applications, or DApp developments that would allow for detailed analysis in this section.
III. 2026-2031 MUSE Price Prediction
2026 Outlook
- Conservative prediction: $0.282-$0.291
- Neutral prediction: Around $0.291
- Optimistic prediction: Up to $0.300 (requires favorable market conditions)
Based on current analysis, MUSE is expected to maintain relative stability in 2026, with price fluctuations remaining within a narrow range. The predicted average price stands at approximately $0.291, reflecting the token's potential consolidation phase in the near term.
2027-2029 Mid-term Outlook
- Market stage expectation: Potential growth phase with moderate volatility
- Price range predictions:
- 2027: $0.180-$0.345
- 2028: $0.227-$0.333
- 2029: $0.294-$0.451
- Key catalysts: Market adoption trends, ecosystem development progress, and broader crypto market sentiment
During this mid-term period, MUSE may experience gradual price appreciation, with 2029 showing stronger upward momentum. The widening price range suggests increased market activity and potential volatility as the project matures.
2030-2031 Long-term Outlook
- Baseline scenario: $0.198-$0.541 (assuming steady ecosystem growth)
- Optimistic scenario: $0.353-$0.651 (contingent on enhanced utility and adoption)
- Transformative scenario: Potential to reach $0.651 by 2031 (under exceptionally favorable conditions including significant partnership developments and market expansion)
The long-term projection indicates substantial growth potential for MUSE, with 2031 forecasts showing possible appreciation of up to 59% compared to earlier periods. However, investors should note that cryptocurrency markets remain inherently volatile, and actual performance may vary based on numerous factors including regulatory developments, technological advancements, and overall market conditions.
- February 8, 2026: MUSE trading within predicted range (consolidation phase)
| Year | Predicted High Price | Predicted Average Price | Predicted Low Price | Price Change |
|---|---|---|---|---|
| 2026 | 0.29963 | 0.2909 | 0.28217 | 0 |
| 2027 | 0.34546 | 0.29526 | 0.18011 | 1 |
| 2028 | 0.33318 | 0.32036 | 0.22746 | 10 |
| 2029 | 0.45094 | 0.32677 | 0.29409 | 12 |
| 2030 | 0.54051 | 0.38885 | 0.19832 | 33 |
| 2031 | 0.65055 | 0.46468 | 0.35316 | 59 |
IV. MUSE Professional Investment Strategy and Risk Management
MUSE Investment Methodology
(1) Long-term Holding Strategy
- Suitable for: Investors interested in NFT market infrastructure and DeFi governance token exposure
- Operational Recommendations:
- Consider cost averaging during market downturns, given MUSE's significant decline from historical highs
- Monitor NFT20 DEX volume and fee generation as indicators of protocol health
- Utilize Gate Web3 Wallet for secure long-term storage with multi-signature protection
(2) Active Trading Strategy
- Technical Analysis Tools:
- Volume Analysis: Daily trading volume around $20,144 suggests limited liquidity, requiring careful position sizing
- Price Range Monitoring: Current 24H range ($0.2803-$0.30) indicates narrow volatility suitable for scalping
- Swing Trading Considerations:
- Monitor NFT market sentiment cycles for optimal entry points
- Set stop-loss orders due to relatively low market cap and liquidity risks
MUSE Risk Management Framework
(1) Asset Allocation Principles
- Conservative Investors: 0.5-1% of crypto portfolio
- Aggressive Investors: 2-3% of crypto portfolio
- Professional Investors: Up to 5% with active hedging strategies
(2) Risk Hedging Solutions
- Portfolio Diversification: Balance MUSE with established NFT marketplace tokens and blue-chip crypto assets
- Liquidity Management: Maintain sufficient stablecoin reserves given MUSE's limited exchange availability
(3) Secure Storage Solutions
- Hot Wallet Recommendation: Gate Web3 Wallet for active trading and governance participation
- Cold Storage Option: Hardware wallet solutions for long-term holdings exceeding trading needs
- Security Precautions: Enable two-factor authentication, verify contract address (0xb6ca7399b4f9ca56fc27cbff44f4d2e4eef1fc81), never share private keys
V. MUSE Potential Risks and Challenges
MUSE Market Risks
- Extreme Volatility: 97.17% decline over the past year demonstrates substantial downside risk
- Limited Liquidity: Trading on only one exchange with approximately $20K daily volume creates exit challenges
- Market Cap Vulnerability: With a market cap near $240K and dominance of 0.0000096%, susceptible to whale manipulation
MUSE Regulatory Risks
- NFT Classification Uncertainty: Evolving regulatory frameworks may impact NFT tokenization protocols
- DeFi Governance Scrutiny: Increasing regulatory attention on decentralized governance structures could affect utility
- Cross-border Compliance: P2P protocol operations may face jurisdiction-specific restrictions
MUSE Technical Risks
- Smart Contract Vulnerabilities: Protocol dependencies on Ethereum network expose users to potential exploit risks
- Protocol Adoption: Limited NFT20 DEX usage compared to competitors may impact long-term viability
- Token Utility Constraints: Fee-sharing mechanism relies on consistent DEX volume to provide value to holders
VI. Conclusion and Action Recommendations
MUSE Investment Value Assessment
MUSE presents a high-risk, speculative opportunity in the NFT infrastructure space. While the protocol offers permissionless NFT tokenization and governance features, the token has experienced severe depreciation from its all-time high of $124.14 to current levels near $0.29. The low market cap, limited exchange availability, and declining momentum over multiple timeframes suggest significant headwinds. Long-term value proposition depends on NFT market recovery and NFT20 protocol adoption, while short-term risks include continued downward pressure and liquidity constraints.
MUSE Investment Recommendations
✅ Beginners: Avoid allocation until demonstrating understanding of NFT markets and high-risk token dynamics; consider observation period ✅ Experienced Investors: Limit exposure to 1-2% of portfolio; employ strict stop-loss discipline; monitor NFT20 DEX metrics for fundamental changes ✅ Institutional Investors: Conduct thorough due diligence on protocol usage and competitive positioning; consider venture-style allocation with complete loss acceptance
MUSE Trading Participation Methods
- Spot Trading on Gate.com: Primary venue for MUSE transactions with standard trading pairs
- Governance Participation: Hold MUSE to vote on NFT20 protocol proposals and earn fee-sharing rewards
- Liquidity Provision: Explore opportunities to provide liquidity on supported DEX platforms for yield generation
Cryptocurrency investment carries extremely high risks, and this article does not constitute investment advice. Investors should make prudent decisions based on their own risk tolerance and are advised to consult professional financial advisors. Never invest more than you can afford to lose.
FAQ
What is MUSE token and what are its main uses and application scenarios?
MUSE token powers the Muse Network, enabling liquidity mining, asset staking, and derivatives trading. It facilitates futures contracts, lending protocols, and decentralized asset trading, driving utility across DeFi applications.
What are the main factors affecting MUSE price?
MUSE price is primarily influenced by its fixed supply mechanism, which creates scarcity and supports price appreciation as demand grows. Market demand fluctuations, trading volume, and overall cryptocurrency market sentiment also play significant roles in determining MUSE's price movements.
How to conduct technical analysis and price prediction for MUSE?
Analyze MUSE using moving averages, oscillators, and pivot points on TradingView. Monitor trading volume and price trends across timeframes. Expert predictions for 2026 vary: some forecast declines to $0.22, others predict higher levels. Conduct thorough personal research before trading decisions.
What is the historical price performance of MUSE? What is the range of past price fluctuations?
MUSE has experienced significant price volatility over the past year. The token has fluctuated between several dollars at its lows and hundreds of dollars at its peaks. Current price dynamics reflect strong market interest and typical crypto market cycles.
2024年及未来MUSE的价格预测和前景如何?
MUSE展现强劲增长潜力。随着生态扩展和用户采用增加,预计2024-2026年价格将稳步上升。市场需求和技术创新将驱动长期升值。未来前景看好。
What are the risks and uncertainties in MUSE price predictions?
MUSE price predictions face market volatility, regulatory changes, and technology updates. Prices are influenced by broader crypto market movements and project development pace, creating inherent uncertainty in forecasting.
How does MUSE's price performance compare to similar tokens?
MUSE exhibits significant price volatility compared to similar tokens. Having peaked at $125.90 historically, it currently trades around $0.12, reflecting dramatic fluctuations. With a market cap of $235,080 and 61.33% circulating supply, MUSE shows distinctive price dynamics distinct from mainstream alternatives.
Share
Content
Introduction: MUSE's Market Position and Investment Value
I. MUSE Price History Review and Market Status
II. Core Factors Influencing MUSE's Future Price
III. 2026-2031 MUSE Price Prediction
IV. MUSE Professional Investment Strategy and Risk Management
V. MUSE Potential Risks and Challenges
VI. Conclusion and Action Recommendations
FAQ
How to Buy Cryptocurrency


Trending Cryptocurrencies


Treasure NFT Marketplace: A 2025 Guide for Web3 Gamers and Investors
What are the new trends in the NFT market in 2025?

NFT Treasure Hunting: Top Strategies for Web3 Collectors in 2025

How to Create and Sell NFTs: A Step-by-Step Guide for Beginners

The technical principles and application scenarios of 2025 NFTs

How to Create an NFT in 2025: A Step-by-Step Guide

2026 WSDM Price Prediction: Advanced Machine Learning Models and Market Trend Analysis for Next-Generation Search and Data Mining

2026 SCT Price Prediction: Expert Analysis and Market Forecast for Shardeum's Native Token

Is Funtico (TICO) a good investment?: A Comprehensive Analysis of Token Fundamentals, Market Potential, and Risk Factors for 2024

Is S.C. Corinthians Fan Token (SCCP) a good investment?: An in-depth analysis of risks, benefits, and market potential for crypto enthusiasts

Is Xcad Network (XCAD) a good investment?: A Comprehensive Analysis of Token Utility, Market Potential, and Risk Factors