This comprehensive analysis examines Overlay Protocol (OVL) token's market trajectory from 2026 through 2031, combining historical price patterns, macroeconomic factors, and ecosystem development insights. As a pioneering decentralized data derivatives protocol, OVL currently trades at $0.057 with a market cap of $810,422, having experienced significant volatility since its 2025 launch. The article forecasts OVL's price movement across multiple scenarios: conservative to optimistic predictions for 2026 ($0.04046-$0.08376), followed by anticipated gradual growth through 2031 potentially reaching $0.15284 under transformative conditions. Key value drivers include protocol innovation, expanded data feed adoption, and institutional market participation. Professional investment strategies address long-term holding and active trading approaches, while comprehensive risk management frameworks guide portfolio allocation across investor types. Critical risk factors include market volatility, regulatory uncertainties,
Introduction: OVL's Market Position and Investment Value
Overlay Protocol (OVL), as a pioneering decentralized data derivatives protocol, has been operating since its launch in 2025, introducing a novel approach to trading real-world metrics on-chain without counterparty requirements. As of 2026, OVL maintains a market capitalization of approximately $810,422, with a circulating supply of around 14.22 million tokens, and the price hovering around $0.057. This asset, recognized as an innovative solution for long-tail asset liquidity challenges, is playing an increasingly significant role in the decentralized finance derivatives space.
This article will comprehensively analyze OVL's price trajectory from 2026 to 2031, combining historical patterns, market supply-demand dynamics, ecosystem development, and macroeconomic conditions to provide investors with professional price forecasts and practical investment strategies.
I. OVL Price History Review and Market Status
Historical Price Evolution of OVL
- 2025: OVL reached a price peak of $0.5 on August 14, marking a significant milestone in its early trading period
- 2026: The token experienced substantial correction, declining to a low of $0.03171 on January 5, reflecting broader market pressures
Current Market Dynamics of OVL
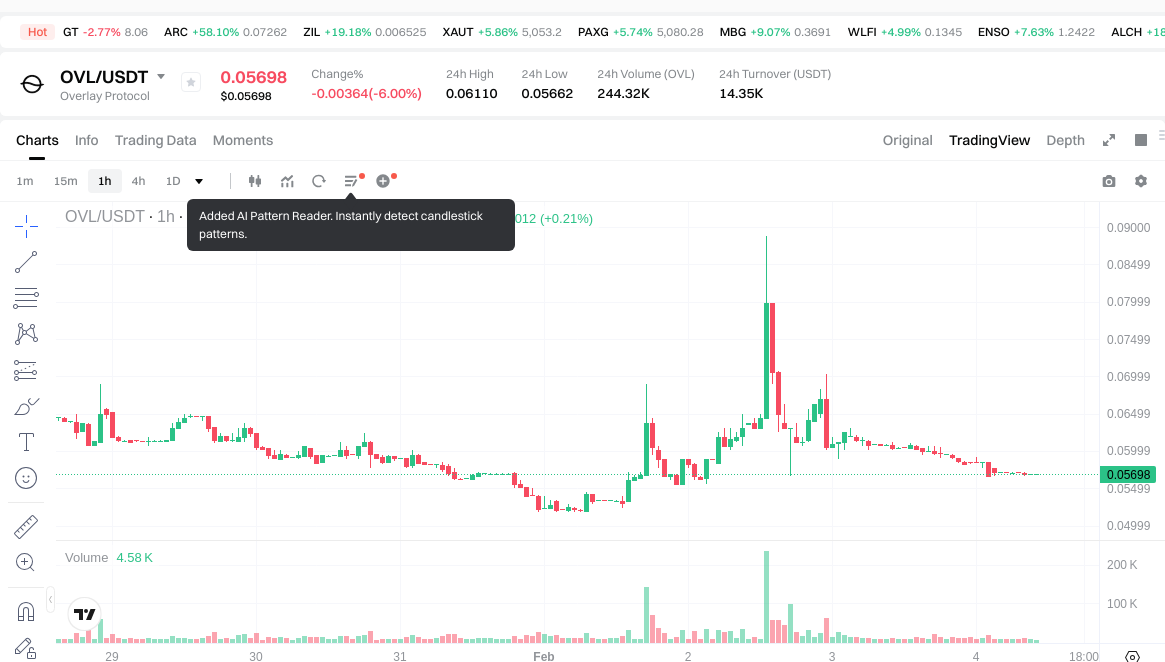
As of February 4, 2026, OVL is trading at $0.05698, showing a recovery from its recent low point. The 24-hour trading volume stands at $14,321.19, with the price fluctuating between $0.05662 and $0.0611 during this period.
The token's market capitalization is approximately $810,422, with a fully diluted valuation of $5.06 million. Currently, 14.22 million OVL tokens are in circulation, representing 18.12% of the maximum supply of 100 million tokens. The total supply is set at 88.89 million tokens.
Recent price movements indicate mixed market sentiment. Over the past hour, OVL declined by 0.21%, and the 24-hour change shows a 6.4% decrease. The 7-day performance reflects a 12.13% decline. However, the 30-day trend demonstrates notable strength with a 55.40% increase. The yearly performance shows an 89.49% decline from previous levels.
The token maintains a presence on 7 exchanges and has attracted 2,306 holders. OVL's market dominance stands at 0.00018%, positioning it as a smaller-cap asset within the cryptocurrency ecosystem.
Click to view current OVL market price
OVL Market Sentiment Indicator
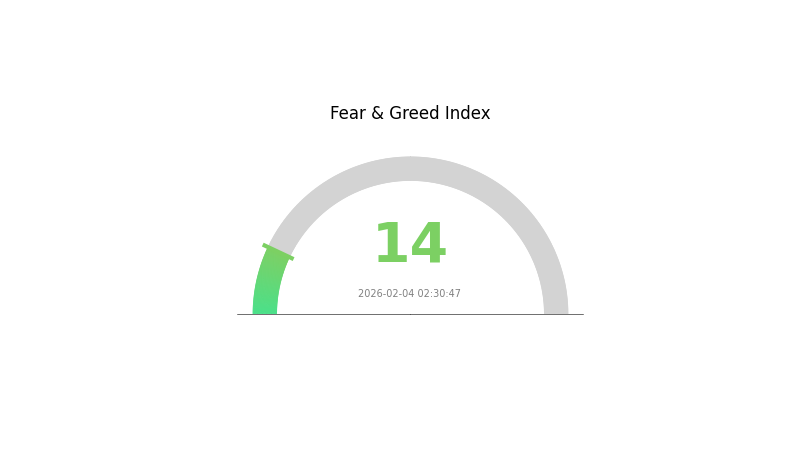
2026-02-04 Fear and Greed Index: 14 (Extreme Fear)
Click to view current Fear & Greed Index
The cryptocurrency market is experiencing extreme fear, with the Fear and Greed Index plummeting to 14. This exceptional low reading signals intense market pessimism and widespread investor anxiety. During such periods, selling pressure typically intensifies as traders rush to exit positions. However, historically, extreme fear has often preceded market recovery opportunities. Risk-averse investors should exercise caution, while contrarian traders may identify potential entry points. Monitor market fundamentals closely and consider your risk tolerance before making trading decisions on Gate.com.
OVL 持仓分布
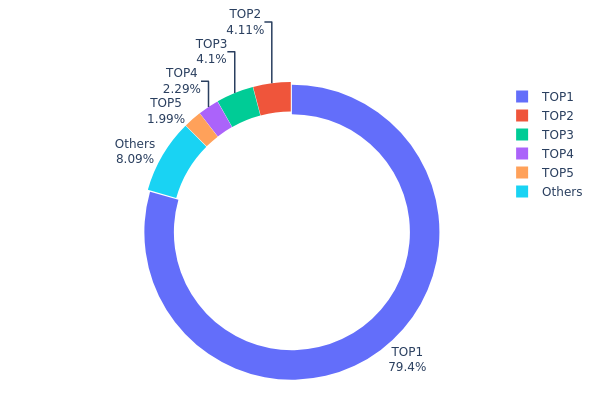
The address holding distribution chart reflects the dispersion of token ownership across different wallet addresses, serving as a critical indicator of decentralization and market structure health. By analyzing the concentration of holdings among top addresses, investors can assess potential risks related to price manipulation, liquidity pressure, and overall market stability.
Current data reveals a highly concentrated holding pattern for OVL, with the top address controlling approximately 79.42% of the total supply (70,527K tokens). The second and third largest holders possess 4.11% and 4.09% respectively, while the top five addresses collectively account for 91.88% of all tokens. The remaining 8.12% is distributed among other participants, indicating extremely limited circulation in the broader market.
This severe concentration presents significant structural concerns. The dominant position of the largest holder creates substantial centralization risks, potentially enabling unilateral influence over price discovery and market dynamics. Such distribution patterns typically correlate with elevated volatility, as large-scale movements by major holders can trigger disproportionate market reactions. Additionally, the limited token dispersion among smaller participants suggests constrained organic trading activity and reduced market depth, which may amplify price fluctuations during periods of increased trading volume.
Click to view current OVL Holding Distribution
| Top |
Address |
Holding Qty |
Holding (%) |
| 1 |
0x4e5c...a034ad |
70527.00K |
79.42% |
| 2 |
0x6e0b...bed395 |
3651.37K |
4.11% |
| 3 |
0x73d8...4946db |
3639.00K |
4.09% |
| 4 |
0x4982...6e89cb |
2031.00K |
2.28% |
| 5 |
0xadde...8ec7b6 |
1766.68K |
1.98% |
| - |
Others |
7184.91K |
8.12% |
II. Core Factors Influencing OVL's Future Price
Macroeconomic Environment
-
Global Economic Growth: Global economic growth rates serve as a fundamental driver of OVL price trends. Economic expansion typically correlates with increased investment flows into digital assets, while economic contraction may lead to risk-off sentiment. According to research on price influencing factors, macroeconomic indicators including GDP growth rates play significant roles in asset price determination.
-
Monetary Policy Impact: Central bank policies and interest rate adjustments influence capital allocation decisions across asset classes. Changes in monetary conditions affect investor appetite for alternative assets and can shift market dynamics considerably.
-
Labor Market Dynamics: Employment trends and workforce productivity changes impact overall economic activity levels. Labor market shifts, particularly in technology sectors, can influence adoption rates and utilization patterns that affect demand fundamentals.
Technology Development and Innovation
-
Innovation Rates: The pace of technological advancement represents a critical factor in OVL's value proposition. Faster innovation cycles in related technology sectors may enhance utility and drive broader adoption, while slower technological progress could limit growth potential.
-
Technology Adoption Rates: The speed at which enterprises and individuals adopt relevant technologies directly influences network effects and practical utility. Research indicates that advanced technology adoption rates significantly impact productivity and economic value creation.
-
Automation and Digital Transformation: Broader trends toward automation and digital infrastructure development create favorable conditions for technology-enabled solutions. These macro trends can support increased integration and utilization over time.
Market Demand and Sentiment
-
Market Sentiment: Investor confidence and risk appetite play crucial roles in price formation. Market sentiment responds to news flows, regulatory developments, and broader financial market conditions.
-
Demand Patterns: Shifts in user demand, whether from institutional participants or individual users, directly impact price dynamics. Demand drivers include utility considerations, speculative interest, and portfolio diversification motives.
-
Competitive Landscape: The evolving competitive environment within the digital asset space influences relative positioning and market share considerations.
Regulatory Environment
-
Regulatory Changes: Policy frameworks and regulatory clarity significantly affect market participation and institutional adoption. Evolving regulatory approaches across different jurisdictions create both opportunities and constraints for market development.
-
Compliance Requirements: Changes in compliance standards and reporting obligations influence operational considerations and market access for various participant categories.
-
Cross-border Considerations: International regulatory coordination and divergence affect cross-border flows and global market integration dynamics.
III. 2026-2031 OVL Price Forecast
2026 Outlook
- Conservative prediction: $0.04046 - $0.05698
- Neutral prediction: $0.05698
- Optimistic prediction: $0.08376 (requires favorable market conditions and increased adoption)
2027-2029 Outlook
- Market stage expectation: The token is anticipated to enter a gradual growth phase, with price fluctuations reflecting broader market sentiment and project development milestones.
- Price range predictions:
- 2027: $0.06263 - $0.07389 (approximately 23% increase)
- 2028: $0.06347 - $0.10459 (approximately 26% increase)
- 2029: $0.05743 - $0.10338 (approximately 55% increase)
- Key catalysts: Enhanced protocol utility, potential partnerships, and expanding user base could serve as primary drivers for price appreciation during this period.
2030-2031 Long-term Outlook
- Baseline scenario: $0.07094 - $0.10929 in 2030 (assuming steady adoption and market stability, approximately 68% increase)
- Optimistic scenario: $0.09335 - $0.15284 in 2031 (contingent on significant ecosystem expansion and favorable regulatory environment, approximately 80% increase)
- Transformative scenario: Prices could exceed $0.15284 (under conditions of widespread institutional adoption and breakthrough technical innovations)
- 2026-02-04: OVL trading within the projected baseline range, reflecting early-stage market positioning
| Year |
Predicted High Price |
Predicted Average Price |
Predicted Low Price |
Price Change |
| 2026 |
0.08376 |
0.05698 |
0.04046 |
0 |
| 2027 |
0.07389 |
0.07037 |
0.06263 |
23 |
| 2028 |
0.10459 |
0.07213 |
0.06347 |
26 |
| 2029 |
0.10338 |
0.08836 |
0.05743 |
55 |
| 2030 |
0.10929 |
0.09587 |
0.07094 |
68 |
| 2031 |
0.15284 |
0.10258 |
0.09335 |
80 |
IV. OVL Professional Investment Strategy and Risk Management
OVL Investment Methodology
(1) Long-term Holding Strategy
- Suitable for: Investors focused on decentralized data derivatives and DeFi innovation
- Operational Recommendations:
- Monitor Overlay Protocol's expansion of tradable real-world data feeds and market adoption
- Track the development of the dynamic mint/burn model and its effectiveness in solving liquidity issues
- Storage Solution: Utilize Gate Web3 Wallet for secure OVL storage with BSC network support
(2) Active Trading Strategy
- Technical Analysis Tools:
- Volume Analysis: Monitor the current 24h trading volume ($14,321) relative to market cap to gauge liquidity conditions
- Price Range Tracking: Observe movements within the recent 24h range ($0.05662-$0.0611) for entry/exit points
- Swing Trading Considerations:
- Note the significant 30-day gain of 55.40%, suggesting recent momentum shifts
- Consider the 7-day decline of 12.13% when timing short-term positions
OVL Risk Management Framework
(1) Asset Allocation Principles
- Conservative Investors: 1-2% of crypto portfolio
- Aggressive Investors: 3-5% of crypto portfolio
- Professional Investors: 5-8% with active monitoring
(2) Risk Hedging Approaches
- Portfolio Diversification: Balance OVL exposure with established DeFi protocols
- Position Sizing: Limit single position exposure given the relatively low market cap ($810,422)
(3) Secure Storage Solutions
- Hot Wallet Recommendation: Gate Web3 Wallet for convenient trading and staking
- Cold Storage Option: Hardware wallet solutions for long-term holdings exceeding trading needs
- Security Precautions: Verify contract address (0x1f34c87ded863fe3a3cd76fac8ada9608137c8c3 on BSC) before transactions and avoid phishing links
V. OVL Potential Risks and Challenges
OVL Market Risks
- High Volatility: The token experienced an 89.49% decline over one year, indicating substantial price fluctuation potential
- Low Liquidity: With a market cap of approximately $810,000 and ranking at 2663, liquidity may be limited during market stress
- Limited Trading Volume: 24h volume of $14,321 suggests potential slippage for larger orders
OVL Regulatory Risks
- Data Derivatives Regulation: Emerging regulatory frameworks for on-chain data derivatives may impact protocol operations
- Cross-jurisdictional Compliance: Trading real-world metrics on-chain may face varying regulatory interpretations across regions
- DeFi Oversight Evolution: Increasing regulatory scrutiny of decentralized protocols could affect token utility and adoption
OVL Technical Risks
- Smart Contract Vulnerabilities: The counterparty-free trading model relies on complex mint/burn mechanisms that require rigorous security audits
- Oracle Dependencies: Accuracy and reliability of real-world data feeds are critical to protocol functionality
- Network Risks: As a BSC-based token, OVL inherits the underlying blockchain's technical risks and network congestion issues
VI. Conclusion and Action Recommendations
OVL Investment Value Assessment
Overlay Protocol represents an innovative approach to decentralized data derivatives, addressing liquidity challenges in long-tail assets through its counterparty-free trading model. The recent 30-day performance of +55.40% indicates growing market interest, while the protocol's ability to tokenize diverse real-world metrics offers unique value proposition. However, the significant one-year decline of 89.49%, low market cap, and limited liquidity present considerable short-term volatility risks. The project's long-term value depends on successful execution of its roadmap, expansion of tradable data feeds, and broader market adoption of decentralized derivatives.
OVL Investment Recommendations
✅ Beginners: Consider micro-allocation (under 1% of portfolio) only after thoroughly understanding data derivatives and DeFi mechanisms
✅ Experienced Investors: Allocate 2-4% for speculative exposure while closely monitoring protocol development milestones and trading volume trends
✅ Institutional Investors: Evaluate protocol fundamentals and market structure before position sizing, with emphasis on liquidity assessment and risk-adjusted return expectations
OVL Trading Participation Methods
- Spot Trading: Purchase OVL on Gate.com and other supporting exchanges for direct token exposure
- DeFi Participation: Engage with Overlay Protocol's native platform to access data derivatives trading features
- Phased Accumulation: Implement dollar-cost averaging strategy to mitigate entry timing risks given the token's volatility profile
Cryptocurrency investment carries extremely high risks, and this article does not constitute investment advice. Investors should make prudent decisions based on their own risk tolerance and are advised to consult professional financial advisors. Never invest more than you can afford to lose.
FAQ
What is OVL token? What are its main uses and value?
OVL is the core token of the Overlay trading protocol, enabling users to predict stream data trends with long and short positions. It serves liquidity management and market prediction functions, with value derived from its utility in decentralized data trading and trend forecasting.
What is OVL's historical price performance and what are the main factors affecting its price fluctuations?
OVL's price is primarily influenced by market sentiment, trading volume, and technical developments. Macroeconomic conditions, liquidity cycles, and regulatory signals also significantly impact price movements.
What is the price prediction for OVL in 2024-2025? How do professional analysts view it?
OVL price forecasts for 2024-2025 remain uncertain with divided analyst opinions. Market dynamics are complex, influenced by platform adoption, trading volume, and broader crypto trends. Predictions range widely depending on protocol developments and market conditions.
OVL excels in liquidity and capital efficiency by supporting real asset trading, offering superior transparency and security compared to synthetic asset platforms. Its tokenomics enable higher composability and capital reuse within DeFi ecosystem.
What are the main risks and opportunities of investing in OVL?
Main risks include market volatility and regulatory uncertainties. Key opportunities lie in growing demand for decentralized derivatives and OVL's protocol innovation driving long-term value appreciation.
How is the liquidity and trading volume of OVL? Which exchanges can trade it?
OVL maintains strong liquidity and trading volume across multiple platforms. The token is actively traded on major exchanges with deep order books and competitive spreads, ensuring efficient price discovery and seamless trading execution for users.
* The information is not intended to be and does not constitute financial advice or any other recommendation of any sort offered or endorsed by Gate.