This comprehensive article analyzes RFD's market position as a meme token on the Ethereum blockchain, providing expert price forecasts and investment strategies for 2026-2031. It examines RFD's price history from its 2023 launch ($0.00004) through current levels ($0.000001389), current market sentiment in extreme fear territory, and tokenomics with concentrated holdings. The analysis identifies key price drivers including supply mechanisms, macroeconomic factors, and ecosystem development, projecting potential price changes from 0% in 2026 to 45% by 2031. The guide offers tailored investment strategies for different investor profiles on Gate.com, comprehensive risk management frameworks addressing volatility and liquidity concerns, and regulatory risks specific to meme tokens. Ideal for traders seeking actionable strategies and risk mitigation techniques for RFD trading and portfolio allocation.
Introduction: RFD's Market Position and Investment Value
Refund (RFD), as a meme token in the cryptocurrency market, has been active since its launch in 2023. As of 2026, RFD maintains a market capitalization of approximately $1.39 million, with a circulating supply of 1 trillion tokens, and the price hovering around $0.000001389. This digital asset, characterized by its community-driven nature, is finding its place within the broader meme token ecosystem.
This article will comprehensively analyze RFD's price trends from 2026 to 2031, combining historical patterns, market supply-demand dynamics, ecosystem developments, and macroeconomic factors to provide investors with professional price forecasts and practical investment strategies.
I. RFD Price History Review and Market Status
RFD Historical Price Evolution Trajectory
- 2023: Token launched in May with an initial price of $0.00004, reaching an all-time high of $0.0001436 on May 23, representing a significant price surge during its early trading period
- 2024: Market entered a prolonged correction phase, with price declining from previous highs to reach an all-time low of $0.0000005 on November 14
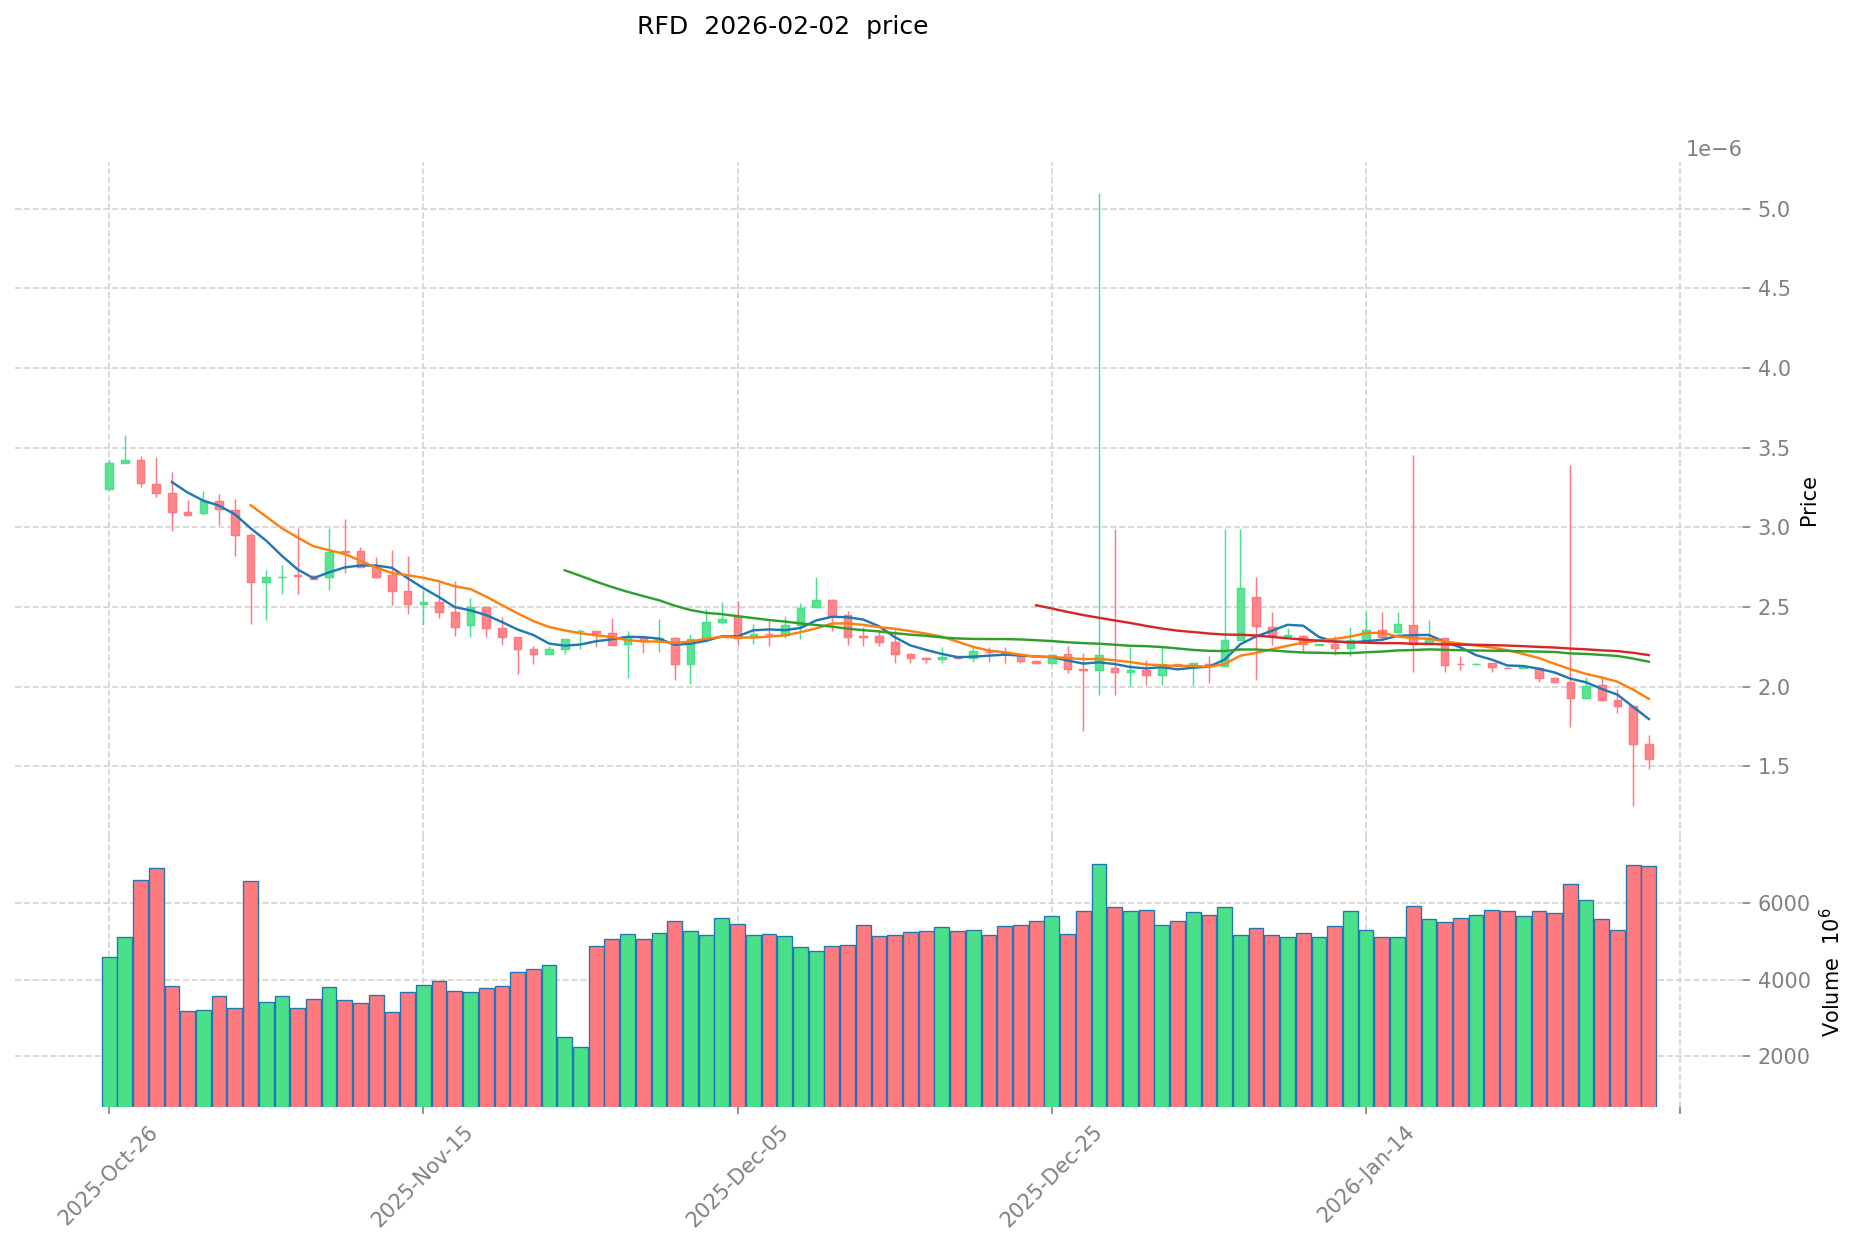
- 2025-2026: Price demonstrated volatile trading patterns with continued downward pressure, currently trading at $0.000001389 as of February 2, 2026
RFD Current Market Status
As of February 2, 2026, RFD is trading at $0.000001389, experiencing a decline of 15.4% over the past 24 hours. The token's 24-hour trading range fluctuated between $0.000000912 (low) and $0.000001801 (high), indicating considerable intraday volatility.
The token's recent performance shows negative momentum across multiple timeframes: down 0.29% in the past hour, 31.84% over the past week, and 32.21% over the past month. Year-over-year data reveals a substantial decline of 67.34% from previous levels.
RFD maintains a fully diluted market capitalization of $1,389,000, with a circulating supply of 1 trillion tokens representing 100% of the maximum supply. The token's 24-hour trading volume stands at approximately $11,901. Market dominance remains minimal at 0.000050%, and the market cap to fully diluted valuation ratio sits at 100%.
The token is deployed on the Ethereum blockchain with the contract address 0x955d5c14c8d4944da1ea7836bd44d54a8ec35ba1. RFD currently has approximately 6,999 token holders and is available for trading on Gate.com.
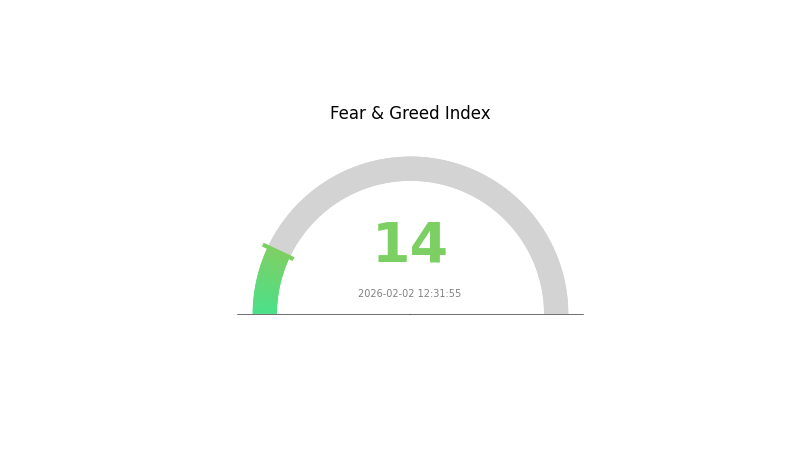
The broader market sentiment indicator shows a reading of 14, reflecting extreme fear conditions in the cryptocurrency market environment.
Click to view current RFD market price
RFD Market Sentiment Index
2026-02-02 Fear and Greed Index: 14 (Extreme Fear)
Click to view current Fear & Greed Index
Market Analysis:
The crypto market is currently in extreme fear territory with an index reading of 14. This exceptionally low sentiment indicates severe pessimism among investors, reflecting significant market uncertainty and risk aversion. Such extreme fear levels historically present potential buying opportunities for contrarian investors, as excessive pessimism often precedes market reversals. However, traders should exercise caution and conduct thorough analysis before entering positions. Monitor key support levels and macroeconomic factors closely during this volatile period on Gate.com.
RFD Holding Distribution
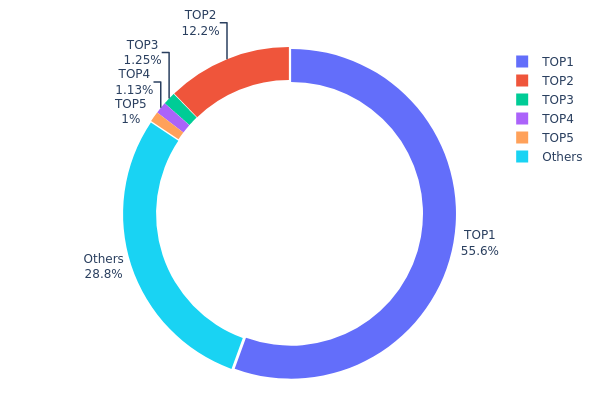
The holding distribution chart reveals the allocation of token holdings across different addresses, serving as a crucial indicator of decentralization and market structure. According to the latest on-chain data, the top address holds 555.61 billion RFD tokens, accounting for 55.56% of the total supply, while the second-ranked address (burn address 0x0000...00dead) holds 122.39 billion tokens at 12.23%. The top five addresses collectively control approximately 71.17% of the circulating supply, with the remaining 28.83% distributed among other holders.
This distribution pattern indicates a relatively high concentration of RFD holdings. The dominance of a single address controlling over half of the total supply suggests potential centralization risks that could impact market dynamics. The presence of a significant burn address demonstrates a deflationary mechanism, which may be part of the project's tokenomics design to reduce circulating supply over time. However, the concentrated nature of holdings in the top tier addresses could lead to increased price volatility if these major holders decide to adjust their positions.
From a market structure perspective, this level of concentration presents both opportunities and challenges. While concentrated holdings may provide stability during early development phases and demonstrate confidence from major stakeholders, they also create potential risks for smaller investors regarding price manipulation and liquidity concerns. The relatively modest 28.83% held by other addresses indicates limited decentralization at this stage, which may affect the project's long-term sustainability and community-driven governance capabilities.
Click to view current RFD Holding Distribution
| Top |
Address |
Holding Qty |
Holding (%) |
| 1 |
0x6c4c...4ef321 |
555610208.69K |
55.56% |
| 2 |
0x0000...00dead |
122389947.31K |
12.23% |
| 3 |
0x5887...caf605 |
12500000.00K |
1.25% |
| 4 |
0xded1...999d00 |
11334078.81K |
1.13% |
| 5 |
0xb97d...9e5c68 |
10000000.00K |
1.00% |
| - |
Others |
288165765.19K |
28.83% |
II. Core Factors Influencing RFD's Future Price
Supply Mechanism
- Market Demand Dynamics: RFD's supply characteristics are subject to market demand fluctuations, which directly influence pricing trajectories. Market participants' appetite for RFD reflects broader sentiment in the sector.
- Historical Patterns: Historical data suggests that supply chain disruptions and production cost variations have periodically affected RFD's availability and pricing structure. These patterns indicate sensitivity to operational constraints.
- Current Impact: Ongoing global economic trends continue to shape supply expectations, with regulatory developments potentially introducing new variables into the supply equation.
Institutional and Major Holder Dynamics
- Regulatory Framework: Regulatory changes at various jurisdictional levels play a significant role in shaping market conditions for RFD. Policy adjustments can alter institutional participation patterns and market accessibility.
- Market Psychology: Investment behavior, particularly among retail participants, demonstrates patterns of capital allocation that influence short-term price movements. The tendency to pursue undervalued opportunities creates natural momentum within market segments.
Macroeconomic Environment
- Monetary Policy Influence: Central bank policy decisions, including interest rate adjustments, create ripple effects across financial markets. Rate changes influence capital flows and risk appetite, which indirectly affect RFD's market positioning.
- Economic Competition Dynamics: The relationship between production costs and competitive positioning has evolved. Market analysis indicates a gradual shift from price-based competition toward quality and product differentiation in relevant sectors.
- Global Economic Trends: Broader economic developments, including income level changes in various markets, contribute to evolving demand patterns and competitive landscapes that influence RFD's market environment.
Technical Development and Ecosystem Building
- Capital Efficiency Optimization: Market participants increasingly focus on diversified allocation strategies rather than concentrated positions, which supports broader market participation and liquidity distribution.
- Future Development Prospects: The expansion potential remains tied to multiple variables including market maturity, regulatory clarity, and sustained economic growth in key regions. These factors collectively shape the trajectory for RFD's ecosystem development.
III. 2026-2031 RFD Price Forecast
Based on the available data, specific price predictions for RFD during the 2026-2031 period are not currently determinable. The reference materials indicate price change percentages ranging from 0% in 2026 to 45% by 2031, but without baseline price figures, concrete price ranges cannot be established.
2026 Outlook
The forecast data for 2026 shows a 0% price change projection, suggesting potential market stabilization or a period of price discovery for RFD. Without established price benchmarks in the reference materials, investors should approach this period with caution and conduct thorough due diligence.
2027-2029 Mid-Term Outlook
- Market Stage Expectation: The data suggests a gradual upward trajectory, with price change percentages increasing from 4% in 2027 to 33% by 2029
- Price Change Projections:
- 2027: 4% change anticipated
- 2028: 17% change anticipated
- 2029: 33% change anticipated
- Key Catalysts: The progressive increase in price change percentages may indicate growing market adoption, ecosystem development, or broader cryptocurrency market momentum during this period
2030-2031 Long-Term Outlook
- Baseline Scenario: 35% price change projected for 2030 (assuming continued market development and stable regulatory environment)
- Extended Scenario: 45% price change projected for 2031 (contingent upon sustained ecosystem growth and favorable market conditions)
As of 2026-02-02, RFD market data remains limited, and these projections should be interpreted as indicative trends rather than definitive price targets. Investors are advised to monitor project developments, market conditions, and conduct independent research before making investment decisions.
| Year |
Predicted High Price |
Predicted Average Price |
Predicted Low Price |
Price Change |
| 2026 |
0 |
0 |
0 |
0 |
| 2027 |
0 |
0 |
0 |
4 |
| 2028 |
0 |
0 |
0 |
17 |
| 2029 |
0 |
0 |
0 |
33 |
| 2030 |
0 |
0 |
0 |
35 |
| 2031 |
0 |
0 |
0 |
45 |
IV. RFD Professional Investment Strategy and Risk Management
RFD Investment Methodology
(I) Long-term Holding Strategy
- Target Investors: Speculative investors with high risk tolerance and interest in meme token culture
- Operational Recommendations:
- Limit RFD allocation to no more than 1-2% of total crypto portfolio given its meme token nature and high volatility
- Monitor social media sentiment and community activity as primary value drivers
- Store assets in Gate Web3 Wallet for secure and convenient management
(II) Active Trading Strategy
- Technical Analysis Tools:
- Volume Analysis: Given the 24-hour trading volume of $11,901, monitor volume spikes that may indicate community-driven price movements
- Support and Resistance Levels: Current 24-hour range shows high at $0.000001801 and low at $0.000000912, suggesting significant intraday volatility
- Swing Trading Points:
- Set strict stop-loss orders due to meme token volatility, with -15.4% decline in 24 hours demonstrating rapid price fluctuations
- Consider taking partial profits during community-driven rallies, as meme tokens typically experience quick reversals
RFD Risk Management Framework
(I) Asset Allocation Principles
- Conservative Investors: 0-0.5% of crypto portfolio
- Aggressive Investors: 0.5-2% of crypto portfolio
- Professional Investors: Up to 3% with active monitoring and tight risk controls
(II) Risk Hedging Solutions
- Portfolio Diversification: Balance RFD exposure with established cryptocurrencies and stablecoins
- Position Sizing: Use small incremental purchases rather than large one-time investments given price volatility
(III) Secure Storage Solutions
- Hot Wallet Recommendation: Gate Web3 Wallet for active trading and easy access
- Cold Storage Option: Consider hardware wallet solutions for larger holdings intended for long-term storage
- Security Precautions: Enable two-factor authentication, never share private keys, and verify contract address (0x955d5c14c8d4944da1ea7836bd44d54a8ec35ba1 on Ethereum) before transactions
V. RFD Potential Risks and Challenges
RFD Market Risks
- High Volatility: RFD has experienced -67.34% decline over the past year and -31.84% over the past week, indicating extreme price instability
- Limited Liquidity: With 24-hour trading volume of approximately $11,901, the token may face liquidity constraints during high-volatility periods
- Meme Token Dependency: Value primarily driven by social media trends and community sentiment rather than fundamental utility, making price movements unpredictable
RFD Regulatory Risks
- Meme Token Classification: Regulatory authorities may introduce stricter oversight on meme tokens and speculative digital assets
- Trading Restrictions: Potential limitations on promotional activities or trading access in certain jurisdictions
- Compliance Requirements: Evolving regulatory frameworks may impact token accessibility and exchange listings
RFD Technical Risks
- Smart Contract Vulnerabilities: As an ERC-20 token on Ethereum, exposure to potential smart contract exploits or bugs
- Network Congestion: Ethereum network congestion may result in high transaction fees during periods of increased activity
- Limited Technical Development: As a meme token, RFD may lack ongoing technical improvements or protocol upgrades compared to utility-focused projects
VI. Conclusion and Action Recommendations
RFD Investment Value Assessment
RFD represents a highly speculative meme token with significant short-term risks. The token has experienced substantial price decline of -67.34% over the past year and currently trades well below its all-time high of $0.0001436. With a fully circulating supply of 1 trillion tokens and limited utility beyond meme culture, RFD's value proposition depends heavily on community engagement and social media momentum. The low market cap of approximately $1.39 million and minimal trading volume suggest limited market depth. While short-term trading opportunities may exist during community-driven rallies, long-term value appreciation remains highly uncertain.
RFD Investment Recommendations
✅ Beginners: Avoid or allocate minimal funds (less than 0.5% of portfolio) only if interested in experiencing meme token dynamics; focus learning efforts on understanding blockchain fundamentals and established projects
✅ Experienced Investors: Consider small speculative position (0.5-1% of portfolio) with strict risk controls, active monitoring of community sentiment, and predetermined exit strategies
✅ Institutional Investors: Generally not recommended due to high volatility, limited liquidity, lack of fundamental utility, and regulatory uncertainties surrounding meme tokens
RFD Trading Participation Methods
- Spot Trading: Purchase RFD through Gate.com spot markets with appropriate position sizing and stop-loss orders
- Dollar-Cost Averaging: Implement small, regular purchases to mitigate timing risk if taking long-term speculative position
- Active Monitoring: Track social media channels and community activity as primary indicators of potential price movements
Cryptocurrency investments carry extremely high risks, and this article does not constitute investment advice. Investors should make cautious decisions based on their own risk tolerance and are advised to consult professional financial advisors. Never invest more than you can afford to lose.
FAQ
What is RFD? What are its fundamentals and use cases?
RFD is a Web3 utility token designed for decentralized file storage and transfer protocols. Its fundamentals focus on enabling secure, efficient data distribution across blockchain networks. Use cases include incentivizing network nodes, governance participation, and accessing premium storage features within the RFD ecosystem.
What are the main factors affecting RFD price?
RFD price is primarily influenced by market supply and demand dynamics, community engagement level, and overall market sentiment. High community participation and increased demand typically drive price appreciation, while market volatility and liquidity conditions also play significant roles in price movements.
How to predict RFD price? What are the analysis methods?
RFD price prediction relies on historical transaction data and market trend analysis. Common methods include moving averages and RSI (Relative Strength Index) to identify price trends and potential trading signals based on transaction volume and market sentiment.
RFD has demonstrated significant price volatility influenced by macroeconomic factors and market supply-demand dynamics. Price fluctuations typically follow cyclical patterns correlated with broader market trends and adoption cycles in the crypto ecosystem.
What risks should I be aware of when investing in RFD for price prediction?
RFD price prediction involves market volatility, economic fluctuations, and fundamental changes. Investors should conduct thorough research on macroeconomic trends and industry developments. Choose assets with strong fundamentals and growth potential to manage risk effectively.
* The information is not intended to be and does not constitute financial advice or any other recommendation of any sort offered or endorsed by Gate.