ALMANAK vs MANA: A Comprehensive Comparison of Two Blockchain Gaming Governance Tokens


Introduction: Investment Comparison Between ALMANAK and MANA
In the cryptocurrency market, the comparison between ALMANAK vs MANA has become a topic of interest for investors. The two projects differ significantly in market capitalization ranking, application scenarios, and price performance, representing distinct crypto asset positioning.
ALMANAK (ALMANAK): Launched in 2025, this project has gained market recognition by enabling users to build, optimize, and manage sophisticated quantitative financial strategies through AI-powered multi-agent systems in a no-code environment. Backed by notable investors including Delphi Labs, BanklessVC, and Hashkey, ALMANAK aims to democratize hedge-fund-level trading capabilities.
Decentraland (MANA): Since its launch in 2017, MANA has been positioned as a virtual world platform utilizing blockchain technology for virtual property rights management. The project addresses the intermediary profit issues in decentralized open-source projects, establishing a direct payment model between content creators and users.
This article will provide a comprehensive analysis of ALMANAK vs MANA investment value comparison, covering aspects including historical price trends, supply mechanisms, institutional adoption, technological ecosystems, and future projections, attempting to address investors' most pressing question:
"Which is the better buy right now?"
I. Historical Price Comparison and Current Market Status
ALMANAK (Coin A) and MANA (Coin B) Historical Price Trends
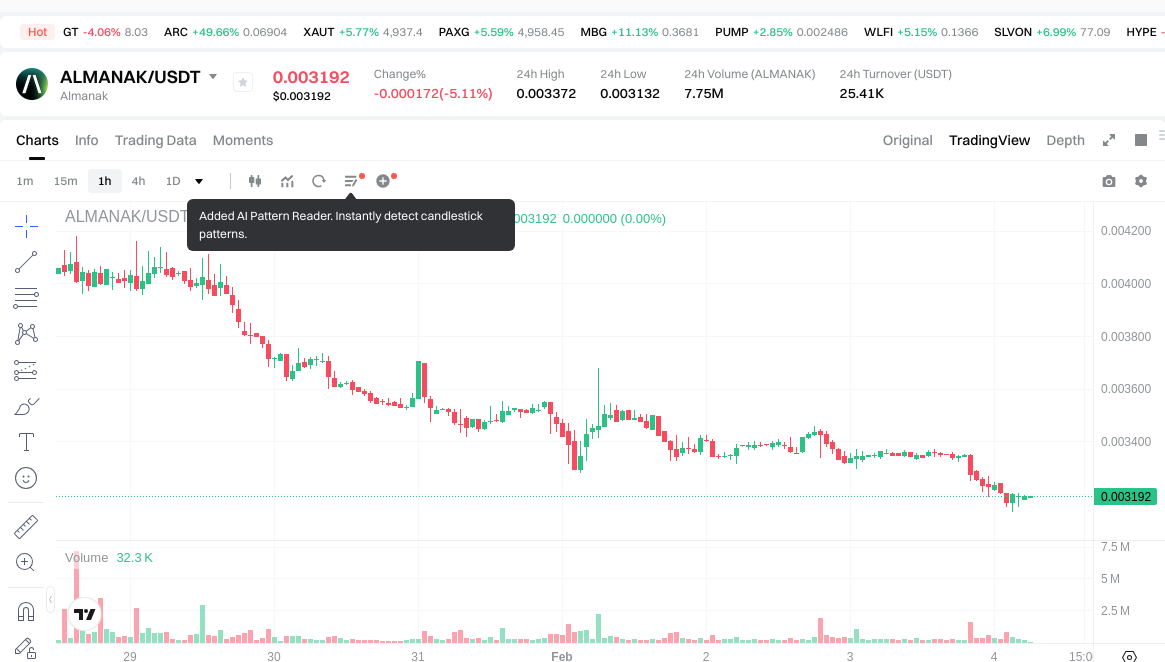
- 2025: ALMANAK experienced significant price volatility following its launch in September 2025, with the token reaching $0.19366 in December 2025.
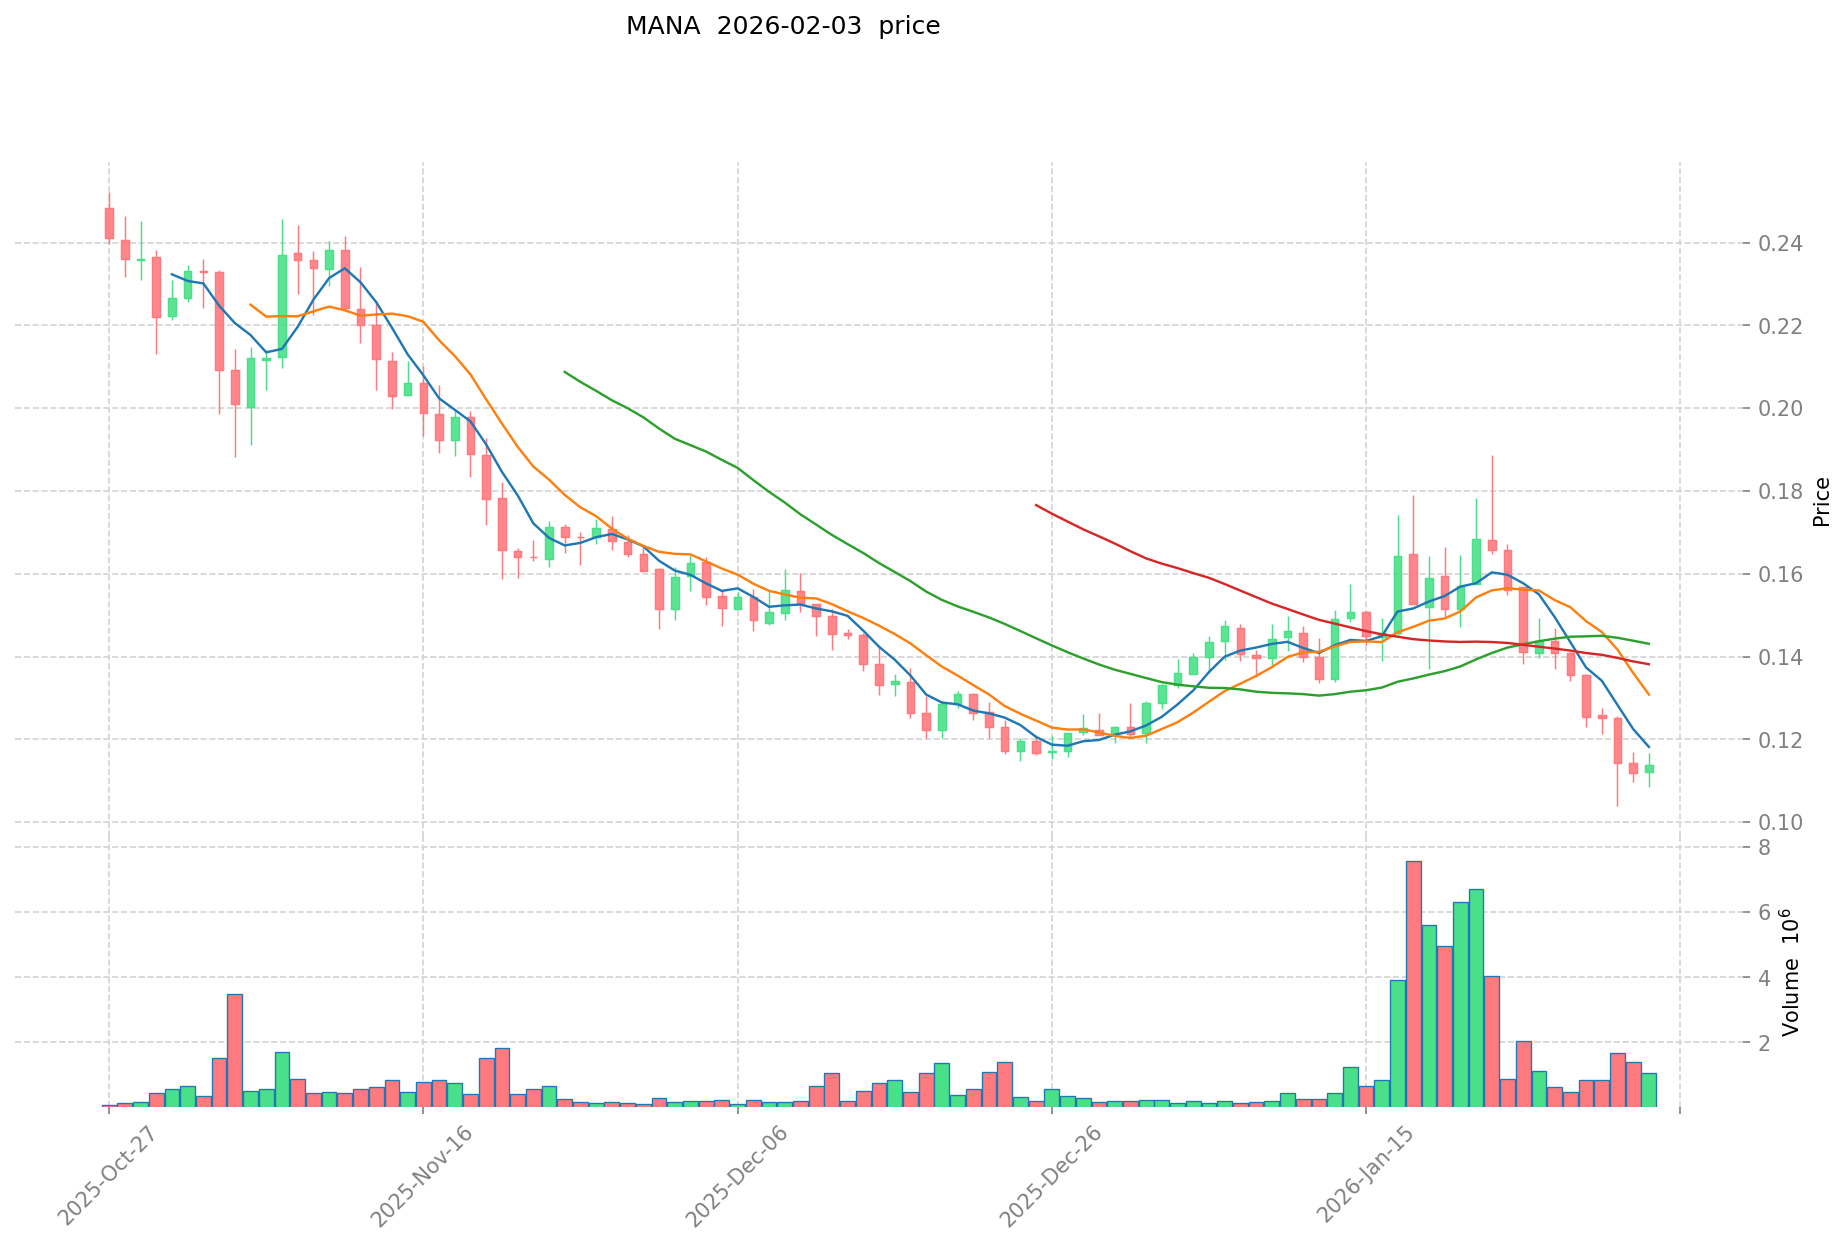
- 2021: MANA was influenced by metaverse development momentum, with price reaching $5.85 in November 2021.
- Comparative analysis: During the recent market cycle, ALMANAK declined from $0.19366 to $0.003132, while MANA showed a different trajectory, declining from $5.85 to current levels around $0.11.
Current Market Status (2026-02-04)
- ALMANAK current price: $0.003187
- MANA current price: $0.1132
- 24-hour trading volume: ALMANAK $25,494.27 vs MANA $124,824.64
- Market sentiment index (Fear & Greed Index): 17 (Extreme Fear)
View real-time prices:
- Check ALMANAK current price Market Price
- Check MANA current price Market Price
II. Core Factors Influencing ALMANAK vs MANA Investment Value
Supply Mechanism Comparison (Tokenomics)
- ALMANAK: Information regarding the supply mechanism is not available in the provided materials.
- MANA: Information regarding the supply mechanism is not available in the provided materials.
- 📌 Historical Pattern: Supply mechanisms can influence price cycles through scarcity dynamics and emission schedules, though specific historical data for these assets is not available.
Institutional Adoption and Market Application
- Institutional Holdings: Data on institutional preference between these assets is not available in the provided materials.
- Enterprise Adoption: Information on cross-border payment, settlement, or portfolio applications for ALMANAK and MANA is not available.
- National Policies: Regulatory attitudes toward these assets in different jurisdictions are not documented in the provided materials.
Technical Development and Ecosystem Building
- ALMANAK Technical Upgrades: Specific technical development information is not available in the provided materials.
- MANA Technical Development: Specific technical development information is not available in the provided materials.
- Ecosystem Comparison: Information on DeFi, NFT, payment systems, and smart contract implementations for these assets is not available.
Macroeconomic Environment and Market Cycles
- Performance in Inflationary Environments: Comparative anti-inflation characteristics are not documented in the provided materials.
- Macroeconomic Monetary Policy: Specific impacts of interest rates and dollar index movements on these assets are not available.
- Geopolitical Factors: Information on cross-border transaction demand and international situation impacts is not available in the provided materials.
III. 2026-2031 Price Forecast: ALMANAK vs MANA
Short-term Forecast (2026)
- ALMANAK: Conservative $0.00220248 - $0.003192 | Optimistic $0.003192 - $0.00466032
- MANA: Conservative $0.105656 - $0.1124 | Optimistic $0.1124 - $0.147244
Medium-term Forecast (2028-2029)
- ALMANAK may enter a gradual growth phase, with estimated price range of $0.003283840224 - $0.00656848138464
- MANA may enter a moderate expansion phase, with estimated price range of $0.1133281149 - $0.204507038736
- Key drivers: institutional capital inflows, ETF developments, ecosystem expansion
Long-term Forecast (2030-2031)
- ALMANAK: Base scenario $0.003670552457208 - $0.00564700378032 | Optimistic scenario $0.004502356114049 - $0.007792865216841
- MANA: Base scenario $0.134788730076 - $0.179718306768 | Optimistic scenario $0.173230475893675 - $0.24801126333984
Disclaimer: Price predictions are based on historical data analysis and market trends. Actual prices may vary significantly due to market volatility, regulatory changes, technological developments, and macroeconomic factors. This information does not constitute investment advice.
ALMANAK:
| Year | Predicted High Price | Predicted Average Price | Predicted Low Price | Price Change |
|---|---|---|---|---|
| 2026 | 0.00466032 | 0.003192 | 0.00220248 | 0 |
| 2027 | 0.0040832064 | 0.00392616 | 0.00294462 | 23 |
| 2028 | 0.005446369152 | 0.0040046832 | 0.003283840224 | 25 |
| 2029 | 0.00656848138464 | 0.004725526176 | 0.00387493146432 | 48 |
| 2030 | 0.007792865216841 | 0.00564700378032 | 0.003670552457208 | 76 |
| 2031 | 0.007459127293424 | 0.00671993449858 | 0.004502356114049 | 110 |
MANA:
| Year | Predicted High Price | Predicted Average Price | Predicted Low Price | Price Change |
|---|---|---|---|---|
| 2026 | 0.147244 | 0.1124 | 0.105656 | 0 |
| 2027 | 0.15708462 | 0.129822 | 0.07270032 | 14 |
| 2028 | 0.1664058396 | 0.14345331 | 0.1133281149 | 26 |
| 2029 | 0.204507038736 | 0.1549295748 | 0.117746476848 | 36 |
| 2030 | 0.24801126333984 | 0.179718306768 | 0.134788730076 | 58 |
| 2031 | 0.226696672157155 | 0.21386478505392 | 0.173230475893675 | 88 |
IV. Investment Strategy Comparison: ALMANAK vs MANA
Long-term vs Short-term Investment Strategies
- ALMANAK: May be suitable for investors interested in emerging AI-powered quantitative trading solutions and early-stage technological innovation with higher risk tolerance
- MANA: May be suitable for investors seeking exposure to established metaverse and virtual property concepts with longer market history
Risk Management and Asset Allocation
- Conservative investors: ALMANAK 20% vs MANA 80%
- Aggressive investors: ALMANAK 60% vs MANA 40%
- Hedging tools: Stablecoin allocation, options strategies, cross-asset portfolio diversification
V. Potential Risk Comparison
Market Risk
- ALMANAK: Higher volatility risk due to recent launch in September 2025, limited price history, and significant price decline from $0.19366 to current levels around $0.003187
- MANA: Price volatility related to metaverse sector sentiment shifts, with historical decline from peak of $5.85 in November 2021 to current levels around $0.1132
Technical Risk
- ALMANAK: Platform scalability challenges, no-code system stability considerations, and multi-agent system operational reliability
- MANA: Network performance under high virtual world activity, platform infrastructure maintenance requirements
Regulatory Risk
- Global regulatory developments may affect both assets differently, with AI-focused financial tools and virtual property platforms facing distinct compliance considerations across jurisdictions
VI. Conclusion: Which Is the Better Buy?
📌 Investment Value Summary:
- ALMANAK advantages: Backed by notable investors including Delphi Labs, BanklessVC, and Hashkey; addresses democratization of quantitative trading strategies; represents emerging AI-powered financial technology sector
- MANA advantages: Established market presence since 2017; longer price history providing more data points for analysis; established positioning in virtual world and blockchain-based property rights space
✅ Investment Recommendations:
- Beginner investors: Consider starting with smaller position sizes in either asset, prioritize understanding the fundamental technology and use cases, and maintain diversified portfolios with established assets
- Experienced investors: May evaluate portfolio allocation based on risk tolerance, market cycle assessment, and conviction in respective technology sectors; consider dollar-cost averaging strategies
- Institutional investors: Conduct thorough due diligence on governance structures, liquidity profiles, custody solutions, and regulatory compliance frameworks for both assets
⚠️ Risk Warning: The cryptocurrency market exhibits high volatility. This article does not constitute investment advice.
VII. FAQ
Q1: What are the main differences between ALMANAK and MANA in terms of project focus?
ALMANAK focuses on AI-powered quantitative trading tools while MANA centers on virtual world property rights. ALMANAK, launched in September 2025, enables users to build and manage sophisticated quantitative financial strategies through AI-powered multi-agent systems in a no-code environment, backed by investors including Delphi Labs, BanklessVC, and Hashkey. In contrast, MANA has been operating since 2017 as a virtual world platform utilizing blockchain technology for virtual property rights management, establishing direct payment models between content creators and users in the metaverse ecosystem.
Q2: Which asset shows higher price volatility based on historical data?
ALMANAK exhibits significantly higher price volatility compared to MANA. ALMANAK experienced a dramatic decline from $0.19366 in December 2025 to the current price of $0.003187, representing approximately a 98% drop within a short timeframe. While MANA also declined substantially from its November 2021 peak of $5.85 to current levels around $0.1132 (approximately 98% decline), this occurred over a longer period from 2021 to 2026, indicating more gradual price movement compared to ALMANAK's recent sharp decline.
Q3: What is the current market sentiment for these cryptocurrencies?
The current market sentiment is Extreme Fear with a Fear & Greed Index of 17 as of February 4, 2026. This negative sentiment affects both ALMANAK and MANA, as reflected in their 24-hour trading volumes of $25,494.27 and $124,824.64 respectively. The extreme fear level suggests investors are highly cautious, which typically indicates potential oversold conditions but also reflects genuine market concerns about cryptocurrency valuations and broader macroeconomic uncertainties.
Q4: What is the price forecast outlook for ALMANAK and MANA through 2031?
Both assets show potential for growth through 2031, though with different trajectories. ALMANAK's conservative forecast ranges from $0.00220248 in 2026 to $0.004502356114049 by 2031, while optimistic scenarios project up to $0.007792865216841. MANA's conservative forecast ranges from $0.105656 in 2026 to $0.173230475893675 by 2031, with optimistic scenarios reaching $0.24801126333984. However, these predictions are based on historical data analysis and may vary significantly due to market volatility, regulatory changes, technological developments, and macroeconomic factors.
Q5: What are the key risk factors investors should consider for each asset?
ALMANAK carries higher early-stage risks including limited price history since its September 2025 launch, platform scalability challenges with its no-code multi-agent system, and significant recent price decline indicating potential market validation concerns. MANA faces risks related to metaverse sector sentiment volatility, network performance under high virtual world activity, and longer-term sustainability of virtual property demand. Both assets face regulatory uncertainties as AI-focused financial tools and virtual property platforms encounter distinct compliance considerations across different jurisdictions.
Q6: How should different investor types approach allocation between ALMANAK and MANA?
Conservative investors are suggested to consider an allocation of 20% ALMANAK and 80% MANA, favoring the more established asset with longer market history. Aggressive investors may consider 60% ALMANAK and 40% MANA to capture potential higher returns from the emerging AI quantitative trading sector. Beginner investors should start with smaller position sizes in either asset, prioritize understanding fundamental technology and use cases, and maintain diversified portfolios. Experienced and institutional investors should conduct thorough due diligence on governance structures, liquidity profiles, custody solutions, and regulatory compliance frameworks before making allocation decisions.
Q7: What institutional backing exists for these projects?
ALMANAK benefits from backing by notable investors including Delphi Labs, BanklessVC, and Hashkey, providing credibility and potential resources for development and market expansion. This institutional support signals confidence in ALMANAK's vision to democratize hedge-fund-level trading capabilities through AI technology. Information regarding specific institutional backing or partnerships for MANA is not detailed in the provided materials, though its longer operational history since 2017 suggests it has established relationships within the blockchain and metaverse ecosystem over time.
Q8: What hedging strategies can investors employ when holding these assets?
Investors can implement several hedging strategies including stablecoin allocation to maintain liquidity and reduce portfolio volatility, options strategies such as protective puts or covered calls if available for these assets, and cross-asset portfolio diversification by combining ALMANAK and MANA with established cryptocurrencies, traditional assets, or inverse correlation instruments. Dollar-cost averaging is particularly recommended for both assets given their volatility profiles, allowing investors to mitigate timing risk and accumulate positions at various price points over extended periods.
Share
Content
Introduction: Investment Comparison Between ALMANAK and MANA
I. Historical Price Comparison and Current Market Status
II. Core Factors Influencing ALMANAK vs MANA Investment Value
III. 2026-2031 Price Forecast: ALMANAK vs MANA
IV. Investment Strategy Comparison: ALMANAK vs MANA
V. Potential Risk Comparison
VI. Conclusion: Which Is the Better Buy?
VII. FAQ
How to Buy Cryptocurrency


Trending Cryptocurrencies


Survey Note: Detailed Analysis of the Best AI in 2025
What Is the Best AI Crypto in 2025?

What is the Best AI Now?

Why ChatGPT is Likely the Best AI Now?

How Does Solidus Ai Tech's Market Cap Compare to Other AI Cryptocurrencies?

MomoAI: AI-Powered Social Gaming Revolution on Solana

Is MultiVAC (MTV) a good investment?: Comprehensive Analysis of Price Potential, Technology, and Market Prospects in 2024

Is LIORA (LIORA) a good investment?: A Comprehensive Analysis of Price, Technology, and Market Potential in 2024
Is Hyperbot (BOT) a good investment?: A Comprehensive Analysis of Price, Tokenomics, and Future Potential

LIORA vs STX: A Comprehensive Comparison of Two Leading Enterprise Solutions

BOT vs LINK: Which Blockchain Oracle Solution Offers Better Performance and Reliability for Smart Contracts?