CREDI vs GRT: A Comprehensive Comparison of Two Leading Blockchain Governance Tokens
Introduction: Investment Comparison Between CREDI and GRT
In the cryptocurrency market, the comparison between CREDI vs GRT continues to be a topic of interest for investors. The two projects differ notably in market cap ranking, application scenarios, and price performance, representing distinct positioning within the crypto asset landscape.
CREDI (Credefi): Launched in 2021, this alternative lending FinTech solution has positioned itself as a bridge connecting crypto lenders with SME borrowers from the real economy, offering loans backed by real-world assets including real estate and future receivables.
GRT (The Graph): Since its launch in 2020, The Graph has been recognized as a decentralized protocol for indexing and querying blockchain data, primarily serving the Ethereum ecosystem and making data queries more accessible through open APIs.
This article will examine historical price trends, supply mechanisms, institutional adoption, technical ecosystems, and future projections to provide a comprehensive analysis of CREDI vs GRT investment value comparison, attempting to address the question investors frequently ask:
"Which is the better buy right now?"
I. Historical Price Comparison and Current Market Status
Historical Price Trends of CREDI (Coin A) and GRT (Coin B)
- 2021: GRT reached its historical high price of $2.84 on May 22, 2024, driven by strong adoption in the decentralized indexing protocol sector.
- 2024: CREDI recorded its peak price of $0.03456 on May 22, 2024, reflecting initial market interest in alternative lending solutions connecting crypto lenders with SME borrowers.
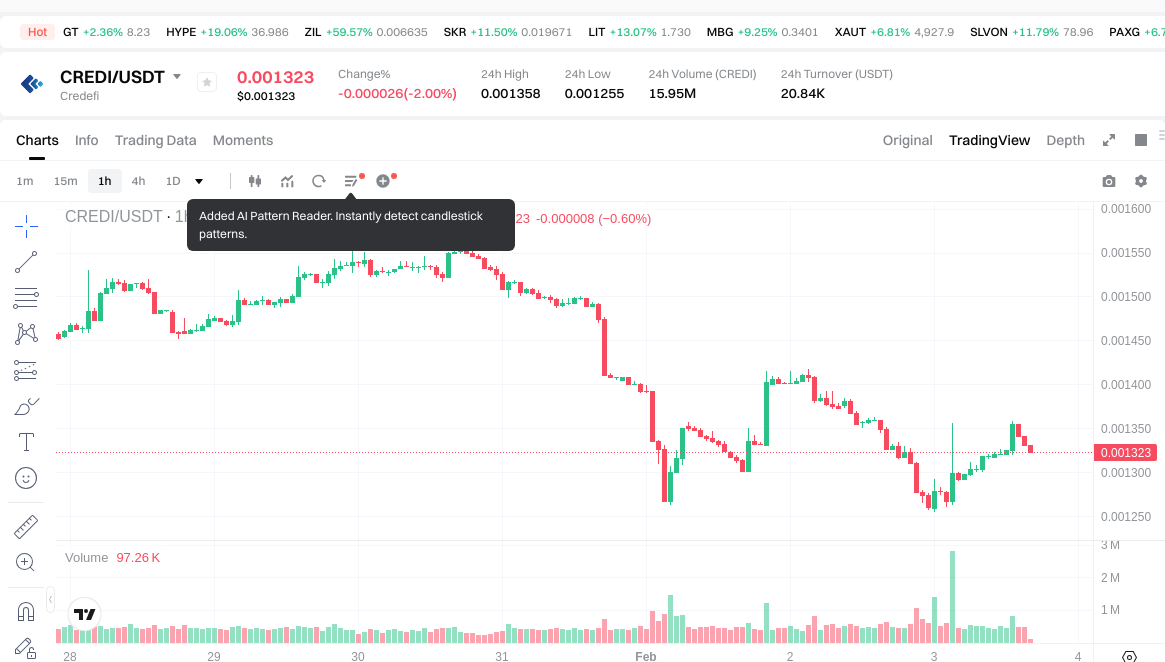
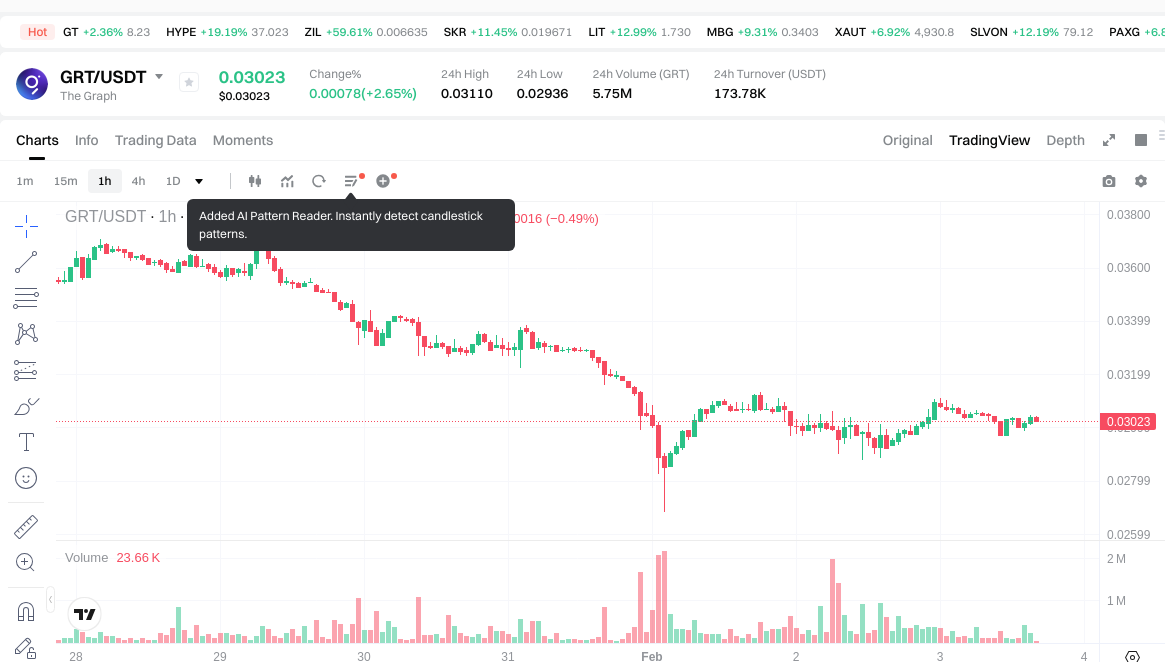
- Comparative analysis: During the recent market cycle, CREDI declined from its high of $0.03456 to a low of $0.001255 recorded on February 2, 2026, representing a substantial decrease. In contrast, GRT dropped from its high of $2.84 to a low of $0.02834245 on February 1, 2026, showing a similar downward trend but from a significantly higher price base.
Current Market Status (February 3, 2026)
- CREDI current price: $0.00133
- GRT current price: $0.03035
- 24-hour trading volume: CREDI $20,868.61 vs GRT $174,727.03
- Market Sentiment Index (Fear & Greed Index): 17 (Extreme Fear)
View real-time prices:
- Check CREDI current price Market Price
- Check GRT current price Market Price
II. Core Factors Influencing CREDI vs GRT Investment Value
Supply Mechanism Comparison (Tokenomics)
- CREDI: The supply mechanism details for CREDI were not available in the provided materials. Tokenomics structure remains unspecified in current documentation.
- GRT: Supply mechanism specifications for GRT were not provided in the reference materials. Distribution model and token economics require further research.
- 📌 Historical Pattern: Supply mechanisms typically influence price cycles through scarcity dynamics and emission schedules, though specific correlations for these assets require additional data analysis.
Institutional Adoption and Market Application
- Institutional Holdings: Current institutional preference data between CREDI and GRT was not available in the provided materials.
- Enterprise Adoption: Comparative analysis of CREDI and GRT applications in cross-border payments, settlements, and investment portfolios could not be completed based on available documentation.
- National Policies: Regulatory attitudes toward these specific assets across different jurisdictions were not covered in the reference materials.
Technical Development and Ecosystem Construction
- CREDI Technical Upgrades: Specific technical development roadmap and upgrade details were not provided in the source materials.
- GRT Technical Development: Technical advancement information and future development plans were not available in the provided documentation.
- Ecosystem Comparison: Comparative analysis of DeFi integration, NFT applications, payment implementations, and smart contract deployment for both assets requires additional research beyond the provided materials.
Macroeconomic Environment and Market Cycles
- Performance Under Inflation: Reference materials emphasized the importance of risk assessment and asset allocation strategies. Investment portfolios should consider systematic risks including market volatility, interest rate fluctuations, and inflation impacts. However, specific inflation-hedging characteristics comparison between CREDI and GRT was not documented.
- Macroeconomic Monetary Policy: Documentation highlighted that interest rate movements and currency dynamics affect investment valuations. The materials noted that market risk factors, including interest rate risk and currency risk, can significantly impact asset prices through various transmission mechanisms, though specific effects on CREDI and GRT were not detailed.
- Geopolitical Factors: The provided materials referenced political risk and country risk as relevant considerations for investment decisions. Geopolitical uncertainties, policy changes, and international dynamics can influence cross-border transaction demand, though specific implications for CREDI and GRT were not analyzed in the available documentation.
III. 2026-2031 Price Prediction: CREDI vs GRT
Short-term Forecast (2026)
- CREDI: Conservative $0.00083349 - $0.001323 | Optimistic $0.001323 - $0.00166698
- GRT: Conservative $0.0251324 - $0.03028 | Optimistic $0.03028 - $0.033308
Mid-term Forecast (2028-2029)
- CREDI may enter a gradual growth phase, with estimated price range of $0.00159515433 - $0.0025760920185
- GRT may enter a moderate expansion phase, with estimated price range of $0.0265241445 - $0.048905292345
- Key drivers: institutional capital inflows, ETF developments, ecosystem expansion
Long-term Forecast (2030-2031)
- CREDI: Baseline scenario $0.001800291999082 - $0.00227885063175 | Optimistic scenario $0.002518129948083 - $0.002757409264417
- GRT: Baseline scenario $0.030888767193375 - $0.050134845213862 | Optimistic scenario $0.050134845213862 - $0.064172601873744
Disclaimer
CREDI:
| Year | Predicted High Price | Predicted Average Price | Predicted Low Price | Price Change |
|---|---|---|---|---|
| 2026 | 0.00166698 | 0.001323 | 0.00083349 | 0 |
| 2027 | 0.001793988 | 0.00149499 | 0.001195992 | 12 |
| 2028 | 0.00231872949 | 0.001644489 | 0.00159515433 | 23 |
| 2029 | 0.0025760920185 | 0.001981609245 | 0.00192216096765 | 48 |
| 2030 | 0.002757409264417 | 0.00227885063175 | 0.001800291999082 | 71 |
| 2031 | 0.002618855146007 | 0.002518129948083 | 0.001913778760543 | 89 |
GRT:
| Year | Predicted High Price | Predicted Average Price | Predicted Low Price | Price Change |
|---|---|---|---|---|
| 2026 | 0.033308 | 0.03028 | 0.0251324 | 0 |
| 2027 | 0.0429219 | 0.031794 | 0.03084018 | 4 |
| 2028 | 0.0549161865 | 0.03735795 | 0.0265241445 | 23 |
| 2029 | 0.048905292345 | 0.04613706825 | 0.04244610279 | 52 |
| 2030 | 0.052748510130225 | 0.0475211802975 | 0.030888767193375 | 56 |
| 2031 | 0.064172601873744 | 0.050134845213862 | 0.046625406048892 | 65 |
IV. Investment Strategy Comparison: CREDI vs GRT
Long-term vs Short-term Investment Strategies
-
CREDI: May appeal to investors interested in alternative lending solutions and real-world asset-backed crypto models. The project's focus on connecting crypto lenders with SME borrowers suggests potential for investors seeking exposure to DeFi-traditional finance bridge applications.
-
GRT: May suit investors focused on blockchain infrastructure and data indexing protocols. As a decentralized indexing solution primarily serving the Ethereum ecosystem, it could attract those interested in Web3 foundational technology development.
Risk Management and Asset Allocation
-
Conservative Investors: Suggested allocation could consider CREDI 20-30% vs GRT 70-80%, given GRT's relatively established position in blockchain infrastructure compared to CREDI's emerging alternative lending model.
-
Aggressive Investors: Potential allocation might include CREDI 40-50% vs GRT 50-60%, allowing higher exposure to CREDI's growth potential while maintaining balanced risk through GRT's infrastructure positioning.
-
Hedging Tools: Portfolio diversification through stablecoin reserves, options strategies for downside protection, and cross-asset correlation analysis between different cryptocurrency segments.
V. Potential Risk Comparison
Market Risk
-
CREDI: Lower liquidity as evidenced by 24-hour trading volume of $20,868.61 may result in higher price volatility and slippage during entry or exit positions. The substantial decline from $0.03456 to $0.001255 indicates sensitivity to market sentiment shifts.
-
GRT: While showing higher trading volume at $174,727.03, the asset experienced significant drawdown from $2.84 to $0.02834245, demonstrating exposure to broader cryptocurrency market cycles and sentiment changes reflected in the current Extreme Fear index reading of 17.
Technical Risk
-
CREDI: Limited technical development information available in current documentation creates uncertainty regarding protocol upgrades, scalability solutions, and network maintenance plans.
-
GRT: As a blockchain indexing protocol, technical risks may include dependency on underlying blockchain networks, data accuracy maintenance, and competition from alternative indexing solutions.
Regulatory Risk
- Global regulatory developments may impact both assets differently based on their functional characteristics. CREDI's lending model connecting crypto assets with traditional SME financing could face scrutiny under securities regulations and financial lending frameworks. GRT's infrastructure positioning as a data indexing protocol may encounter regulations related to data privacy, blockchain service provision, and decentralized network operations across different jurisdictions.
VI. Conclusion: Which Is the Better Buy?
📌 Investment Value Summary:
-
CREDI Advantages: Represents exposure to the intersection of decentralized finance and real-world asset lending, offering potential upside through alternative financing model adoption. The project addresses SME capital access challenges through crypto-backed solutions.
-
GRT Advantages: Positioned as blockchain infrastructure through decentralized data indexing services, potentially benefiting from broader Web3 ecosystem expansion. Established presence since 2020 provides operational track record in the decentralized protocol sector.
✅ Investment Recommendations:
-
Novice Investors: Consider starting with smaller position sizes while conducting thorough research on both projects' fundamental value propositions. Focus on understanding risk tolerance and avoid concentration in single assets given current market conditions showing Extreme Fear sentiment.
-
Experienced Investors: May evaluate portfolio allocation based on thesis alignment with either alternative lending (CREDI) or blockchain infrastructure (GRT) sectors. Consider implementing risk management through position sizing, stop-loss strategies, and regular rebalancing based on market developments.
-
Institutional Investors: Could assess both assets within broader cryptocurrency portfolio context, considering liquidity requirements, regulatory compliance frameworks, and correlation patterns with traditional asset classes. Due diligence on governance structures, token economics, and long-term sustainability remains essential.
⚠️ Risk Warning: The cryptocurrency market exhibits high volatility characteristics. This analysis does not constitute investment advice. Investors should conduct independent research, assess personal risk tolerance, and consult qualified financial advisors before making investment decisions. Past performance does not guarantee future results.
VII. FAQ
Q1: What are the fundamental differences between CREDI and GRT in terms of use cases?
CREDI focuses on alternative lending solutions connecting crypto lenders with SME borrowers through real-world asset backing, while GRT operates as a decentralized blockchain data indexing protocol. CREDI bridges decentralized finance with traditional SME financing needs, offering loans backed by real estate and future receivables since its 2021 launch. In contrast, GRT has served as blockchain infrastructure since 2020, providing data indexing and querying services primarily for the Ethereum ecosystem through open APIs. These distinct applications position CREDI in the DeFi lending sector and GRT in the Web3 infrastructure layer.
Q2: Which asset shows better liquidity based on current market data?
GRT demonstrates significantly higher liquidity with 24-hour trading volume of $174,727.03 compared to CREDI's $20,868.61 as of February 3, 2026. This substantial volume difference indicates GRT offers better market depth for entering and exiting positions with potentially lower slippage. CREDI's lower trading volume suggests reduced liquidity, which may result in higher price volatility and execution challenges, particularly for larger transaction sizes. Investors should consider these liquidity dynamics when planning position sizing and exit strategies.
Q3: How have the historical price performances compared since their respective launches?
Both assets have experienced significant drawdowns from their historical peaks. GRT reached its all-time high of $2.84 on May 22, 2024, before declining to $0.02834245 by February 1, 2026, representing approximately a 99% decline. CREDI peaked at $0.03456 on May 22, 2024, and dropped to $0.001255 by February 2, 2026, also reflecting a substantial decrease of approximately 96%. Despite launching at different times (GRT in 2020, CREDI in 2021), both assets have followed similar downward trajectories during the recent market cycle, though from notably different price bases.
Q4: What are the key risks specific to each asset?
CREDI faces risks related to its alternative lending model, including potential regulatory scrutiny under securities and financial lending frameworks, limited technical documentation regarding protocol upgrades, and low liquidity contributing to higher volatility. GRT encounters technical risks from dependency on underlying blockchain networks, competition from alternative indexing solutions, and regulatory uncertainties surrounding data privacy and decentralized service provision. Both assets are exposed to broader cryptocurrency market cycles, as evidenced by the current Extreme Fear sentiment index reading of 17.
Q5: What allocation strategies might different investor profiles consider?
Conservative investors might consider a 20-30% CREDI and 70-80% GRT allocation, favoring GRT's more established blockchain infrastructure positioning over CREDI's emerging lending model. Aggressive investors could potentially allocate 40-50% to CREDI and 50-60% to GRT, accepting higher exposure to CREDI's growth potential while maintaining balance through GRT's infrastructure role. All investors should implement risk management through position sizing appropriate to their risk tolerance, stablecoin reserves for portfolio stability, and regular rebalancing based on market developments and personal financial circumstances.
Q6: What does the 2026-2031 price forecast suggest about growth potential?
The forecasts suggest different growth trajectories for both assets. CREDI's conservative estimate ranges from $0.00083349 in 2026 to $0.001800291999082 by 2030, representing potential gradual appreciation. GRT's conservative forecast projects $0.0251324 in 2026 to $0.030888767193375 by 2030, indicating moderate expansion potential. The optimistic scenarios show CREDI reaching $0.002757409264417 and GRT achieving $0.064172601873744 by 2030. However, these projections depend on numerous variables including institutional adoption, ecosystem development, and macroeconomic conditions, and should not be interpreted as guaranteed outcomes.
Q7: Should novice investors prioritize CREDI or GRT?
Novice investors should approach both assets cautiously with smaller position sizes while conducting thorough fundamental research. Neither asset should be prioritized without understanding personal risk tolerance and investment objectives. GRT may offer slightly more established operational history since 2020 and higher liquidity, potentially providing easier entry and exit opportunities. However, the current Extreme Fear market sentiment and significant historical drawdowns for both assets suggest novice investors should focus on education, risk management, and avoiding concentration in single cryptocurrencies before committing substantial capital to either option.
Q8: How might macroeconomic factors affect CREDI vs GRT differently?
Macroeconomic conditions may impact these assets through different transmission mechanisms. CREDI's lending model connecting crypto with SME financing could be sensitive to interest rate changes, credit market conditions, and small business economic health. Rising rates might affect borrowing demand and loan performance. GRT's infrastructure positioning may correlate more closely with overall blockchain adoption trends, developer activity, and Web3 ecosystem growth, which could be influenced by technology investment cycles and risk appetite. Both assets remain subject to inflation dynamics, regulatory policy shifts, and geopolitical factors affecting cryptocurrency markets broadly, though specific sensitivities require ongoing monitoring as market conditions evolve.
Share
Content
Introduction: Investment Comparison Between CREDI and GRT
I. Historical Price Comparison and Current Market Status
II. Core Factors Influencing CREDI vs GRT Investment Value
III. 2026-2031 Price Prediction: CREDI vs GRT
IV. Investment Strategy Comparison: CREDI vs GRT
V. Potential Risk Comparison
VI. Conclusion: Which Is the Better Buy?
VII. FAQ
How to Buy Cryptocurrency


Trending Cryptocurrencies


What will be the market capitalization of USDC in 2025? Analysis of the stablecoin market landscape.

How is DeFi different from Bitcoin?

What is DeFi: Understanding Decentralized Finance in 2025

USDC stablecoin 2025 Latest Analysis: Principles, Advantages, and Web3 Eco-Applications
Development of Decentralized Finance Ecosystem in 2025: Integration of Decentralized Finance Applications with Web3

2025 USDT USD Complete Guide: A Must-Read for Newbie Investors
Ultimate Guide to Free NFT Minting
Investigating the True Identity of Bitcoin Founder Satoshi Nakamoto

How to Participate in Cryptocurrency Airdrops and Essential Security Measures
Top 7 Hardware Picks for Cryptocurrency Mining

What Does DYOR Mean in Crypto?