This article offers a comparative analysis of CTA and TRX as investment options, detailing their historical price trends, supply mechanisms, and institutional adoption. It delves into the key factors affecting the investment value of both assets, emphasizing their differing market presence and risk profiles. Designed for cryptocurrency investors seeking to make informed decisions, the piece explores short-term and long-term strategies, balancing risks and returns. Structured to guide readers from price history to future predictions, the article culminates in investment advice tailored for both new and experienced investors. Key insights and detailed analyses aim to answer the critical question: "Which is the better buy right now?"
Introduction: CTA vs TRX Investment Comparison
In the cryptocurrency market, Cross The Ages (CTA) vs TRON (TRX) comparison has always been a topic that investors cannot avoid. The two not only have significant differences in market cap ranking, application scenarios, and price performance, but also represent different positioning in crypto assets.
Cross The Ages (CTA): Launched as a free-to-play game featuring digital trading cards as non-fungible tokens (NFTs), it has gained market recognition for its gaming ecosystem and utility token.
TRON (TRX): Since its inception in 2017, it has been hailed as a decentralized platform for content entertainment, and has become one of the cryptocurrencies with the highest global transaction volume and market capitalization.
This article will comprehensively analyze the investment value comparison between CTA and TRX, focusing on historical price trends, supply mechanisms, institutional adoption, technical ecosystems, and future predictions, and attempt to answer the question that investors care about most:
"Which is the better buy right now?"
I. Price History Comparison and Current Market Status
Cross The Ages (CTA) and TRON (TRX) Historical Price Trends
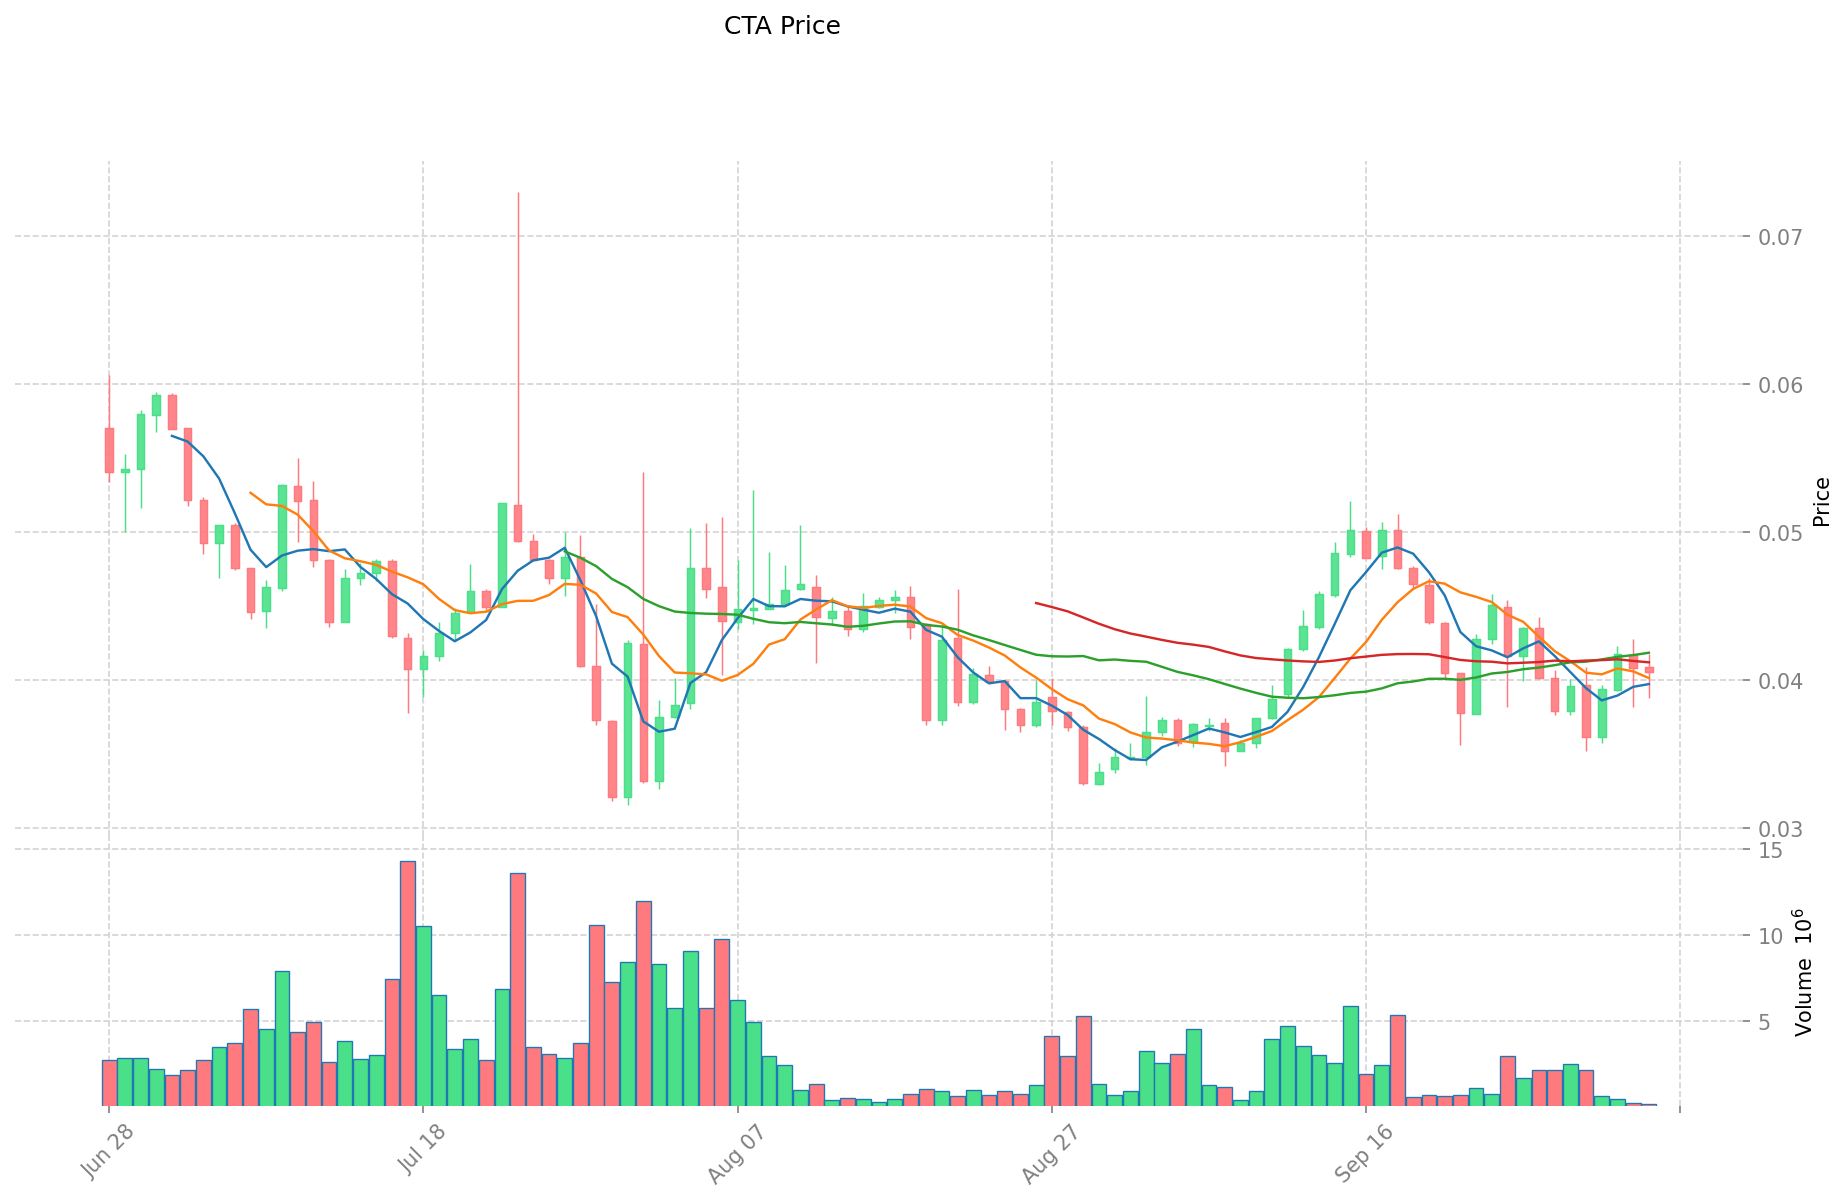
- 2024: CTA reached its all-time high of $0.462 on May 17, 2024.
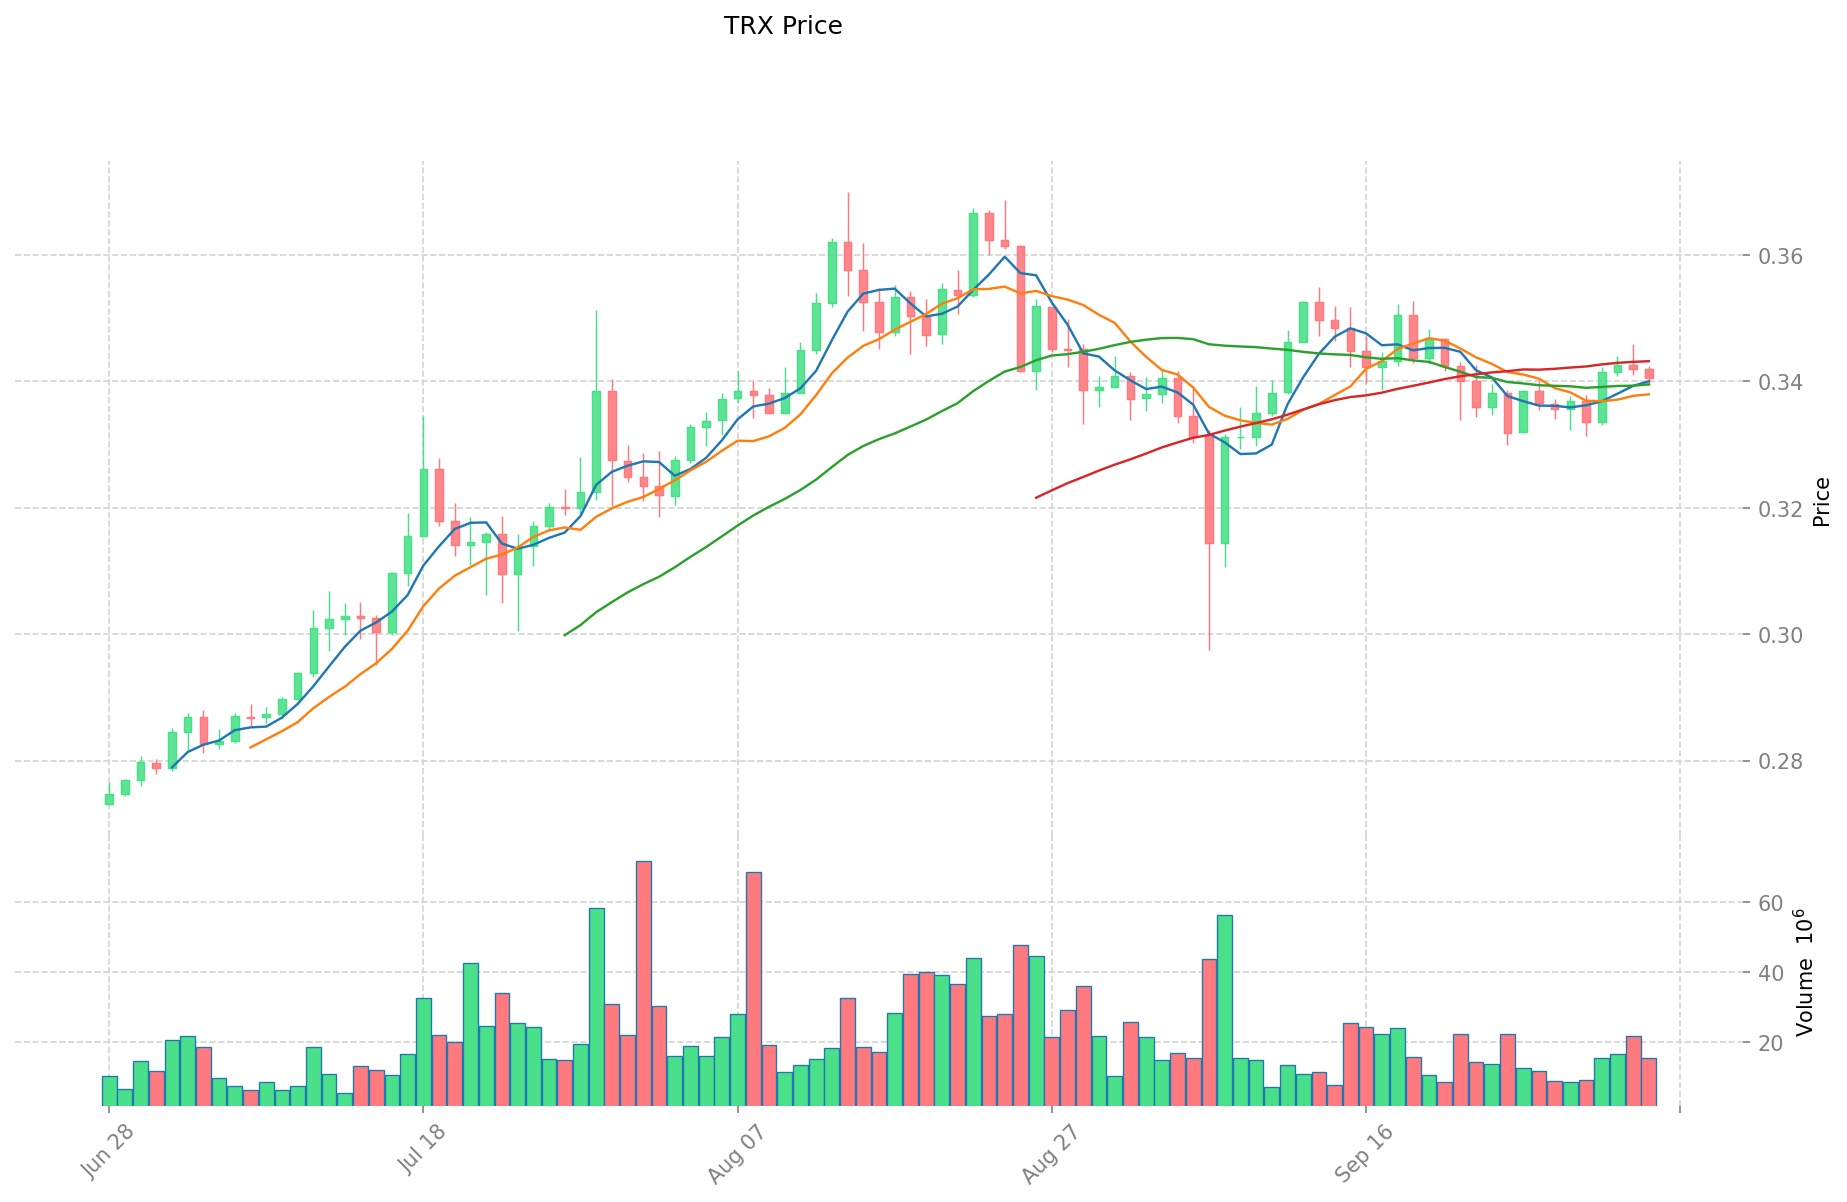
- 2025: TRX hit its all-time high of $0.431288 on December 4, 2024.
- Comparative analysis: In the recent market cycle, CTA dropped from its high of $0.462 to a low of $0.01307, while TRX has shown more stability, maintaining a price above $0.34.
Current Market Situation (2025-10-05)
- CTA current price: $0.04056
- TRX current price: $0.34008
- 24-hour trading volume: CTA $6,768,618 vs TRX $5,252,205,723
- Market Sentiment Index (Fear & Greed Index): 71 (Greed)
Click to view real-time prices:
- View CTA current price Market Price
- View TRX current price Market Price
II. Key Factors Affecting CTA vs TRX Investment Value
Supply Mechanism Comparison (Tokenomics)
- CTA: Investment range expanded through futures to diversify the high risk inherent in momentum strategies
- TRX: Value influenced by blockchain applications and market demand
- 📌 Historical pattern: Market momentum and macroeconomic factors drive price cycles for CTA, while TRX is more influenced by blockchain adoption
Institutional Adoption and Market Applications
- Institutional holdings: CTA strategies more commonly used by global asset management companies and investment banks (e.g., Deutsche Bank)
- Corporate adoption: CTA focuses on momentum across multiple asset classes, while TRX focuses on blockchain-based applications
- Regulatory attitudes: Regulated differently as CTA represents traditional managed futures strategies while TRX faces crypto-specific regulations
Technical Development and Ecosystem Building
- CTA technical characteristics: Price momentum-driven with emphasis on "price moves first, funds follow" strategy
- TRX technical development: Blockchain technology applications with focus on decentralized services
- Ecosystem comparison: CTA operates in traditional financial markets, while TRX operates within blockchain ecosystem
Macroeconomic Factors and Market Cycles
- Performance in inflationary environments: CTA potentially more responsive to macroeconomic shifts
- Monetary policy impact: Interest rates and Federal Reserve decisions can trigger 3%-8% quick retracements in CTA/quantitative positions
- Geopolitical factors: Liquidity expectations and marginal capital determine secondary market directions for both assets
III. 2025-2030 Price Prediction: CTA vs TRX
Short-term Prediction (2025)
- CTA: Conservative $0.0259 - $0.0405 | Optimistic $0.0405 - $0.0507
- TRX: Conservative $0.2721 - $0.3402 | Optimistic $0.3402 - $0.3946
Mid-term Prediction (2027)
- CTA may enter a growth phase, with an estimated price range of $0.0349 - $0.0648
- TRX may enter a bullish market, with an estimated price range of $0.2536 - $0.6077
- Key drivers: Institutional capital inflow, ETF, ecosystem development
Long-term Prediction (2030)
- CTA: Base scenario $0.0383 - $0.0685 | Optimistic scenario $0.0685 - $0.0753
- TRX: Base scenario $0.4851 - $0.6931 | Optimistic scenario $0.6931 - $0.7485
View detailed price predictions for CTA and TRX
Disclaimer: The above predictions are based on historical data and market analysis. Cryptocurrency markets are highly volatile and subject to rapid changes. These forecasts should not be considered as financial advice. Always conduct your own research before making investment decisions.
CTA:
| 年份 |
预测最高价 |
预测平均价格 |
预测最低价 |
涨跌幅 |
| 2025 |
0.0507 |
0.04056 |
0.0259584 |
0 |
| 2026 |
0.0652509 |
0.04563 |
0.0264654 |
12 |
| 2027 |
0.0648653265 |
0.05544045 |
0.0349274835 |
36 |
| 2028 |
0.06737123484 |
0.06015288825 |
0.0342871463025 |
48 |
| 2029 |
0.07332637077675 |
0.063762061545 |
0.04399582246605 |
57 |
| 2030 |
0.075398637776962 |
0.068544216160875 |
0.03838476105009 |
68 |
TRX:
| 年份 |
预测最高价 |
预测平均价格 |
预测最低价 |
涨跌幅 |
| 2025 |
0.3946668 |
0.34023 |
0.272184 |
0 |
| 2026 |
0.507078792 |
0.3674484 |
0.216794556 |
8 |
| 2027 |
0.60779639844 |
0.437263596 |
0.25361288568 |
28 |
| 2028 |
0.6374865966084 |
0.52252999722 |
0.4127986978038 |
53 |
| 2029 |
0.806211532710738 |
0.5800082969142 |
0.539407716130206 |
70 |
| 2030 |
0.748558707997466 |
0.693109914812469 |
0.485176940368728 |
103 |
IV. Investment Strategy Comparison: CTA vs TRX
Long-term vs Short-term Investment Strategies
- CTA: Suitable for investors focused on momentum strategies and diversification across asset classes
- TRX: Suitable for investors interested in blockchain technology and decentralized applications
Risk Management and Asset Allocation
- Conservative investors: CTA: 30% vs TRX: 70%
- Aggressive investors: CTA: 60% vs TRX: 40%
- Hedging tools: Stablecoin allocation, options, cross-currency portfolios
V. Potential Risk Comparison
Market Risks
- CTA: High volatility due to momentum-based strategies
- TRX: Susceptible to overall crypto market sentiment and blockchain adoption rates
Technical Risks
- CTA: Scalability, network stability
- TRX: Hash power concentration, security vulnerabilities
Regulatory Risks
- Global regulatory policies have different impacts on both assets, with TRX facing more crypto-specific regulations
VI. Conclusion: Which Is the Better Buy?
📌 Investment Value Summary:
- CTA advantages: Diversification across asset classes, potential for high returns in trending markets
- TRX advantages: Established blockchain ecosystem, higher market cap and liquidity
✅ Investment Advice:
- New investors: Consider a balanced approach with a higher allocation to TRX due to its established market position
- Experienced investors: Explore opportunities in both assets, leveraging CTA for momentum strategies and TRX for blockchain exposure
- Institutional investors: Incorporate both assets into diversified portfolios, with CTA for alternative strategies and TRX for blockchain technology exposure
⚠️ Risk Warning: The cryptocurrency market is highly volatile. This article does not constitute investment advice.
None
VII. FAQ
Q1: What are the main differences between CTA and TRX?
A: CTA is a token associated with a gaming ecosystem and NFTs, while TRX is a cryptocurrency for a decentralized content entertainment platform. CTA is more focused on momentum strategies across asset classes, while TRX is centered on blockchain applications and decentralized services.
Q2: Which has performed better historically, CTA or TRX?
A: TRX has shown more price stability recently. While CTA reached an all-time high of $0.462 in May 2024, it subsequently dropped to $0.01307. TRX, on the other hand, has maintained a price above $0.34 after hitting its all-time high of $0.431288 in December 2024.
Q3: How do institutional adoptions differ between CTA and TRX?
A: CTA strategies are more commonly used by global asset management companies and investment banks, such as Deutsche Bank. TRX, however, focuses more on blockchain-based applications and corporate adoption within its ecosystem.
Q4: What are the price predictions for CTA and TRX by 2030?
A: For CTA, the base scenario predicts a range of $0.0383 - $0.0685, with an optimistic scenario of $0.0685 - $0.0753. For TRX, the base scenario predicts $0.4851 - $0.6931, with an optimistic scenario of $0.6931 - $0.7485.
Q5: How should investors allocate their portfolio between CTA and TRX?
A: Conservative investors might consider allocating 30% to CTA and 70% to TRX, while aggressive investors might opt for 60% CTA and 40% TRX. However, individual allocation should be based on personal risk tolerance and investment goals.
Q6: What are the main risks associated with investing in CTA and TRX?
A: CTA faces high volatility due to momentum-based strategies and technical risks like scalability. TRX is susceptible to overall crypto market sentiment, blockchain adoption rates, and faces risks such as hash power concentration and security vulnerabilities. Both are subject to regulatory risks, with TRX facing more crypto-specific regulations.
* The information is not intended to be and does not constitute financial advice or any other recommendation of any sort offered or endorsed by Gate.


