Is Gains Network (GNS) a good investment?: A Comprehensive Analysis of Tokenomics, Market Performance, and Future Prospects

Introduction: Gains Network (GNS) Investment Position and Market Prospects
Gains Network (GNS) is an important asset in the cryptocurrency domain. As of December 2025, GNS maintains a market capitalization of approximately $32.97 million USD with a circulating supply of 26,738,126 tokens, currently trading at $1.233. Positioned as a "fair and advanced decentralized leverage trading protocol," GNS has garnered increasing attention from investors discussing whether Gains Network (GNS) represents a viable investment opportunity. The platform supports 45+ cryptocurrencies and 20+ stocks with 5-150x leverage, alongside 10 foreign exchange pairs with 20-1000x leverage capabilities, with indices and commodities slated for future launch.
Despite its specialized market positioning within the derivatives trading ecosystem, GNS has experienced notable price pressure over the extended timeframe, declining 36.35% over the past year and trading significantly below its all-time high of $12.48 reached in February 2023. The token currently ranks 643rd by market capitalization and maintains a market share of 0.0010%, indicating its niche positioning within the broader cryptocurrency market.
This article provides a comprehensive analysis of GNS' investment fundamentals, historical price performance, forward-looking price projections, and associated investment risks to inform decision-making for potential investors.
Gains Network (GNS) Market Analysis Report
I. GNS Price History Review and Current Investment Value
GNS Historical Price Performance and Investment Returns
- February 17, 2023: All-time high of $12.48 USD reached, representing peak market valuation during bull market cycle
- November 29, 2021: All-time low of $0.265841 USD recorded, marking the lowest point in protocol's trading history
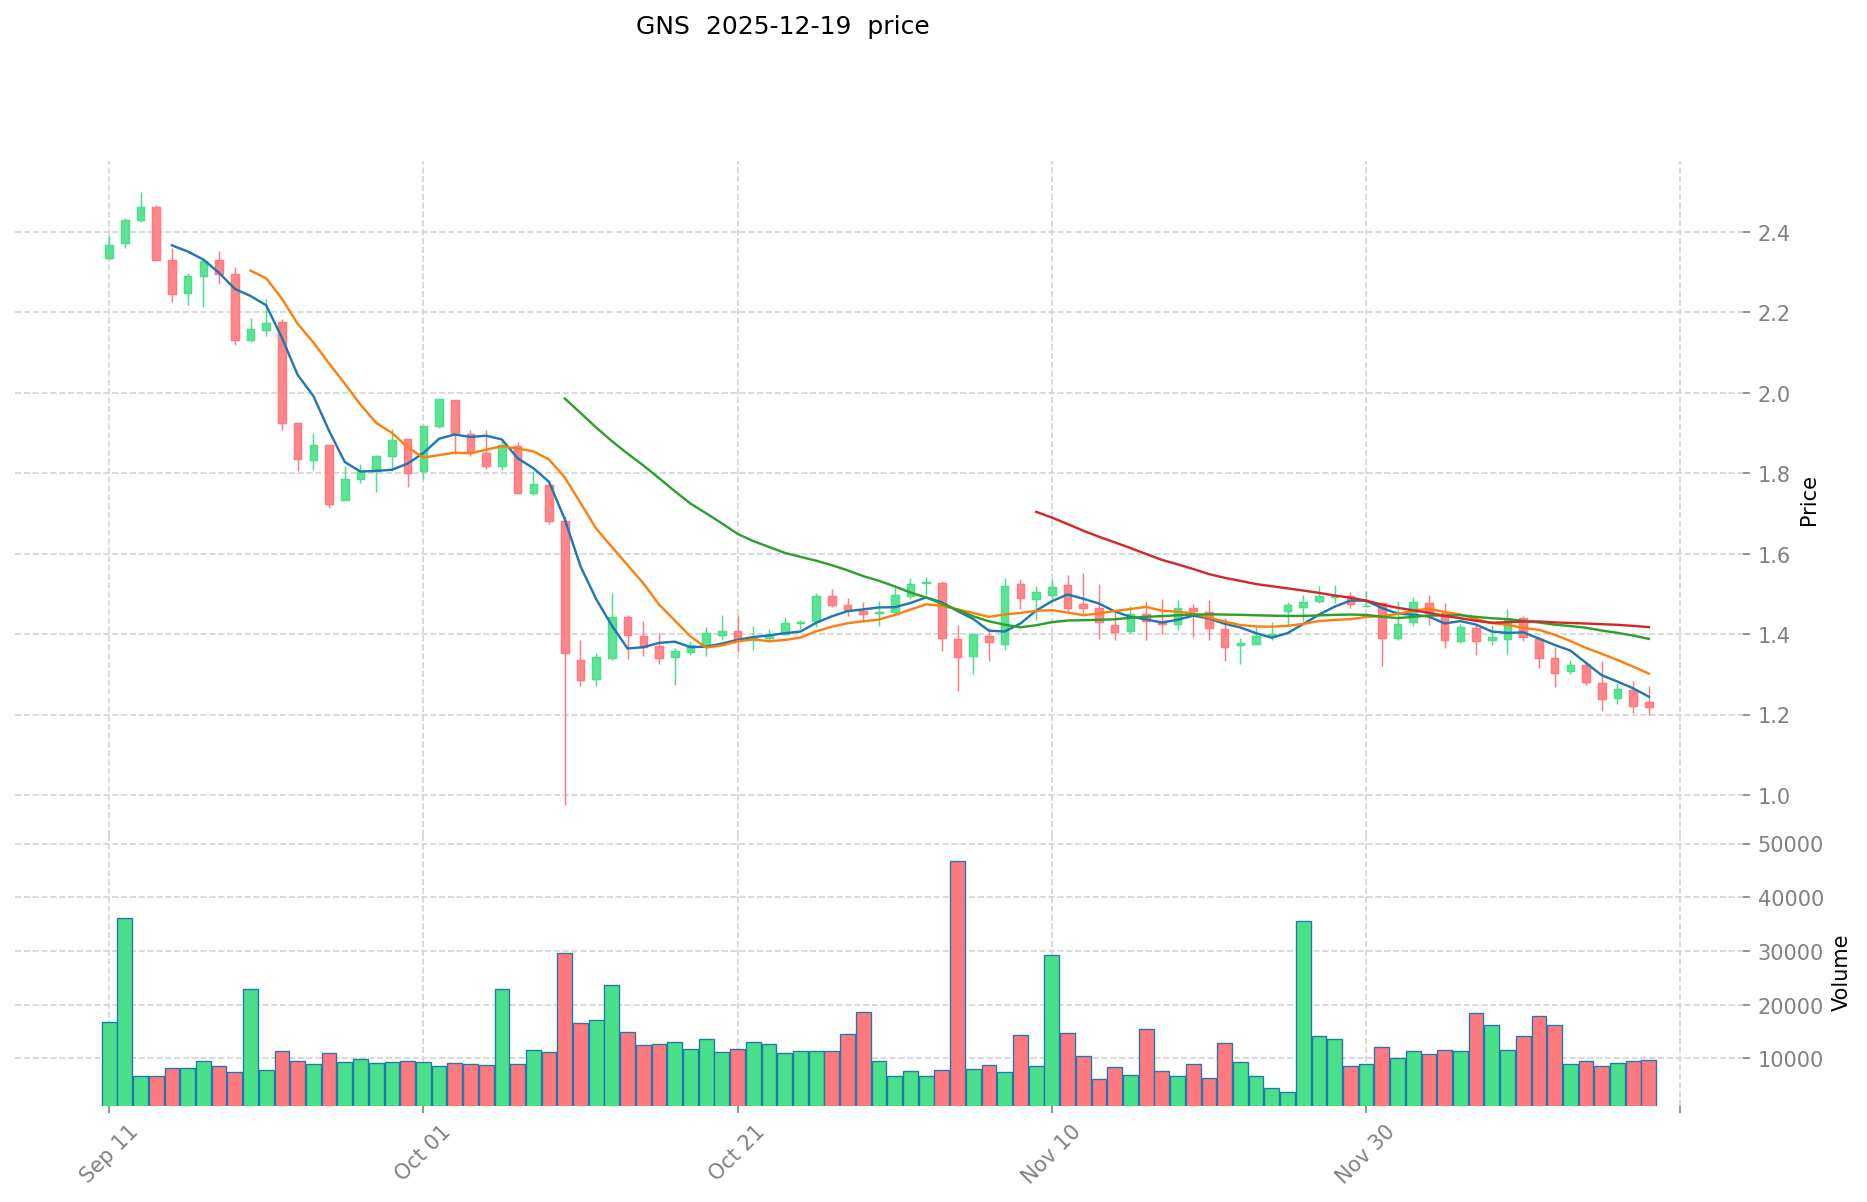
- Current Period (December 2025): Price corrected significantly from historical highs, trading at $1.233 USD with approximately 90.2% decline from peak valuations
Current GNS Market Status (December 19, 2025)
- Current Price: $1.233 USD
- 24-Hour Price Change: -0.22%
- 7-Day Price Change: -9.22%
- 30-Day Price Change: -16.16%
- 1-Year Price Change: -36.35%
- Market Capitalization: $32,968,109.36 USD
- 24-Hour Trading Volume: $11,804.80 USD
- Market Dominance: 0.0010%
- Total Supply: 26,738,126 GNS
- Circulating Supply: 26,738,126 GNS (88.27% of total)
- Market Ranking: #643 by market capitalization
- All-Time High Date: February 17, 2023 ($12.48)
- All-Time Low Date: November 29, 2021 ($0.265841)
Market sentiment indicator shows neutral positioning with token actively trading across 15 cryptocurrency exchanges.
II. Protocol Overview and Functionality
Gains Network is a fair and advanced decentralized leverage trading protocol featuring:
- Cryptocurrency Trading: 5-150x leverage available for 45+ cryptocurrencies
- Stock Trading: 5-150x leverage for 20+ tokenized stocks
- Foreign Exchange (Forex): 20-1000x leverage for 10 currency pairs
- Future Asset Classes: Indices and commodities trading under development
III. Network Infrastructure and Blockchain Deployment
GNS token operates on the following blockchain networks:
- Polygon (MATIC): Contract address 0xE5417Af564e4bFDA1c483642db72007871397896
- Arbitrum (ARBEVM): Contract address 0x18c11FD286C5EC11c3b683Caa813B77f5163A122
IV. Key Metrics and Market Position
| Metric | Value |
|---|---|
| Circulating Supply Ratio | 88.27% |
| Fully Diluted Valuation (FDV) | $32,968,109.36 USD |
| Market Cap to FDV Ratio | 88.27% |
| Unique Token Holders | 20,949 |
| Exchange Listings | 15 major exchanges |
| Price Range (24H) | $1.1997 - $1.2698 |
V. Community and Official Resources
- Official Website: https://gains.trade/
- Documentation: https://gains-network.gitbook.io/docs-home/
- Official Twitter: https://twitter.com/GainsNetwork_io
- Block Explorers:
- Polygon: https://polygonscan.com/
- Arbitrum: https://arbiscan.io/
Report Date: December 19, 2025
Data Source: Real-time market data as of 11:17:19 UTC
Gains Network (GNS) Investment Analysis Report
Report Date: December 19, 2025
I. Project Overview
Basic Information
Gains Network is a decentralized leverage trading protocol designed to provide fair and advanced trading opportunities across multiple asset classes. The protocol operates on a transparent and user-friendly infrastructure for digital asset trading.
Core Features
Gains Network supports:
- Cryptocurrencies: 45+ cryptocurrencies with 5-150x leverage
- Equities: 20+ stocks with 5-150x leverage
- Foreign Exchange: 10 forex pairs with 20-1000x leverage
- Upcoming Assets: Index and commodity trading expected to launch
Token Specifications
| Metric | Value |
|---|---|
| Current Price (as of Dec 19, 2025) | $1.233 |
| Market Capitalization | $32,968,109.36 |
| Circulating Supply | 26,738,126 GNS |
| Total Supply | 26,738,126 GNS |
| Maximum Supply | Unlimited (∞) |
| 24-Hour Trading Volume | $11,804.80 |
| Market Ranking | #643 |
| Token Holders | 20,949 |
II. Core Factors Affecting GNS Investment Viability
Supply Mechanism and Scarcity
The GNS token has a circulating supply equal to total supply (26,738,126 tokens), with an unlimited maximum supply. This characteristic differs significantly from tokens with hard caps:
- Supply Dynamics: The unlimited maximum supply suggests potential future token issuance without predetermined limits
- Scarcity Impact: Current circulating-to-total supply ratio of 88.27% indicates most tokens are already in circulation, reducing scarcity effects
- Investment Consideration: The absence of a hard cap may create long-term dilution risks
Technology and Ecosystem Development
Core Protocol Capabilities
- Multi-Asset Support: The protocol's expansion to 45+ cryptocurrencies, 20+ equities, and 10+ forex pairs demonstrates active ecosystem development
- Leverage Infrastructure: Differentiated leverage levels (5-150x for crypto/stocks, 20-1000x for forex) address varying trading risk appetites
- Planned Expansions: Upcoming index and commodity trading indicate continuous protocol evolution
Market Integration
- Exchange Presence: GNS is listed on 15 exchanges, providing reasonable liquidity access
- Blockchain Deployment: Token operates on Polygon (MATIC) and Arbitrum (ARBEVM) networks, leveraging layer-2 scaling solutions
- Developer Resources: Gitbook documentation available at https://gains-network.gitbook.io/docs-home/
III. Price Performance Analysis
Current Market Status
| Time Period | Price Change | Absolute Change |
|---|---|---|
| 1 Hour | +1.66% | +$0.0201 |
| 24 Hours | -0.22% | -$0.0027 |
| 7 Days | -9.22% | -$0.1252 |
| 30 Days | -16.16% | -$0.2377 |
| 1 Year | -36.35% | -$0.7042 |
Historical Price Range
- All-Time High: $12.48 (February 17, 2023)
- All-Time Low: $0.2658 (November 29, 2021)
- Current Position: 90.1% below all-time high; 363.9% above all-time low
- 24-Hour Range: $1.1997 - $1.2698
Market Sentiment
The market emotion indicator shows a neutral-to-slightly-positive score of 1, reflecting cautious market sentiment regarding GNS prospects.
IV. Investment Outlook Considerations
Mixed Market Forecasts
Based on available data, analyst predictions for GNS present divergent views:
- Bearish Forecasts: Some technical analyses indicate bearish trends for 2025
- Optimistic Projections: Certain forecasts suggest potential price recovery based on leverage trading adoption
- Price Range Estimates: Various 2025 predictions range from $0.94 to $3.18, reflecting significant analytical uncertainty
Key Uncertainties
- Long-Term Adoption: Success depends on merchant and trader adoption of the decentralized leverage trading protocol
- Market Competition: The competitive landscape of decentralized trading platforms remains dynamic
- Regulatory Environment: DeFi leverage trading protocols face evolving regulatory scrutiny globally
- Economic Sensitivity: Leverage trading demand correlates with market volatility and trader risk appetite
V. Risk Factors
Protocol-Specific Risks
- Unlimited token supply creates potential dilution scenarios
- Leverage trading inherently involves liquidation and counterparty risks
- Regulatory challenges to derivatives trading in certain jurisdictions
Market Risks
- Significant year-over-year price decline (-36.35%) indicates recent underperformance
- Limited market capitalization ($32.97M) relative to major cryptocurrencies suggests lower liquidity depth
- Concentration risk with 20,949 token holders
Competitive Risks
- Multiple competing decentralized leverage trading protocols in operation
- Established centralized exchanges offer similar products with greater liquidity
VI. Project Resources
Official Channels:
- Website: https://gains.trade/
- Twitter: https://twitter.com/GainsNetwork_io
- Documentation: https://gains-network.gitbook.io/docs-home/
Blockchain Verification:
- Polygon (MATIC): 0xE5417Af564e4bFDA1c483642db72007871397896
- Arbitrum (ARBEVM): 0x18c11FD286C5EC11c3b683Caa813B77f5163A122
VII. Conclusion
Gains Network operates as a functioning decentralized leverage trading protocol with active ecosystem development and multi-chain deployment. However, potential investors should note:
- Structural Considerations: Unlimited token supply and high circulating supply ratio may create long-term valuation pressures
- Market Performance: Significant year-over-year price decline and current market position warrant careful analysis
- Analyst Consensus: Mixed forecasts reflect genuine uncertainty about protocol adoption trajectory
- Regulatory Landscape: DeFi leverage trading remains subject to evolving regulatory frameworks
Investment decisions should incorporate individual risk tolerance, portfolio objectives, and comprehensive due diligence on competitive positioning and adoption metrics.
Disclaimer: This report presents factual data and observable market information. It does not constitute financial advice or investment recommendations.
III. GNS Future Investment Prediction and Price Outlook (Is Gains Network(GNS) worth investing in 2025-2030)
Short-term Investment Prediction (2025, short-term GNS investment outlook)
- Conservative forecast: $0.81 - $1.23
- Neutral forecast: $1.23 - $1.47
- Optimistic forecast: $1.47 - $1.76
Mid-term Investment Outlook (2026-2028, mid-term Gains Network(GNS) investment forecast)
- Market phase expectations: GNS is positioned in the decentralized leverage trading sector with expanding asset class support. The protocol's development toward index and commodity offerings represents market maturation and potential user base expansion.
- Investment return predictions:
- 2026: $1.23 - $1.40
- 2027: $1.11 - $1.91
- 2028: $0.85 - $1.78
- Key catalysts: Protocol expansion to new asset classes (indices and commodities), ecosystem growth on multiple chains (Polygon, Arbitrum), increasing institutional participation in DeFi derivatives trading, and enhanced protocol features and security upgrades.
Long-term Investment Outlook (Is GNS a good long-term investment?)
- Base case scenario: $1.10 - $2.39 (2025-2030) — Assumes steady protocol adoption, sustained decentralized trading demand, and competitive maintenance within the derivatives ecosystem
- Optimistic scenario: $1.91 - $2.39 (2025-2030) — Corresponds to accelerated platform adoption, successful launch of index and commodity products, and stronger market positioning
- Risk scenario: $0.81 - $1.10 — Reflects competitive pressures, regulatory challenges, or reduced trading volumes in the decentralized leverage segment
For comprehensive GNS long-term investment and price forecasting: Price Prediction
2025-12-31 to 2030-12-31 Long-term Outlook
- Base case scenario: $1.23 - $1.74 USD (corresponding to steady development and mainstream application progress)
- Optimistic scenario: $1.74 - $2.39 USD (corresponding to large-scale adoption and favorable market conditions)
- Transformative scenario: $2.39 USD and above (contingent on breakthrough ecosystem progress and mainstream adoption)
- 2030-12-31 Predicted high: $2.39 USD (based on optimistic development assumptions)
Disclaimer: This analysis is based on available forecast data and historical patterns. Cryptocurrency markets are highly volatile and unpredictable. Price predictions carry substantial uncertainty and may differ significantly from actual results. Past performance does not guarantee future outcomes. This analysis does not constitute investment advice.
| 年份 | 预测最高价 | 预测平均价格 | 预测最低价 | 涨跌幅 |
|---|---|---|---|---|
| 2025 | 1.465366 | 1.2314 | 0.812724 | 0 |
| 2026 | 1.40231832 | 1.348383 | 1.22702853 | 9 |
| 2027 | 1.9117374174 | 1.37535066 | 1.1140340346 | 11 |
| 2028 | 1.775027561796 | 1.6435440387 | 0.854642900124 | 33 |
| 2029 | 1.77765723225792 | 1.709285800248 | 1.55545007822568 | 38 |
| 2030 | 2.388555977266555 | 1.74347151625296 | 1.098387055239364 | 41 |
Gains Network (GNS) Investment Analysis Report
I. Executive Summary
Gains Network is a decentralized leverage trading protocol that enables users to trade multiple asset classes with significant leverage ratios. As of December 19, 2025, GNS is trading at $1.233 with a market capitalization of approximately $32.97 million, ranking 643rd by market cap. The token has experienced considerable volatility, declining 36.35% over the past year from its all-time high of $12.48 recorded on February 17, 2023.
II. Project Overview
Core Functionality
Gains Network is a fair and advanced decentralized leverage trading protocol offering:
- Cryptocurrencies: 5-150x leverage across 45+ digital assets
- Stocks: 5-150x leverage for 20+ stock indices
- Forex Pairs: 20-1000x leverage for 10 foreign exchange pairs
- Future Expansion: Index and commodity trading capabilities (forthcoming)
Network Architecture
- Blockchain Networks: Currently deployed on Polygon (MATIC) and Arbitrum (ARBEVM)
- Token Supply: 26,738,126 GNS in circulation (88.27% of total supply)
- Max Supply: Unlimited
- Token Holders: 20,949 addresses
- Trading Venues: Listed on 15 exchanges
III. Market Performance Analysis
Price Metrics
| Metric | Value |
|---|---|
| Current Price | $1.233 |
| 24h High/Low | $1.2698 / $1.1997 |
| All-Time High | $12.48 (Feb 17, 2023) |
| All-Time Low | $0.265841 (Nov 29, 2021) |
| Market Cap | $32,968,109.36 |
| 24h Volume | $11,804.80 |
| Market Dominance | 0.0010% |
Price Momentum
| Period | Change | Amount |
|---|---|---|
| 1 Hour | +1.66% | +$0.0201 |
| 24 Hours | -0.22% | -$0.0027 |
| 7 Days | -9.22% | -$0.1252 |
| 30 Days | -16.16% | -$0.2377 |
| 1 Year | -36.35% | -$0.7042 |
The token exhibits significant short-term weakness with negative performance across the 7-day, 30-day, and 12-month timeframes, though slight hourly gains suggest recent stabilization attempts.
IV. Investment Strategy and Risk Management
Investment Methodologies
Long-term Holdings (HODL Strategy)
- Suited for conservative investors believing in protocol adoption and leverage trading expansion
- Requires conviction in decentralized derivatives market growth
- Appropriate for investors with extended investment horizons (3+ years)
Active Trading
- Technical analysis-driven approaches leveraging the token's volatility
- Wave trading capitalizing on 7-14 day price cycles
- Requires sophisticated risk management due to 9.22% weekly volatility
Risk Management Framework
Asset Allocation Guidelines
- Conservative Investors: 1-3% portfolio allocation maximum
- Aggressive Investors: 5-10% portfolio allocation
- Professional Traders: Tactical positions based on technical signals, typically 2-5% of trading capital
Risk Mitigation Strategies
- Portfolio Diversification: Combine GNS with established layer-1 and layer-2 blockchain protocols
- Hedging Instruments: Utilize stablecoin pairs and derivatives markets for downside protection
- Position Sizing: Implement stop-loss orders at -15% to -20% below entry points
Secure Asset Storage
- Hot Wallets: MetaMask, Phantom for frequent traders on Polygon and Arbitrum networks
- Cold Storage: Hardware wallets (Ledger, Trezor) for long-term holdings
- Institutional Grade: Multi-signature wallets for significant positions
V. Investment Risks and Challenges
Market Risks
- High Volatility: 36.35% annual decline demonstrates severe price fluctuations unsuitable for risk-averse investors
- Liquidity Concentration: $11,804 daily volume on $32.97M market cap indicates potential slippage on large orders
- Market Sentiment: Currently neutral market emotion suggests uncertain price direction
Regulatory Risks
- Leverage Trading Restrictions: Increasingly stringent regulatory frameworks across major jurisdictions may limit protocol accessibility
- Derivative Product Compliance: Forex and stock leverage offerings face evolving regulatory scrutiny in EU, US, and Asian markets
- Geographic Limitations: Potential restrictions limiting protocol access to specific regions
Technical Risks
- Smart Contract Vulnerabilities: Leverage protocols inherently require complex risk management mechanisms susceptible to exploitation
- Cross-chain Risks: Multi-chain deployment (Polygon, Arbitrum) introduces additional security vectors
- Liquidity Provider Exposure: Protocol dependency on adequate collateral and liquidity mechanisms
VI. Conclusion: Is Gains Network a Good Investment?
Investment Value Assessment
Gains Network operates in a high-growth derivatives trading sector with substantial addressable market potential. However, the token has experienced severe depreciation (-36.35% annually), suggesting fundamental challenges or market headwinds. The protocol's ambitious expansion into multiple asset classes demonstrates development momentum, yet execution risk remains significant.
Investor Recommendations
✅ Beginners
- Dollar-cost averaging strategy with monthly allocations ($50-$100)
- Secure storage in hardware wallets following security best practices
- Position sizing: 1% maximum portfolio allocation
- Extended holding period (3+ years) to accommodate volatility
✅ Experienced Investors
- Wave trading on 7-14 day cycles exploiting technical support/resistance levels
- Portfolio diversification combining GNS with complementary DeFi protocols
- Active position management with defined profit-taking and stop-loss levels
- Position sizing: 5% maximum per trade
✅ Institutional Investors
- Strategic long-term positioning contingent upon protocol adoption metrics and trading volume growth
- Detailed due diligence on smart contract audits and risk management mechanisms
- Staged accumulation aligned with technical and on-chain metrics improvement
Risk Disclosure
⚠️ Critical Notice: Cryptocurrency investments, particularly in decentralized derivatives protocols, carry substantial financial risk including complete capital loss. This analysis is provided for informational purposes only and does not constitute investment advice, financial recommendations, or solicitation to purchase. Conduct independent research, consult qualified financial advisors, and only allocate capital you can afford to lose entirely.
Report Date: December 19, 2025
Data Source: Gate Market Data
Disclaimer: This report reflects market conditions as of the publication date. Market conditions, regulatory environments, and protocol developments are subject to rapid change.
Gains Network (GNS) Investment Analysis Report - FAQ
FAQ
Q1: What is Gains Network (GNS) and what are its core functionalities?
A: Gains Network is a fair and advanced decentralized leverage trading protocol that enables users to trade multiple asset classes with varying leverage ratios. The protocol currently supports 45+ cryptocurrencies with 5-150x leverage, 20+ tokenized stocks with 5-150x leverage, and 10 foreign exchange pairs with 20-1000x leverage. Additionally, index and commodity trading capabilities are scheduled for future launch. The GNS token operates on Polygon (MATIC) and Arbitrum (ARBEVM) blockchain networks and is listed on 15 major cryptocurrency exchanges.
Q2: What is the current market position and price performance of GNS as of December 2025?
A: As of December 19, 2025, GNS is trading at $1.233 USD with a market capitalization of approximately $32.97 million, ranking 643rd by market capitalization with a 0.0010% market dominance. The token shows concerning short-term weakness, declining 0.22% over 24 hours, 9.22% over 7 days, 16.16% over 30 days, and 36.35% over the past year. The token has experienced a significant decline from its all-time high of $12.48 reached on February 17, 2023, representing a 90.1% depreciation. Current 24-hour trading volume stands at $11,804.80 USD across 15 exchanges with 20,949 token holders.
Q3: What are the main supply characteristics of the GNS token, and how might this affect long-term value?
A: The GNS token has a circulating supply of 26,738,126 tokens with a total supply equal to the circulating supply, representing 88.27% circulation ratio. Critically, GNS features an unlimited maximum supply, which differs substantially from tokens with hard caps. This unlimited supply structure creates potential long-term dilution risks, as the protocol can issue additional tokens without predetermined limits. The absence of scarcity mechanisms may constrain long-term price appreciation and should be carefully considered by investors evaluating multi-year holding strategies.
Q4: What price projections exist for GNS through 2030, and what scenarios do they represent?
A: Available analyst forecasts present divergent scenarios for GNS through 2030. Short-term 2025 predictions range from $0.81 (conservative) to $1.76 (optimistic). For mid-term horizons (2026-2028), predictions vary significantly: 2026 ranges $1.23-$1.40, 2027 ranges $1.11-$1.91, and 2028 ranges $0.85-$1.78. Long-term 2030 projections span: base case scenario of $1.23-$1.74 USD, optimistic scenario of $1.74-$2.39 USD, and transformative scenario exceeding $2.39 USD. These wide ranges reflect substantial analytical uncertainty regarding protocol adoption trajectory and market conditions. Predictions carry substantial uncertainty and may differ significantly from actual results.
Q5: What are the primary investment risks associated with GNS, and how should investors manage exposure?
A: GNS presents multiple risk categories requiring careful evaluation. Market risks include high volatility (36.35% annual decline), limited liquidity ($11,804 daily volume on $32.97M market cap), and neutral market sentiment. Regulatory risks stem from increasingly stringent frameworks around leverage trading, derivative products, and potential geographic restrictions. Technical risks encompass smart contract vulnerabilities inherent to leverage protocols, cross-chain deployment complexities, and dependency on adequate liquidity provider mechanisms. Risk management strategies include portfolio allocation limits (1-3% for conservative investors, 5-10% for aggressive investors), diversification with established protocols, implementation of stop-loss orders at -15% to -20% below entry points, and secure asset storage utilizing hardware wallets for significant positions.
Q6: Which investor types would benefit most from GNS investment, and what strategies are recommended?
A: GNS investment suitability varies by investor profile. Beginner investors should employ dollar-cost averaging strategies with monthly allocations of $50-$100, maintain maximum portfolio allocation of 1%, utilize hardware wallet storage, and adopt extended holding periods exceeding 3 years to accommodate volatility. Experienced investors may pursue wave trading strategies on 7-14 day cycles, diversify GNS with complementary DeFi protocols, actively manage positions with defined profit-taking and stop-loss levels, and maintain 5% maximum position sizing. Institutional investors should pursue strategic long-term positioning contingent upon protocol adoption metrics and trading volume growth, conduct detailed smart contract audits, and implement staged accumulation aligned with technical improvements. All investor types should recognize that cryptocurrency investments carry substantial financial risk including complete capital loss.
Q7: What are the key catalysts and development milestones that could influence GNS's future value?
A: Significant catalysts affecting GNS include protocol expansion to new asset classes (indices and commodities), expanded ecosystem growth across Polygon and Arbitrum networks, increasing institutional participation in DeFi derivatives trading, and implementation of enhanced protocol features and security upgrades. The protocol's ability to attract sustained user volume and trading activity remains critical for value appreciation. Competitive positioning within the decentralized derivatives sector, regulatory environment developments, and broader cryptocurrency market adoption trends represent additional influences. Success fundamentally depends on merchant and trader adoption of the decentralized leverage trading infrastructure, competitive maintenance against alternative platforms, and sustained market demand for leveraged trading products.
Q8: Is Gains Network (GNS) a viable investment for 2025-2030, and what investment approach is recommended?
A: Gains Network presents a mixed investment case for the 2025-2030 period. The protocol operates in a high-growth derivatives trading sector with substantial addressable market potential and demonstrates development momentum through planned expansions. However, severe price depreciation (-36.35% annually), limited market capitalization, low daily trading volume, and unlimited token supply structure present significant headwinds. The token is viable only for investors with extended time horizons, substantial risk tolerance, and conviction in decentralized derivatives adoption. Recommended approaches include initial position establishment through dollar-cost averaging, diversification within broader DeFi portfolios, active risk management with defined exit points, and secure asset storage practices. Investors should only allocate capital they can afford to lose entirely and conduct independent research before commitment. This analysis does not constitute investment advice or financial recommendations but rather informational assessment of observable market conditions.
Report Date: December 19, 2025
Disclaimer: This FAQ reflects factual market data and observable information as of the publication date. Cryptocurrency markets are highly volatile and subject to rapid change. This analysis does not constitute investment advice, financial recommendations, or solicitation to purchase.
Share
How to Buy Cryptocurrency


Trending Cryptocurrencies


Is Perpetual Protocol (PERP) a Good Investment?: A Comprehensive Analysis of Its Long-term Potential in the DeFi Derivatives Market

Is NASDEX (NSDX) a good investment?: Analyzing the potential of this decentralized derivatives exchange token

What Do Derivatives Market Signals Reveal About MYX's 20% Pullback Risk?

KCT vs GMX: The Battle of Cryptocurrency Trading Platforms Heats Up
What Are the Key Signals from Crypto Derivatives Markets in 2025?
How Do Derivative Market Signals Indicate UNI's Potential Price Recovery in 2025?

Understanding M2 Money Supply and Its Impact on Financial Markets

Beginner's Guide to Bitcoin Margin Trading

Ultimate Guide to Wise Monkey Token & Future Price Insights for New Investors

Beginner's Guide to Cryptocurrency Trading

Exploring the Functionality of Polkadot Parachains: An In-Depth Overview