JST vs MANA: A Comprehensive Comparison of Two Leading Blockchain Tokens in the Metaverse Ecosystem


Introduction: JST vs MANA Investment Comparison
In the cryptocurrency market, comparing JST vs MANA is a topic investors frequently encounter. The two tokens exhibit notable differences in market capitalization ranking, application scenarios, and price performance, representing distinct positioning within the crypto asset landscape.
JST (Just): Launched in 2020, JST has gained market recognition by establishing a fair decentralized financial system that provides stable coin lending and governance mechanisms for global users. As part of the USDJ stablecoin ecosystem built on the TRON blockchain, JST enables community governance participation and transparent on-chain financial services.
MANA (Decentraland): Since its 2017 inception, MANA has been recognized as the utility token of a blockchain-based virtual world platform. Operating on the Ethereum network, Decentraland aims to eliminate intermediary platform profits by allowing content creators and players to permanently own and monetize virtual property rights without intermediary fees.
This article will provide a comprehensive analysis of the investment value comparison between JST vs MANA across historical price trends, supply mechanisms, market adoption, and technology ecosystems, while addressing key questions investors are concerned with:
"Which is the better buy right now?"
Comparative Analysis Report: JST and MANA Crypto Assets
I. Price History Comparison and Current Market Status
JST (Just) and MANA (Decentraland) Historical Price Movements
JST Performance Timeline:
- Published at: May 13, 2020 at initial price of $0.002
- All-time high (ATH): $0.193254 reached on April 5, 2021
- All-time low (ATL): $0.00476275 reached on May 9, 2020
- Peak-to-current decline: Approximately 79.4% from ATH
MANA Performance Timeline:
- Published at: October 31, 2017 at initial price of $0.02339
- All-time high (ATH): $5.85 reached on November 25, 2021
- All-time low (ATL): $0.00923681 reached on October 31, 2017
- Peak-to-current decline: Approximately 97.3% from ATH
Comparative Analysis: Both assets experienced significant valuations during the 2021 bull market cycle, with MANA reaching substantially higher absolute prices ($5.85) compared to JST ($0.193254). However, both have undergone substantial corrections from their peaks. JST has maintained relatively greater price stability relative to its historical highs compared to MANA's sharper decline. The divergence reflects different market dynamics: JST as a DeFi governance token on TRON, versus MANA as a metaverse utility token on Ethereum.
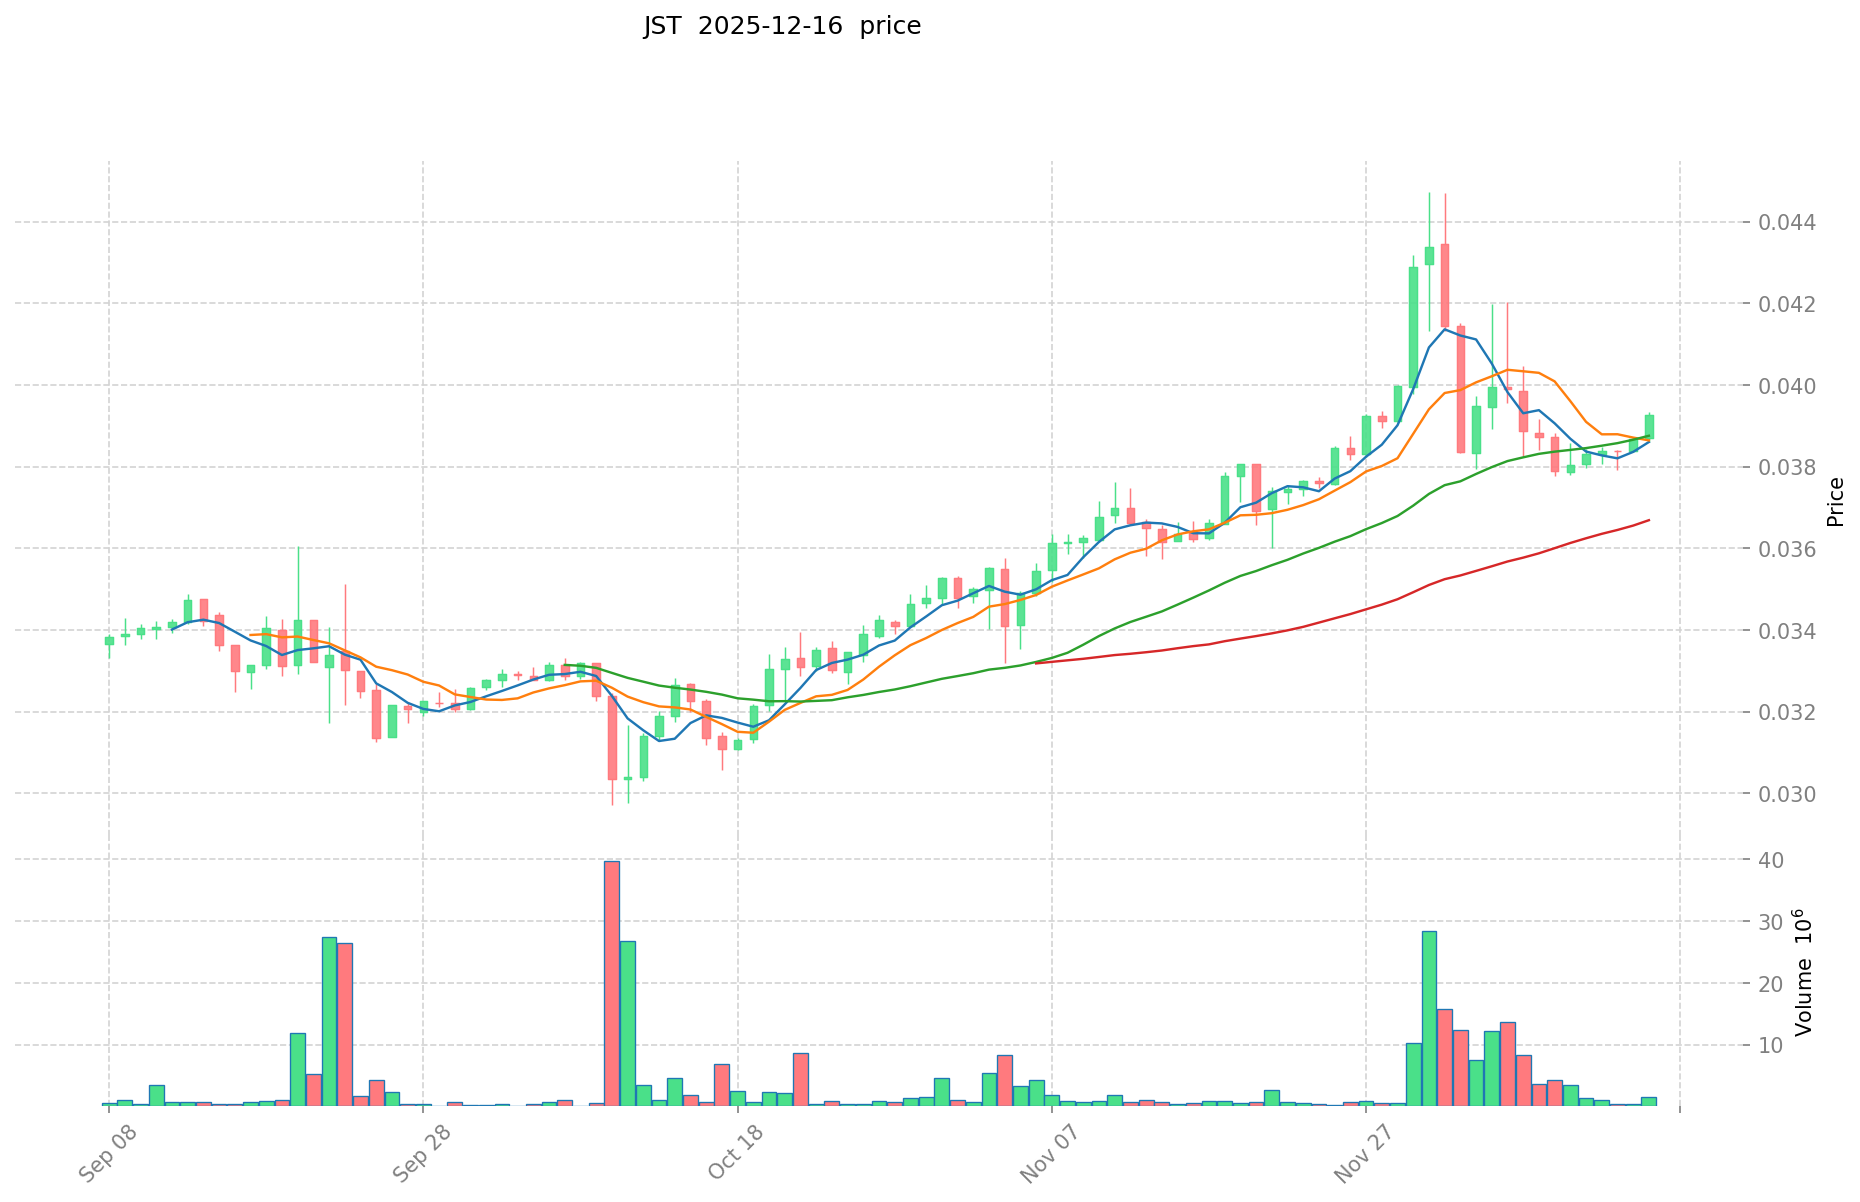
Current Market Status (December 16, 2025)
Price Data:
- JST current price: $0.03978
- MANA current price: $0.1329
24-Hour Trading Metrics:
- JST 24-hour volume: $55,408.63 USD
- MANA 24-hour volume: $120,791.42 USD
- MANA demonstrates 2.18x higher trading volume than JST
Price Movement Analysis:
- JST 24-hour change: +2.57%
- MANA 24-hour change: -5.94%
- 7-day performance: JST +2.74% vs MANA -11.58%
- 30-day performance: JST +9.26% vs MANA -35.69%
- 1-year performance: JST -10.34% vs MANA -79.00%
Market Capitalization:
- JST market cap: $393,822,000 (Rank #146)
- MANA market cap: $291,473,533 (Rank #196)
- JST maintains approximately 35% higher market capitalization despite lower current price, reflecting its larger circulating supply (9.9B vs 1.92B)
Market Sentiment Indicator (Fear & Greed Index): 11 (Extreme Fear)
Current market conditions reflect extreme fear sentiment across the cryptocurrency market, indicating heightened risk aversion among market participants.
II. Project Overview and Ecosystem Analysis
JST (Just) - DeFi Ecosystem on TRON
Core Objectives: Just aims to establish a fair decentralized financial system providing stable coin lending and governance mechanisms for global users.
Dual Token System:
- JST Token: Governance token of the ecosystem, enabling community participation in fair governance mechanisms and payment of CDP borrowing stabilization fees
- USDJ Token: Stablecoin pegged 1:1 to the US dollar, generated by pledging TRX on the Just CDP lending platform
Key Features:
- Built on TRON blockchain, leveraging the largest decentralized application ecosystem
- All transactions, collateralization, and governance operations are transparent and conducted on-chain
- Low barrier to entry and high transparency for global users
- Governance token holders participate in protocol decision-making
Network Details:
- Contract address (TRON): TCFLL5dx5ZJdKnWuesXxi1VPwjLVmWZZy9
- Total supply: 9,900,000,000 JST
- Circulating supply: 9,900,000,000 JST (100% circulating)
- Current holders: 440,804
MANA (Decentraland) - Virtual World Platform
Core Objectives: Decentraland operates as a blockchain-based virtual world platform designed to eliminate intermediary platform profit extraction from decentralized open-source projects, establishing direct payment models between content creators and platform users.
Economic Model:
- Utilizes blockchain technology to acquire and transfer virtual property rights
- Enables permanent user ownership of virtual property with operational capabilities
- Users can monetize content creation without intermediary fees
- Decentralization of platform governance and revenue distribution
Key Features:
- Elimination of intermediary fee structures (primary differentiator)
- Permanent, verifiable virtual property ownership on blockchain
- Direct content creator-to-user economic relationships
- Cross-platform asset portability through blockchain technology
Network Details:
- Contract address (Ethereum): 0x0F5D2fB29fb7d3CFeE444a200298f468908cC942
- Total supply: 2,193,179,327 MANA (unlimited maximum supply)
- Circulating supply: 1,919,121,144 MANA (87.5% circulating ratio)
- Current holders: 288,185
III. Market Position and Comparative Metrics
Ranking and Market Share
| Metric | JST | MANA |
|---|---|---|
| CoinMarketCap Ranking | #146 | #196 |
| Market Share | 0.012% | 0.0092% |
| Market Cap vs FDV | 100% | 87.5% |
JST maintains a stronger market position with higher ranking and greater market share dominance. The 100% market cap to fully diluted valuation ratio for JST indicates all tokens are already in circulation, whereas MANA retains 12.5% of tokens in reserve.
Exchange Availability
- JST: Listed on 33 exchanges
- MANA: Listed on 63 exchanges
MANA demonstrates broader exchange distribution, facilitating greater trading accessibility despite lower overall market capitalization.
IV. Technical and Operational Characteristics
Supply Mechanics
JST:
- Fixed supply: 9,900,000,000 tokens
- Fully circulated: All tokens in active circulation
- No inflation mechanism or additional supply expansion planned
MANA:
- Total supply: 2,193,179,327 tokens
- Circulating: 1,919,121,144 tokens
- Maximum supply: Unlimited (flexible issuance model)
- Reserve allocation: ~274M tokens (~12.5%)
Community Engagement
JST Community Size: 440,804 holders MANA Community Size: 288,185 holders
JST demonstrates 53% larger holder base relative to MANA, suggesting broader community participation despite lower individual token values.
Information Resources
JST Official Channels:
- Website: https://www.just.network/
- White paper: https://www.just.network/docs/white_paper_en.pdf
- Twitter: https://twitter.com/DeFi_JUST
- Block explorer: https://just.tronscan.org/
MANA Official Channels:
- Website: https://decentraland.org/
- White paper: https://decentraland.org/whitepaper.pdf
- Twitter: https://twitter.com/decentraland
- GitHub repositories: Multiple repositories including marketplace, CLI, and MANA token contract
- Community platforms: Reddit presence at https://www.reddit.com/r/decentraland
V. Risk Considerations and Market Observations
Market Environment: The cryptocurrency market is currently experiencing extreme fear sentiment (Fear & Greed Index: 11), reflecting heightened risk aversion and potential capital flight from digital assets.
Asset-Specific Considerations:
JST Factors:
- Concentrated on single blockchain ecosystem (TRON)
- DeFi protocol dependency on TRX collateralization stability
- Governance token utility directly tied to protocol adoption
- Smaller holder base may indicate higher concentration risk
MANA Factors:
- Metaverse adoption remains uncertain and highly speculative
- 79% decline over past year indicates significant depreciation
- Unlimited supply mechanism may present long-term dilution pressures
- Virtual property market liquidity subject to user adoption metrics
Both assets represent niche sectors within cryptocurrency markets and carry corresponding concentration risks. Historical performance demonstrates significant volatility and downside exposure across both categories.
Report Generated: December 16, 2025
Data Source: GateData Market Information System
Disclaimer: This report provides factual market data and project information without investment recommendations. Cryptocurrency markets remain highly volatile and speculative. All market data subject to real-time updates.

Investment Value Analysis: JST vs MANA
I. Executive Summary
Based on available reference materials, the investment value of JST and MANA tokens is primarily influenced by market volatility, project team credibility, and application scenario development. JST demonstrates value support through data-driven confidence mechanisms, while MANA's valuation depends on its functional utility within the Ethereum network ecosystem.
II. Core Factors Affecting JST vs MANA Investment Value
Tokenomics and Supply Mechanisms
JST: The token's value proposition centers on action-driven confidence reinforcement during bear market conditions, establishing tangible and verifiable value support based on quantifiable data rather than narrative claims.
MANA: Functions as currency, consumable asset, or yield-bearing asset within its ecosystem. Valuation should prioritize functional utility as currency, consumption patterns, and staking mechanisms for yield generation.
Institutional Adoption and Market Application
Institutional Support: JST has attracted institutional backing, with entities such as DWF Labs engaging as primary supporters, indicating institutional recognition of the token's value proposition.
Application Scenarios: MANA's value is driven by real-world applications on the Ethereum network as a transactional currency and commodity, with potential acceleration through staking mechanisms that convert it into yield-bearing assets.
Ecosystem Development
MANA: Application scenario expansion drives MANA's utility as a currency and commodity on Ethereum, with staking enabling conversion to income-generating assets and broader ecosystem participation.
Risk Factors: Both tokens face documented risks including market volatility, token liquidity constraints, smart contract limitations, and challenges inherent to early-stage blockchain ecosystems.
III. Market Context
The broader cryptocurrency market environment includes continuous strength in US equity markets, stable coin fund inflows, and potential bitcoin momentum enhancement through ETF capital flows, which may create conditions affecting altcoin valuations.
IV. Analytical Considerations
Investor confidence fundamentally depends on certainty and verifiable data. Token value assessment should incorporate market cyclical patterns, functional utility metrics, and ecosystem development velocity rather than speculative narratives alone.
Note: Analysis is limited by available reference materials. Comprehensive investment analysis requires additional data on current token metrics, detailed project roadmaps, comparative valuation models, and regulatory developments not fully covered in provided sources.
III. 2025-2030 Price Predictions: JST vs MANA
Short-term Prediction (2025)
- JST: Conservative $0.0329676 - $0.03972 | Optimistic $0.041706
- MANA: Conservative $0.10592 - $0.1324 | Optimistic $0.184036
Medium-term Prediction (2027-2028)
- JST is projected to trade in the $0.0331078116 - $0.0527111211 range, with an anticipated price movement of 9% - 21% from baseline levels
- MANA is projected to trade in the $0.1781139135 - $0.277538974899 range, with an anticipated price movement of 41% - 59% from baseline levels
- Key drivers: institutional capital inflows, ETF approvals, ecosystem development initiatives
Long-term Prediction (2029-2030)
- JST: Base scenario $0.0389909825955 - $0.0524693469495 | Optimistic scenario $0.060339748991925 - $0.073325912361926
- MANA: Base scenario $0.222677358448545 - $0.266723429350455 | Optimistic scenario $0.28874646480141 - $0.306731943753023
Disclaimer: This analysis is based on historical data and market modeling. Price predictions are subject to significant uncertainty and should not be considered investment advice. Cryptocurrency markets are highly volatile and influenced by numerous unpredictable factors. Past performance does not guarantee future results.
JST:
| 年份 | 预测最高价 | 预测平均价格 | 预测最低价 | 涨跌幅 |
|---|---|---|---|---|
| 2025 | 0.041706 | 0.03972 | 0.0329676 | 0 |
| 2026 | 0.04641282 | 0.040713 | 0.03297753 | 2 |
| 2027 | 0.0527111211 | 0.04356291 | 0.0331078116 | 9 |
| 2028 | 0.056801678349 | 0.04813701555 | 0.0389909825955 | 21 |
| 2029 | 0.060339748991925 | 0.0524693469495 | 0.03882731674263 | 31 |
| 2030 | 0.073325912361926 | 0.056404547970712 | 0.049636002214227 | 41 |
MANA:
| 年份 | 预测最高价 | 预测平均价格 | 预测最低价 | 涨跌幅 |
|---|---|---|---|---|
| 2025 | 0.184036 | 0.1324 | 0.10592 | 0 |
| 2026 | 0.21675866 | 0.158218 | 0.1028417 | 19 |
| 2027 | 0.2362352958 | 0.18748833 | 0.1781139135 | 41 |
| 2028 | 0.277538974899 | 0.2118618129 | 0.194912867868 | 59 |
| 2029 | 0.28874646480141 | 0.2447003938995 | 0.222677358448545 | 84 |
| 2030 | 0.306731943753023 | 0.266723429350455 | 0.237383852121904 | 100 |
Comparative Investment Analysis Report: JST vs MANA
I. Investment Strategy Comparison: JST vs MANA
Long-term vs Short-term Investment Strategies
JST: Suitable for investors focused on DeFi governance participation and ecosystem stability within the TRON blockchain environment. Short-term traders may capitalize on 2.57% positive 24-hour momentum and 2.74% weekly gains, while long-term holders should evaluate governance token utility and stablecoin ecosystem adoption metrics.
MANA: Suitable for investors with higher risk tolerance targeting metaverse infrastructure play and virtual property ownership concepts. Despite current 5.94% negative 24-hour performance and 79% annual decline, long-term positioning assumes virtual world adoption acceleration and Ethereum network maturation.
Risk Management and Asset Allocation
Conservative Investor Profile:
- JST: 60% | MANA: 40%
- Rationale: JST's stronger market capitalization ranking (#146 vs #196), higher holder base (440,804 vs 288,185), and full token circulation suggest relatively lower volatility exposure within the altcoin category.
Aggressive Investor Profile:
- JST: 40% | MANA: 60%
- Rationale: MANA's 2.18x higher trading volume enables greater liquidity for tactical positioning, while historical price volatility and speculative upside potential align with aggressive portfolio mandates.
Hedging Instruments:
- Stablecoin allocation: 15-25% portfolio weight during extreme fear market conditions (current Fear & Greed Index: 11)
- Cross-asset diversification: Combine JST/MANA holdings with Bitcoin and Ethereum as portfolio stabilizers
- Options strategy: Consider protective puts on MANA positions given 97.3% ATH decline and unlimited supply mechanism
II. Potential Risk Comparison
Market Risk
JST:
- Heavy dependency on TRON blockchain ecosystem performance; limited diversification across alternative networks
- Governance token value directly correlates with CDP lending platform adoption and USDJ stablecoin demand
- Current extreme fear sentiment (Fear & Greed Index: 11) may suppress community governance participation
MANA:
- Metaverse adoption remains highly speculative with uncertain real-world utility trajectory
- 79% annual decline indicates sustained market skepticism regarding virtual property monetization models
- Unlimited supply mechanism creates potential long-term dilution pressure, particularly if token emissions accelerate
Technology Risk
JST:
- Single-chain deployment concentration creates single-point-of-failure exposure to TRON network degradation
- Smart contract security dependent on TRON ecosystem audit standards and vulnerability management
- CDP collateralization mechanism vulnerable to TRX price volatility and flash loan attack vectors
MANA:
- Ethereum network gas costs directly impact virtual property transaction efficiency and user adoption friction
- Smart contract complexity in virtual property ownership verification and transfer mechanisms
- Scalability limitations on Ethereum Layer 1 may constrain transaction throughput for active virtual world participants
Regulatory Risk
- Both JST and MANA face emerging global cryptocurrency classification frameworks potentially affecting token utility classification (commodity vs security determinations)
- DeFi governance tokens (JST) may encounter enhanced regulatory scrutiny regarding protocol control concentration
- Virtual world platforms (MANA) face uncertain regulatory treatment regarding virtual property rights recognition and tax implications
- TRON blockchain operates in jurisdictions with varying regulatory clarity, potentially affecting JST ecosystem operations
- Ethereum-based tokens benefit from more established regulatory frameworks in major jurisdictions but remain subject to evolving standards
III. Conclusion: Which Is the Better Buy?
📌 Investment Value Summary
JST Advantages:
- Higher market capitalization rank (#146) indicating stronger established market position
- 100% circulating supply eliminates dilution concerns and provides supply certainty
- 53% larger holder base (440,804 vs 288,185) suggests broader community participation
- Recent positive momentum: +2.57% (24-hour), +2.74% (7-day), +9.26% (30-day)
- Institutional backing through DWF Labs demonstrates credibility recognition
MANA Advantages:
- 2.18x higher trading volume ($120,791 vs $55,408) provides superior liquidity for tactical trading
- Broader exchange distribution (63 vs 33 exchanges) facilitates accessibility
- Longer market history (since 2017) demonstrates sustained project continuity
- Medium to long-term price predictions indicate recovery potential: +41% (2027-2028), +100% (2029-2030)
- Metaverse infrastructure positioning aligns with long-term blockchain adoption narratives
✅ Investment Recommendations
Beginner Investors:
- JST represents lower-complexity entry point: DeFi governance mechanics are more transparent than virtual world economics
- Conservative 60% JST / 40% MANA allocation provides sector diversification with risk mitigation
- Begin with positions below 2% portfolio weight given extreme fear market conditions
- Utilize limit orders during high volatility rather than market execution
Experienced Investors:
- JST: Accumulate on dips below $0.0355 for governance token yield potential; monitor USDJ ecosystem metrics and TRX collateral ratios
- MANA: Tactical long positions targeting 41-59% medium-term recovery (2027-2028 range of $0.1781-$0.2775); implement stop-loss at $0.095
- Implement 60/40 aggressive allocation strategy paired with protective put spreads on MANA positions
- Monitor Fear & Greed Index for strategic entry points; current reading of 11 may indicate oversold conditions
Institutional Investors:
- JST: Position as TRON ecosystem exposure within diversified DeFi allocation; monitor governance participation metrics and protocol upgrade timelines
- MANA: Evaluate as speculative infrastructure allocation with 3-5 year horizon; establish positions aligned with metaverse adoption catalysts and institutional adoption timelines
- Utilize OTC trading channels for large position accumulation to minimize market impact
- Structure as part of Web3 infrastructure fund allocation rather than standalone positions
⚠️ Risk Disclosure: Cryptocurrency markets demonstrate extreme volatility with current Fear & Greed Index at 11, indicating heightened risk conditions. Both JST and MANA have experienced substantial declines from all-time highs (JST: 79.4%, MANA: 97.3%), reflecting significant speculative exposure. This analysis presents factual market data and project information without constituting investment advice. Digital asset investments carry substantial capital loss risk. All market data subject to real-time updates and material changes in market conditions.
Report Generated: December 16, 2025
Data Source: GateData Market Information System
Current Market Conditions: Extreme Fear Sentiment (Fear & Greed Index: 11)
None
FAQ: JST vs MANA Cryptocurrency Investment Comparison
I. Which token offers better price stability: JST or MANA?
Answer: JST demonstrates relatively superior price stability compared to MANA. JST has declined 79.4% from its all-time high, whereas MANA has experienced a more severe 97.3% decline from peak levels. Additionally, JST shows positive momentum across multiple timeframes (24-hour: +2.57%, 7-day: +2.74%, 30-day: +9.26%), while MANA displays negative performance across the same periods (24-hour: -5.94%, 7-day: -11.58%, 30-day: -35.69%). For risk-averse investors seeking relative stability within the altcoin category, JST presents a more favorable profile.
II. What is the primary functional difference between JST and MANA tokens?
Answer: JST operates as a governance token for the Just DeFi ecosystem on the TRON blockchain, enabling community participation in protocol decisions and payment of CDP borrowing stabilization fees. MANA functions as the utility token for the Decentraland virtual world platform on Ethereum, serving as the transactional currency for virtual property ownership and monetization. JST derives value from DeFi protocol adoption and USDJ stablecoin demand, while MANA derives value from metaverse ecosystem expansion and virtual property market activity.
III. Which token has better market liquidity and exchange availability?
Answer: MANA demonstrates superior liquidity with 2.18x higher 24-hour trading volume ($120,791.42 vs $55,408.63) and listing on 63 exchanges compared to JST's 33 exchange listings. This broader distribution facilitates easier entry and exit for traders. However, JST maintains a higher market capitalization ranking (#146 vs #196), indicating stronger overall market position despite lower trading volume. For investors prioritizing tactical trading flexibility, MANA offers superior liquidity.
IV. Is JST or MANA better for long-term investment (2029-2030)?
Answer: Price prediction models indicate MANA presents higher long-term recovery potential, with projections of 100% appreciation by 2030 compared to JST's 41% projected appreciation across the same period. However, this increased upside reflects higher speculation risk. JST offers lower-volatility long-term positioning with predictable supply mechanics (100% circulating, fixed 9.9B total supply). MANA carries unlimited supply mechanism risks but stronger metaverse narrative alignment. Conservative long-term investors should favor JST; growth-oriented investors may prioritize MANA despite elevated volatility.
V. What are the primary risks distinguishing JST from MANA?
Answer: JST concentrates ecosystem risk on single-chain TRON blockchain deployment, creating vulnerability to network degradation and CDP collateralization risks tied to TRX price volatility. MANA carries metaverse adoption speculation risk, with uncertain real-world utility trajectory and 79% annual depreciation indicating sustained market skepticism. Additionally, MANA faces long-term dilution pressure from unlimited token supply, whereas JST's fixed supply eliminates inflation concerns. Regulatory risks differ: JST may face DeFi governance scrutiny, while MANA faces uncertain virtual property rights classification across jurisdictions.
VI. Given current market conditions (Fear & Greed Index: 11), which token should I buy now?
Answer: Current extreme fear sentiment (index reading 11) creates potential accumulation opportunities for both tokens, particularly at depressed valuations. JST's recent positive momentum (+2.74% weekly) suggests potential trend reversal and presents entry opportunities below $0.0355 support levels for governance yield positioning. MANA's sustained weakness indicates potential oversold conditions, with medium-term recovery targets at $0.1781-$0.2775 (2027-2028 forecast range) for tactical long positions. Conservative investors should maintain 15-25% stablecoin portfolio allocation before deploying capital during extreme fear periods. Begin with positions below 2% portfolio weight and utilize limit orders rather than market execution.
VII. How do the supply mechanisms of JST and MANA affect long-term investment value?
Answer: JST operates with fixed, fully-circulated supply of 9.9 billion tokens, eliminating future dilution and providing supply certainty that supports long-term value preservation. This mechanism benefits holders through scarcity protection. MANA utilizes flexible issuance with 2.193 billion total supply and 274 million reserve tokens (~12.5%), creating potential dilution pressures if ecosystem governance decides to accelerate token emissions. JST's fixed supply structure provides superior long-term value protection, particularly during bear market conditions when investor confidence depends on verifiable, data-driven fundamentals rather than speculative narratives.
VIII. Should I allocate more portfolio weight to JST or MANA based on my risk profile?
Answer: Portfolio allocation recommendations depend on risk tolerance. Conservative investors should implement 60% JST / 40% MANA allocation, leveraging JST's stronger market position (#146 ranking), larger holder base (440,804 vs 288,185), and positive momentum for stability. Aggressive investors should consider 40% JST / 60% MANA allocation, prioritizing MANA's superior trading volume (2.18x higher), 63 exchange listings (vs 33 for JST), and speculative recovery potential. All allocations should maintain 15-25% stablecoin buffer during current extreme fear conditions. Institutional investors should structure positions within broader web3 infrastructure fund allocations rather than standalone holdings, utilizing OTC channels for large position accumulation.
Report Generated: December 16, 2025
Data Source: GateData Market Information System
Market Conditions: Extreme Fear Sentiment (Fear & Greed Index: 11)
Disclaimer: This FAQ provides factual market analysis without constituting investment advice. Cryptocurrency markets remain highly volatile and speculative. All participants should conduct independent due diligence and consult qualified financial advisors before investment decisions.
Share
How to Buy Cryptocurrency


Trending Cryptocurrencies


XZXX: A Comprehensive Guide to the BRC-20 Meme Token in 2025

Bitcoin Fear and Greed Index: Market Sentiment Analysis for 2025

Top Crypto ETFs to Watch in 2025: Navigating the Digital Asset Boom

5 ways to get Bitcoin for free in 2025: Newbie Guide

Bitcoin Market Cap in 2025: Analysis and Trends for Investors
2025 Bitcoin Price Prediction: Trump's Tariffs' Impact on BTC

Is Undeads Games (UDS) a good investment?: A Comprehensive Analysis of Risk, Potential Returns, and Market Viability

Is BUILDon (B) a good investment?: A Comprehensive Analysis of Performance, Risks, and Future Prospects

Is Vision (VSN) a good investment?: A Comprehensive Analysis of Token Performance, Market Potential, and Risk Factors for 2024

Is Arweave (AR) a good investment?: A Comprehensive Analysis of Risks, Opportunities, and Market Potential in 2024

Is Sonic (S) a good investment?: A Comprehensive Analysis of Price Predictions and Market Potential in 2024