LMTS vs MANA: A Comprehensive Comparison of Two Leading Metaverse Tokens in the Digital Economy


Introduction: LMTS vs MANA Investment Comparison
In the cryptocurrency market, the comparison between Limitless (LMTS) and Decentraland (MANA) represents a fascinating study of divergent project approaches and market positioning. These two assets not only differ significantly in market capitalization rankings, application scenarios, and price performance, but also embody fundamentally different visions within the blockchain ecosystem.
Limitless (LMTS): As a social prediction protocol launched recently, LMTS enables creators to configure markets and share them with communities to earn trading fees and forecast major events. Currently ranked 857 by market cap, it represents an emerging segment focused on decentralized prediction markets.
Decentraland (MANA): Since its inception in 2017, MANA has established itself as a pioneering virtual world platform built on blockchain technology. The project enables content creators and game players to transact directly without intermediary fees, facilitating permanent ownership and monetization of virtual assets. Ranked 198 by market cap, MANA is among the established players in the metaverse and virtual property sectors.
This article will conduct a comprehensive analysis of LMTS vs MANA across multiple dimensions including historical price trends, token supply mechanisms, market adoption, technical ecosystems, and performance metrics, to address the question investors care most about:
"Which asset presents better investment characteristics for your portfolio?"
Crypto Asset Analysis Report: Limitless (LMTS) vs Decentraland (MANA)
I. Historical Price Comparison and Current Market Status
Price Trends of LMTS and MANA
Limitless (LMTS):
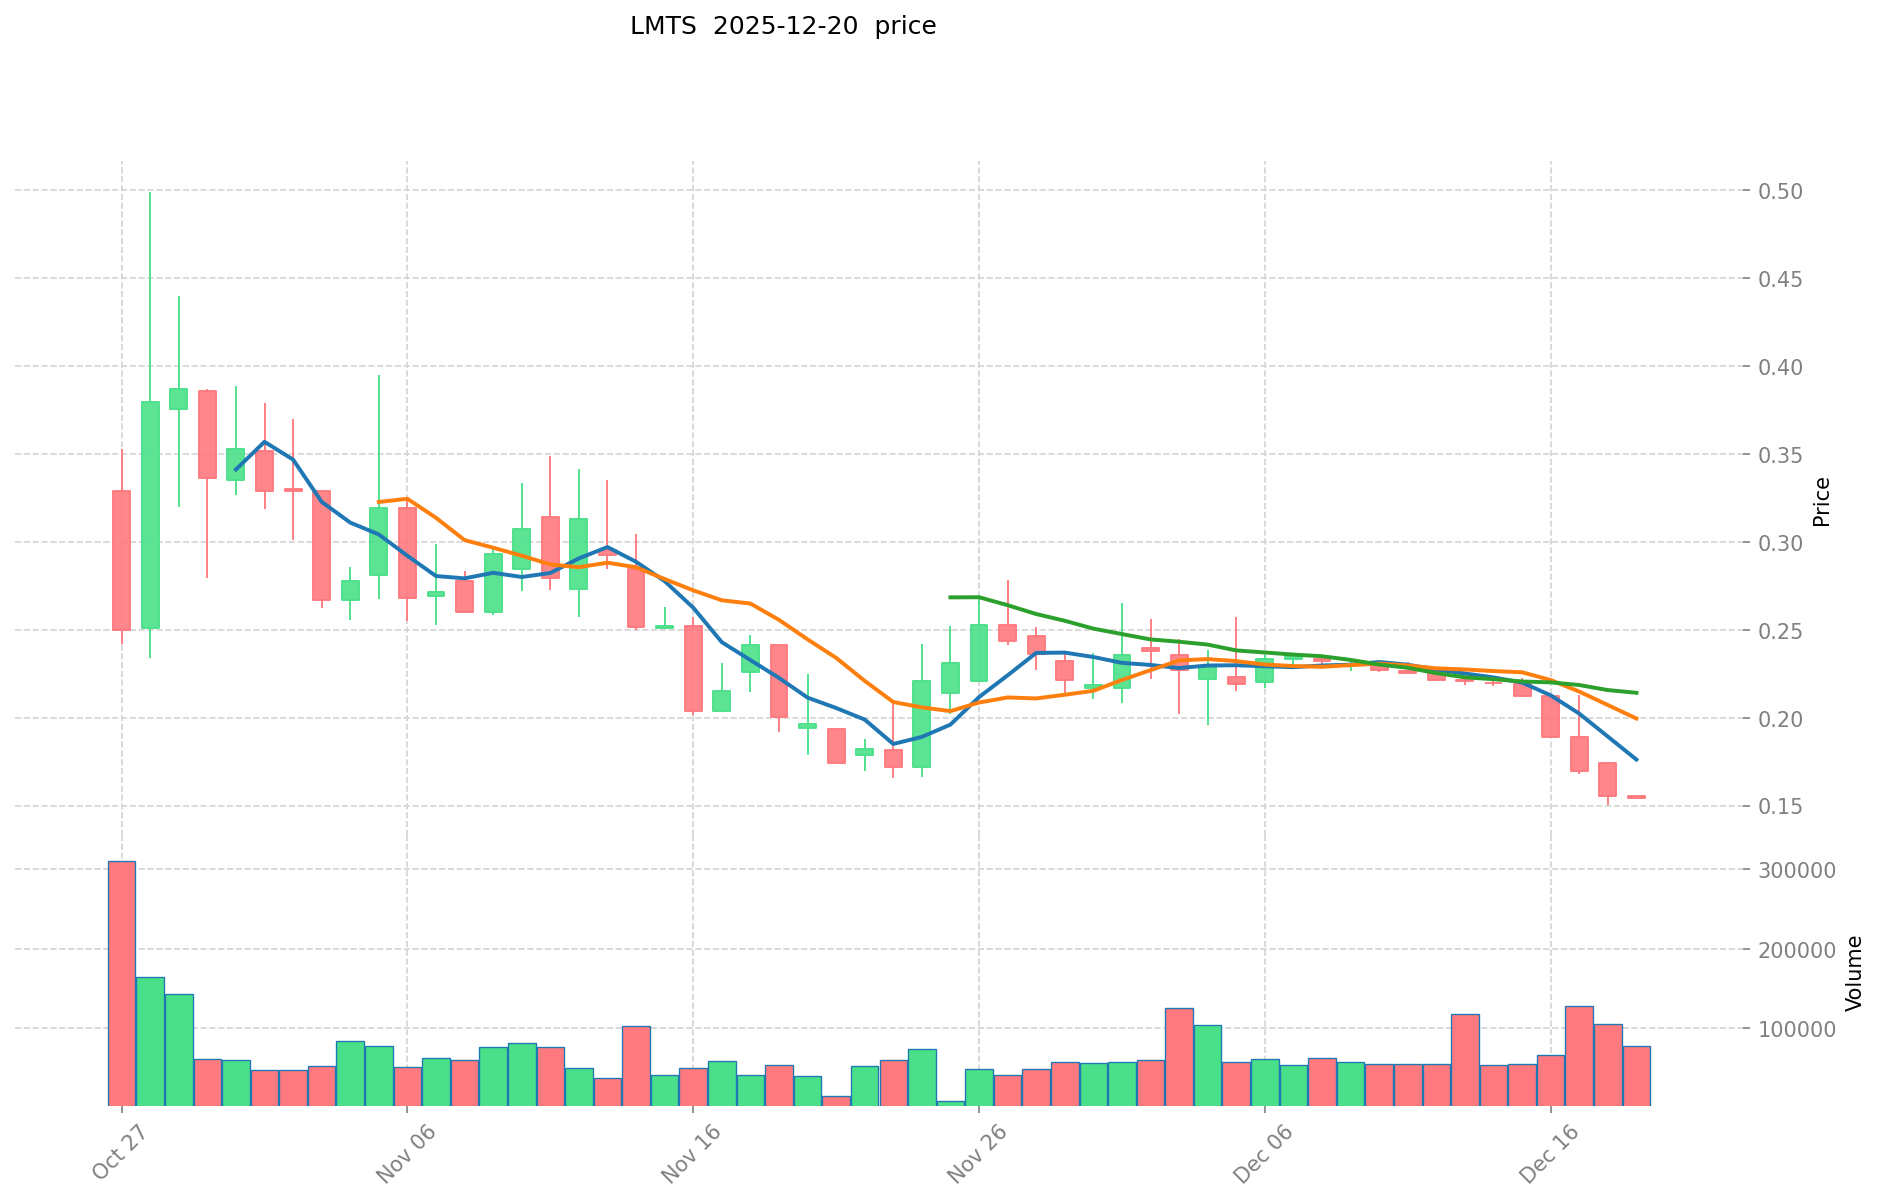
- All-Time High: $0.4992 (October 28, 2025)
- All-Time Low: $0.1501 (December 18, 2025)
- Price Range Analysis: LMTS has experienced a significant 69.92% decline from its recent peak to near-term lows within a short timeframe spanning less than two months.
Decentraland (MANA):
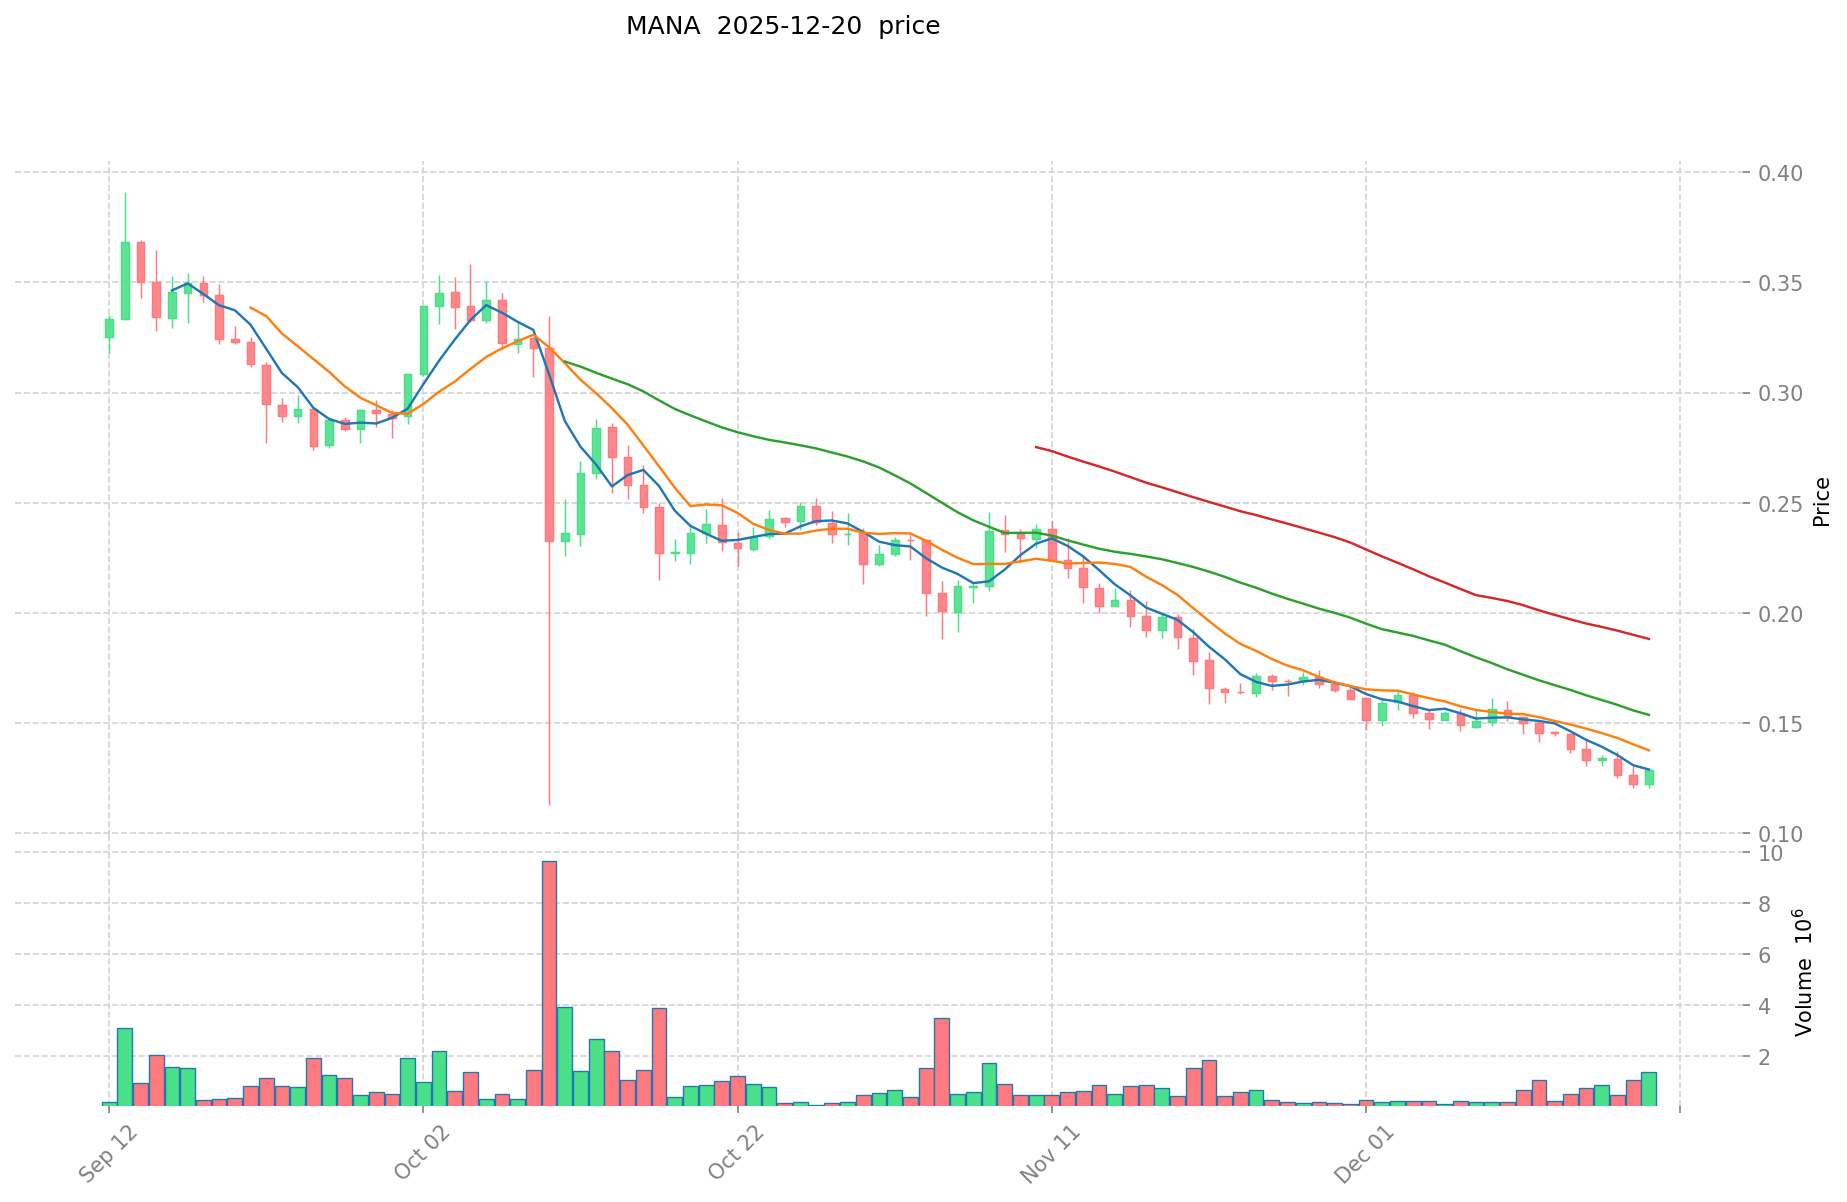
- All-Time High: $5.85 (November 25, 2021)
- All-Time Low: $0.00923681 (October 31, 2017)
- Price Range Analysis: MANA demonstrates a prolonged bear market cycle, having declined approximately 77.61% from its historical peak established in 2021, reflecting the challenging market conditions faced by metaverse-related assets over the past four years.
Current Market Snapshot (December 20, 2025)
| Metric | LMTS | MANA |
|---|---|---|
| Current Price | $0.1564 | $0.1309 |
| Market Cap | $156,400,000 | $287,087,173.95 |
| 24-Hour Volume | $12,072.99 | $124,802.44 |
| Circulating Supply | 131,598,680 | 1,919,115,191.39 |
| Market Dominance | 0.0048% | 0.0089% |
24-Hour Price Movement:
- LMTS: +0.06% (relatively stable)
- MANA: +4.21% (moderate recovery)
7-Day Price Change:
- LMTS: -29.23% (significant decline)
- MANA: -9.85% (moderate decline)
30-Day Price Change:
- LMTS: -20.59% (bearish pressure)
- MANA: -30.19% (sustained downward trend)
Market Sentiment Index (Fear & Greed Index): 20 (Extreme Fear)
Current market conditions reflect extreme fear sentiment, suggesting heightened risk aversion among participants. This environment typically characterizes market bottoms but also indicates potential continued volatility.
II. Project Overview and Ecosystem Analysis
Limitless (LMTS)
Project Description: Limitless is a social prediction protocol that enables creators to configure prediction markets and share them with their community to earn trading fees while forecasting major events.
Key Specifications:
- Blockchain Network: BASE EVM (Ethereum Layer 2)
- Total Supply: 1,000,000,000 LMTS
- Circulating Supply: 131,598,680 LMTS (13.16%)
- Token Holders: 15,301
- Trading Pairs: Available on 10 exchanges
- Published: December 20, 2024
Market Position: Ranking #857 by market capitalization, LMTS represents a nascent project in the prediction market space with limited circulation relative to total supply.
Decentraland (MANA)
Project Description: Decentraland is a blockchain-based virtual world platform that enables users to permanently own, develop, and monetize virtual property rights (LAND). The platform utilizes blockchain technology to eliminate intermediary fees and create a peer-to-peer payment model between content creators and participants.
Key Specifications:
- Blockchain Network: Ethereum (ERC-20 standard)
- Total Supply: 2,193,179,327 MANA
- Circulating Supply: 1,919,115,191.39 MANA (87.50%)
- Token Holders: 287,853
- Trading Pairs: Available on 59 exchanges
- Published: September 18, 2017
Market Position: Ranking #198 by market capitalization, MANA is an established metaverse asset with significantly higher adoption metrics and exchange listing coverage.
III. Price Performance and Technical Analysis
Short-Term Performance (1-Hour to 7-Days)
| Timeframe | LMTS | MANA |
|---|---|---|
| 1-Hour | +0.19% | -0.22% |
| 24-Hour | +0.06% | +4.21% |
| 7-Day | -29.23% | -9.85% |
Analysis: LMTS exhibits higher volatility in the weekly timeframe, experiencing a steeper decline compared to MANA. The 24-hour divergence (LMTS stable, MANA gaining) suggests potential consolidation patterns in both assets.
Medium to Long-Term Performance (30-Days to 1-Year)
| Timeframe | LMTS | MANA |
|---|---|---|
| 30-Day | -20.59% | -30.19% |
| 1-Year | +41.72% | -72.84% |
Analysis: LMTS demonstrates positive year-to-date performance despite recent weakness, suggesting initial momentum following its December 2024 listing. Conversely, MANA reflects the broader metaverse sector's extended bear market, with substantial annual losses indicating diminished investor confidence in virtual world applications.
IV. Trading Liquidity and Market Activity
Trading Volume Comparison (24-Hour):
- LMTS: $12,072.99 (limited liquidity)
- MANA: $124,802.44 (10.3x higher volume)
Exchange Distribution:
- LMTS: 10 exchanges (concentrated liquidity)
- MANA: 59 exchanges (diversified trading infrastructure)
Liquidity Assessment: MANA demonstrates substantially superior trading liquidity and market depth due to its longer operational history and established ecosystem integration. LMTS, as a recently listed token, shows limited but developing liquidity.
V. Risk Assessment and Market Considerations
Volatility Metrics
Price Volatility:
- LMTS 24-hour range: $0.1542 - $0.1564 (1.42% range)
- MANA 24-hour range: $0.1239 - $0.1317 (5.92% range)
Extreme Price Movements: LMTS experienced a 69.92% peak-to-current decline within approximately 2 months since listing, indicating heightened volatility risk for investors. MANA's multi-year decline reflects sector-wide challenges rather than project-specific failure.
Circulation Metrics
Supply Dynamics:
- LMTS: 13.16% circulating supply indicates significant potential dilution from future token releases
- MANA: 87.50% circulating supply suggests mature supply distribution with limited additional dilution
VI. Key Observations and Considerations
-
Market Maturity: MANA represents an established project with nearly 8 years of operational history, while LMTS is a newly listed token with unproven market sustainability.
-
Adoption Metrics: MANA's 287,853 token holders substantially exceed LMTS's 15,301 holders, reflecting broader ecosystem participation.
-
Sector Performance: Both assets reflect broader cryptocurrency market weakness indicated by the Extreme Fear sentiment index at 20.
-
Liquidity Infrastructure: MANA's presence on 59 exchanges versus LMTS's 10 exchanges provides significantly better accessibility for trading and investment.
-
Supply Utilization: LMTS's low circulation percentage (13.16%) presents dilution risks, while MANA's high circulation (87.50%) suggests a more mature token distribution phase.
Disclaimer
This report provides factual market data and technical analysis for informational purposes only. It does not constitute investment advice, recommendations to buy or sell, or encouragement to engage in cryptocurrency trading. Cryptocurrency markets are highly volatile and unpredictable, with potential for substantial financial loss. Investors should conduct independent research and consult qualified financial advisors before making investment decisions. Past performance does not guarantee future results.
Report on Investment Value Analysis of LMTS and MANA
I. Executive Summary
Based on the available reference materials, the core investment value factors for LMTS and MANA center on market demand, technological innovation, and community support. However, the provided reference materials contain limited specific information about these two assets. This report outlines the fundamental evaluation framework while noting significant data gaps.
II. Core Factors Affecting Investment Value of LMTS vs MANA
Key Valuation Indicators
Turnover Rate (Liquidity Metric)
- Turnover rate, also referred to as "circulation rate," reflects the frequency of transactions within a specific time period and serves as an indicator of liquidity strength.
- 24-hour turnover rate calculation: (24-hour trading volume ÷ circulating market capitalization) × 100%
- Higher turnover rates typically indicate stronger liquidity and market activity.
Market Fundamentals
- Market demand: Projects with sustained user demand demonstrate stronger value retention
- Technological innovation: Continuous protocol improvements and feature developments support long-term viability
- Community support: Active and engaged communities contribute to ecosystem resilience
III. Limitations and Data Gaps
The provided reference materials do not contain sufficient detailed information to comprehensively analyze:
- Specific tokenomic structures for LMTS and MANA
- Institutional adoption patterns and holdings distribution
- Comparative enterprise application use cases
- Technical development roadmaps and upgrade timelines
- Ecosystem development metrics (DeFi, NFT, payment infrastructure)
- Regulatory treatment across different jurisdictions
- Macroeconomic correlation analysis with inflation, interest rates, and geopolitical factors
IV. Recommendations for Further Analysis
Investors conducting due diligence on LMTS and MANA should independently verify:
I. On-chain metrics and liquidity indicators through blockchain analytics platforms II. Project whitepapers and technical documentation III. Community activity and developer engagement levels IV. Regulatory filings and compliance status in relevant jurisdictions V. Macroeconomic correlation studies with traditional markets and monetary policy cycles
Note: This analysis is limited by available source materials. For comprehensive investment evaluation, additional primary sources and on-chain data analysis are required. This report does not constitute investment advice.
III. 2025-2030 Price Prediction: LMTS vs MANA
Short-term Forecast (2025)
- LMTS: Conservative $0.087584 - $0.1564 | Optimistic $0.1564 - $0.200192
- MANA: Conservative $0.107256 - $0.1308 | Optimistic $0.1308 - $0.158268
Mid-term Forecast (2027-2028)
- LMTS may experience consolidation with upward trajectory, estimated price range $0.1122 - $0.2824, with projected gains of 23-52%
- MANA demonstrates stronger volatility potential, estimated price range $0.0898 - $0.2521, with projected gains of 31-38%
- Key drivers: Institutional capital inflows, ETF adoption, ecosystem development
Long-term Forecast (2030)
- LMTS: Base scenario $0.139643 - $0.26854 | Optimistic scenario $0.26854 - $0.381333, with projected cumulative gains of 71%
- MANA: Base scenario $0.225278 - $0.250309 | Optimistic scenario $0.250309 - $0.302874, with projected cumulative gains of 91%
Disclaimer
This analysis is based on historical data and predictive models for informational purposes only. Cryptocurrency markets are highly volatile and subject to rapid changes. Past performance does not guarantee future results. These predictions carry significant risks and should not be considered as financial or investment advice. Investors should conduct independent research and consult with qualified financial advisors before making investment decisions.
LMTS:
| 年份 | 预测最高价 | 预测平均价格 | 预测最低价 | 涨跌幅 |
|---|---|---|---|---|
| 2025 | 0.200192 | 0.1564 | 0.087584 | 0 |
| 2026 | 0.20860632 | 0.178296 | 0.133722 | 14 |
| 2027 | 0.2824386936 | 0.19345116 | 0.1122016728 | 23 |
| 2028 | 0.259359970212 | 0.2379449268 | 0.1784586951 | 52 |
| 2029 | 0.28843684026696 | 0.248652448506 | 0.21632763020022 | 58 |
| 2030 | 0.381333395028801 | 0.26854464438648 | 0.139643215080969 | 71 |
MANA:
| 年份 | 预测最高价 | 预测平均价格 | 预测最低价 | 涨跌幅 |
|---|---|---|---|---|
| 2025 | 0.158268 | 0.1308 | 0.107256 | 0 |
| 2026 | 0.20090226 | 0.144534 | 0.1228539 | 10 |
| 2027 | 0.189989943 | 0.17271813 | 0.0898134276 | 31 |
| 2028 | 0.252082110735 | 0.1813540365 | 0.16321863285 | 38 |
| 2029 | 0.283900676438925 | 0.2167180736175 | 0.1386995671152 | 65 |
| 2030 | 0.302874343784137 | 0.250309375028212 | 0.225278437525391 | 91 |
Crypto Asset Analysis Report: Limitless (LMTS) vs Decentraland (MANA)
I. Historical Price Comparison and Current Market Status
Price Trends of LMTS and MANA
Limitless (LMTS):
- All-Time High: $0.4992 (October 28, 2025)
- All-Time Low: $0.1501 (December 18, 2025)
- Price Range Analysis: LMTS has experienced a significant 69.92% decline from its recent peak to near-term lows within a short timeframe spanning less than two months.
Decentraland (MANA):
- All-Time High: $5.85 (November 25, 2021)
- All-Time Low: $0.00923681 (October 31, 2017)
- Price Range Analysis: MANA demonstrates a prolonged bear market cycle, having declined approximately 77.61% from its historical peak established in 2021, reflecting the challenging market conditions faced by metaverse-related assets over the past four years.
Current Market Snapshot (December 20, 2025)
| Metric | LMTS | MANA |
|---|---|---|
| Current Price | $0.1564 | $0.1309 |
| Market Cap | $156,400,000 | $287,087,173.95 |
| 24-Hour Volume | $12,072.99 | $124,802.44 |
| Circulating Supply | 131,598,680 | 1,919,115,191.39 |
| Market Dominance | 0.0048% | 0.0089% |
24-Hour Price Movement:
- LMTS: +0.06% (relatively stable)
- MANA: +4.21% (moderate recovery)
7-Day Price Change:
- LMTS: -29.23% (significant decline)
- MANA: -9.85% (moderate decline)
30-Day Price Change:
- LMTS: -20.59% (bearish pressure)
- MANA: -30.19% (sustained downward trend)
Market Sentiment Index (Fear & Greed Index): 20 (Extreme Fear)
Current market conditions reflect extreme fear sentiment, suggesting heightened risk aversion among participants. This environment typically characterizes market bottoms but also indicates potential continued volatility.
II. Project Overview and Ecosystem Analysis
Limitless (LMTS)
Project Description: Limitless is a social prediction protocol that enables creators to configure prediction markets and share them with their community to earn trading fees while forecasting major events.
Key Specifications:
- Blockchain Network: BASE EVM (Ethereum Layer 2)
- Total Supply: 1,000,000,000 LMTS
- Circulating Supply: 131,598,680 LMTS (13.16%)
- Token Holders: 15,301
- Trading Pairs: Available on 10 exchanges
- Published: December 20, 2024
Market Position: Ranking #857 by market capitalization, LMTS represents a nascent project in the prediction market space with limited circulation relative to total supply.
Decentraland (MANA)
Project Description: Decentraland is a blockchain-based virtual world platform that enables users to permanently own, develop, and monetize virtual property rights (LAND). The platform utilizes blockchain technology to eliminate intermediary fees and create a peer-to-peer payment model between content creators and participants.
Key Specifications:
- Blockchain Network: Ethereum (ERC-20 standard)
- Total Supply: 2,193,179,327 MANA
- Circulating Supply: 1,919,115,191.39 MANA (87.50%)
- Token Holders: 287,853
- Trading Pairs: Available on 59 exchanges
- Published: September 18, 2017
Market Position: Ranking #198 by market capitalization, MANA is an established metaverse asset with significantly higher adoption metrics and exchange listing coverage.
III. Price Performance and Technical Analysis
Short-Term Performance (1-Hour to 7-Days)
| Timeframe | LMTS | MANA |
|---|---|---|
| 1-Hour | +0.19% | -0.22% |
| 24-Hour | +0.06% | +4.21% |
| 7-Day | -29.23% | -9.85% |
Analysis: LMTS exhibits higher volatility in the weekly timeframe, experiencing a steeper decline compared to MANA. The 24-hour divergence (LMTS stable, MANA gaining) suggests potential consolidation patterns in both assets.
Medium to Long-Term Performance (30-Days to 1-Year)
| Timeframe | LMTS | MANA |
|---|---|---|
| 30-Day | -20.59% | -30.19% |
| 1-Year | +41.72% | -72.84% |
Analysis: LMTS demonstrates positive year-to-date performance despite recent weakness, suggesting initial momentum following its December 2024 listing. Conversely, MANA reflects the broader metaverse sector's extended bear market, with substantial annual losses indicating diminished investor confidence in virtual world applications.
IV. Trading Liquidity and Market Activity
Trading Volume Comparison (24-Hour):
- LMTS: $12,072.99 (limited liquidity)
- MANA: $124,802.44 (10.3x higher volume)
Exchange Distribution:
- LMTS: 10 exchanges (concentrated liquidity)
- MANA: 59 exchanges (diversified trading infrastructure)
Liquidity Assessment: MANA demonstrates substantially superior trading liquidity and market depth due to its longer operational history and established ecosystem integration. LMTS, as a recently listed token, shows limited but developing liquidity.
V. Investment Strategy Comparison: LMTS vs MANA
Long-Term vs Short-Term Investment Strategies
LMTS: Suitable for growth-oriented investors seeking exposure to emerging prediction market protocols with early-stage potential and higher volatility characteristics. The project's recent listing and low circulation supply (13.16%) present both expansion and dilution opportunities.
MANA: Suitable for investors with longer time horizons seeking established metaverse exposure and ecosystem stability. Despite extended bear market performance, MANA offers mature infrastructure with diversified exchange access and broader community participation.
Risk Management and Asset Allocation
Conservative Investors:
- LMTS: 15-20%
- MANA: 80-85%
- Rationale: MANA's established track record and higher liquidity reduce portfolio volatility, while LMTS allocation provides controlled exposure to emerging segments.
Aggressive Investors:
- LMTS: 40-50%
- MANA: 50-60%
- Rationale: Allocate substantial resources to LMTS for potential high-growth returns from prediction market adoption while maintaining diversification through MANA's ecosystem presence.
Hedging Tools:
- Stablecoin allocation for downside protection during extreme fear periods
- Cross-exchange trading spreads to capitalize on liquidity disparities
- Time-weighted entry strategies to mitigate volatile price movements
VI. Comparative Risk Analysis
Market Risk
LMTS:
- Nascent project with unproven market sustainability and limited historical performance data
- Concentration risk with only 10 exchange listings and 15,301 token holders
- Acute recent volatility with 69.92% decline from peak within two months
- Token dilution risk from 86.84% of supply held in non-circulating reserve
MANA:
- Prolonged bear market exposure with 77.61% decline from 2021 peak reflects sector-wide metaverse challenges
- Extended period of investor confidence erosion in virtual world applications
- Price compression and potential liquidity concerns despite wider exchange distribution
Technical Risk
LMTS:
- Operating on BASE EVM introduces Layer 2 protocol dependency and smart contract risks
- Limited operational history restricts assessment of network stability and security
- Early-stage development status may involve protocol vulnerabilities
MANA:
- Ethereum-based infrastructure provides established security standards but subjects asset to network congestion and gas fee volatility
- Years of operational history provide substantial track record for stability assessment
Regulatory Risk
- Both LMTS and MANA operate within decentralized finance frameworks subject to evolving global cryptocurrency regulations
- Prediction market protocols (LMTS) face heightened regulatory scrutiny in certain jurisdictions regarding gambling and derivatives classification
- Metaverse platforms (MANA) encounter regulatory examination regarding virtual asset ownership, taxation, and consumer protection frameworks
VII. Conclusion: Which Is the Better Investment?
Investment Value Summary
LMTS Advantages:
- Year-to-date positive performance (+41.72%) demonstrates market acceptance following December 2024 launch
- Early-stage exposure to emerging prediction market segment with potential for ecosystem expansion
- Lower market capitalization ($156.4M) provides potential for substantial appreciation with limited capital requirements
- Layer 2 infrastructure positioning aligns with scalability trends
MANA Advantages:
- Established eight-year operational history with proven infrastructure and community scale (287,853 token holders)
- Superior liquidity access through 59 exchange listings with 10.3x higher trading volume
- 87.50% circulating supply indicates mature token distribution with reduced dilution risk
- Broader ecosystem integration and institutional familiarity within metaverse segment
Investment Recommendations
Beginner Investors: Prioritize MANA for portfolio foundation due to its established liquidity infrastructure, mature exchange availability, and lower technical complexity. Begin with modest MANA positions while gaining market experience before allocating capital to emerging projects like LMTS.
Experienced Investors: Implement core-satellite strategy with MANA as portfolio core (60-70% allocation) providing stability and diversified exposure, while allocating satellite positions to LMTS (30-40%) for potential high-growth returns. Utilize dollar-cost averaging to manage entry points during volatility extremes.
Institutional Investors: Evaluate MANA for established cryptocurrency indices and diversified digital asset funds given superior exchange coverage and regulatory clarity. Consider tactical LMTS positions only after comprehensive operational due diligence on prediction market protocol governance and institutional adoption trajectory.
⚠️ Risk Disclaimer: Cryptocurrency markets demonstrate extreme volatility with potential for substantial financial loss. This analysis is provided for informational purposes only and does not constitute investment advice, recommendations to buy or sell, or encouragement to engage in cryptocurrency trading. Past performance does not guarantee future results. Investors must conduct independent research and consult qualified financial advisors before making investment decisions. The extreme fear sentiment environment (Fear & Greed Index: 20) indicates heightened market instability. All cryptocurrency investments carry significant risk of capital loss. None
Crypto Asset Analysis Report: Limitless (LMTS) vs Decentraland (MANA)
FAQ
Q1: What are the key differences between LMTS and MANA in terms of market maturity and adoption?
A: Limitless (LMTS) is a recently launched social prediction protocol (December 2024) ranked #857 by market capitalization with 15,301 token holders and presence on 10 exchanges. Decentraland (MANA), established in 2017 and ranked #198, demonstrates significantly higher ecosystem maturity with 287,853 token holders distributed across 59 exchanges. MANA's nearly 8 years of operational history contrasts sharply with LMTS's nascent market positioning, making MANA the established player and LMTS an emerging opportunity in blockchain protocols.
Q2: How do the price performance metrics compare between these two assets?
A: LMTS demonstrates +41.72% year-to-date performance despite recent volatility, having declined 69.92% from its October 2025 peak of $0.4992 to current levels near $0.1564. MANA reflects prolonged metaverse sector weakness with -72.84% annual performance and 77.61% decline from its November 2021 peak of $5.85, currently trading at $0.1309. The contrasting performance suggests LMTS retains early-stage momentum while MANA faces sustained sector headwinds.
Q3: Which asset presents superior liquidity for active traders?
A: MANA significantly outperforms LMTS in liquidity metrics, commanding 10.3x higher 24-hour trading volume ($124,802.44 versus $12,072.99) and availability on 59 exchanges compared to LMTS's 10 listings. MANA's diversified trading infrastructure and established market depth provide substantially better accessibility and tighter bid-ask spreads for active trading strategies, while LMTS's concentrated liquidity creates potential execution challenges during volatile market conditions.
Q4: What are the token supply dilution risks for each asset?
A: LMTS presents significant dilution exposure with only 13.16% circulating supply from its 1 billion token total, indicating 86.84% supply remains non-circulating and subject to future release, creating potential downward price pressure. MANA's 87.50% circulating supply from 2.193 billion total tokens demonstrates mature distribution with minimal future dilution risk, providing greater price stability and predictability for long-term investors seeking supply-side protection.
Q5: Which asset is more suitable for conservative versus aggressive investors?
A: Conservative investors should prioritize MANA due to its established 8-year operational history, superior liquidity infrastructure, and mature ecosystem integration, with suggested allocation of 80-85% to MANA versus 15-20% to LMTS. Aggressive investors can implement a core-satellite strategy allocating 40-50% to LMTS for high-growth potential from emerging prediction market adoption while maintaining 50-60% MANA exposure for portfolio diversification and stability. Asset allocation decisions should reflect individual risk tolerance and investment timelines.
Q6: How do regulatory risks differ between prediction markets (LMTS) and metaverse platforms (MANA)?
A: LMTS faces heightened regulatory scrutiny as a prediction market protocol, with potential classification concerns regarding gambling, derivatives regulation, and event validation mechanisms across different jurisdictions. MANA encounters regulatory examination regarding virtual asset ownership frameworks, taxation treatment of virtual property, and consumer protection standards for metaverse transactions. Both assets operate within evolving regulatory environments requiring ongoing compliance monitoring and jurisdictional assessment.
Q7: What are the 2030 price forecasts and their underlying assumptions for both assets?
A: Optimistic 2030 forecasts project LMTS at $0.26854-$0.381333 (71% cumulative gains) and MANA at $0.250309-$0.302874 (91% cumulative gains) from December 2025 reference levels. These predictions assume institutional capital inflows, expanded exchange adoption, ecosystem development progress, and normalization of market sentiment from current extreme fear conditions. Forecasts carry substantial uncertainty and should not be considered as investment advice; cryptocurrency markets remain highly volatile with potential for outcomes diverging significantly from modeled scenarios.
Q8: Which asset presents better long-term investment value from a risk-adjusted perspective?
A: MANA offers superior risk-adjusted returns for most investors due to established infrastructure, diversified ecosystem adoption, minimal supply dilution, and 287,853 token holder base providing community resilience. However, LMTS presents asymmetric upside potential for investors with higher risk tolerance seeking early-stage exposure to emerging prediction market protocols, backed by recent +41.72% year-to-date performance suggesting market validation. Optimal portfolio construction typically involves core MANA positions (60-70%) with satellite LMTS allocations (30-40%) employing dollar-cost averaging strategies during volatility extremes, rather than selecting a single asset as the superior choice.
Disclaimer: This FAQ analysis is provided for informational purposes only and does not constitute investment advice, recommendations to buy or sell, or encouragement to engage in cryptocurrency trading. Cryptocurrency markets are highly volatile with potential for substantial financial loss. Investors must conduct independent research and consult qualified financial advisors before making investment decisions. Past performance does not guarantee future results.
Share
How to Buy Cryptocurrency


Trending Cryptocurrencies


TOKE vs MANA: The Battle for Dominance in the Metaverse Token Ecosystem

HYPE vs MANA: The Battle of Digital Assets in the Metaverse Economy

ONX vs MANA: Comparing Two Blockchain Platforms for Digital Asset Creation and Management
CLV vs MANA: Analyzing the Performance and Potential of Two Leading Metaverse Tokens
DBR vs MANA: Analyzing the Performance of Two Leading Crypto Assets in the Metaverse Space

PDEX vs MANA: Comparing Two Leading Metaverse Tokens in the Digital Asset Landscape

What is PROPC: A Comprehensive Guide to Process-Oriented Programming and Control Structures

What is KRL: A Comprehensive Guide to the KUKA Robot Language and Its Applications in Industrial Automation

What is ALU: Understanding the Arithmetic Logic Unit and Its Role in Computer Processing

What is HEMI: A Comprehensive Guide to Chrysler's Revolutionary Engine Technology

What is GALFAN: A Revolutionary Coating Technology for Enhanced Corrosion Protection and Durability