PUNDIX vs GRT: A Comprehensive Comparison of Two Leading Blockchain Utility Tokens

Introduction: PUNDIX vs GRT Investment Comparison
In the cryptocurrency market, the comparison between PUNDIX and GRT is a topic that investors cannot avoid. The two not only show significant differences in market cap ranking, application scenarios, and price performance, but also represent different positioning in the crypto asset landscape.
PUNDIX (PUNDIX): Since its launch, it has gained market recognition by simplifying cryptocurrency usage in daily life, enabling users to buy and use crypto anytime, anywhere through a decentralized offline payment network powered by XPOS devices deployed across more than 25 countries globally.
GRT (GRT): Since its inception, it has established itself as a decentralized protocol for indexing and querying blockchain data on Ethereum, serving as critical infrastructure that enables anyone to build and publish open APIs (subgraphs) for easy data access.
This article will provide a comprehensive analysis of the investment value comparison between PUNDIX and GRT across historical price trends, supply mechanisms, market adoption, and technical ecosystems, while attempting to answer the question investors care about most:
"Which is the better buy right now?"
Comparative Analysis Report: PUNDIX vs The Graph (GRT)
I. Historical Price Comparison and Current Market Status
PUNDIX and GRT Historical Price Trends
PUNDIX (Pundi X):
- March 31, 2021: Reached all-time high of $10.07 following token migration from NPXS to PUNDIX with 1000:1 token reduction
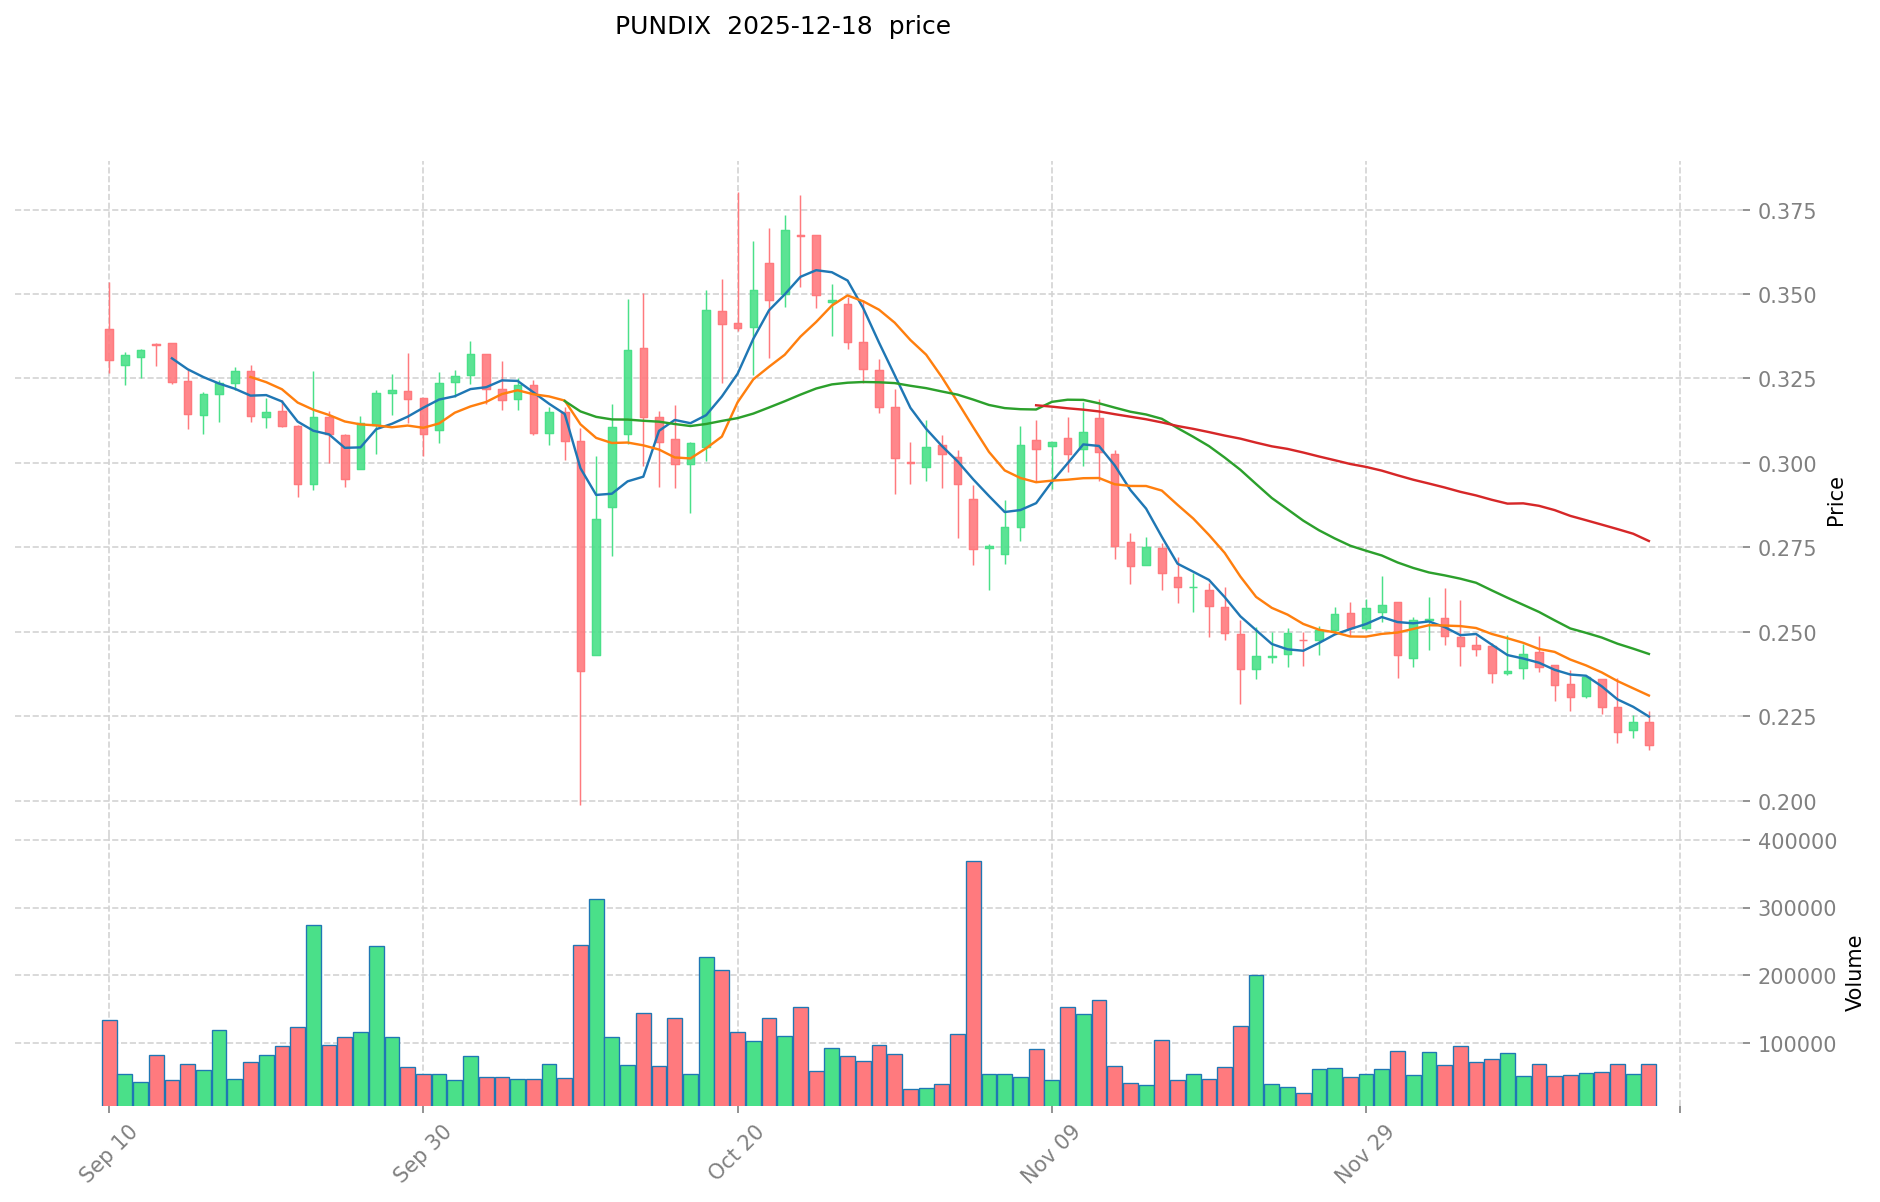
- October 11, 2025: Hit all-time low of $0.212924
- Price trajectory: Declined from $10.07 to current levels, representing a 99.78% decrease from peak
The Graph (GRT):
- February 12, 2021: Reached all-time high of $2.84
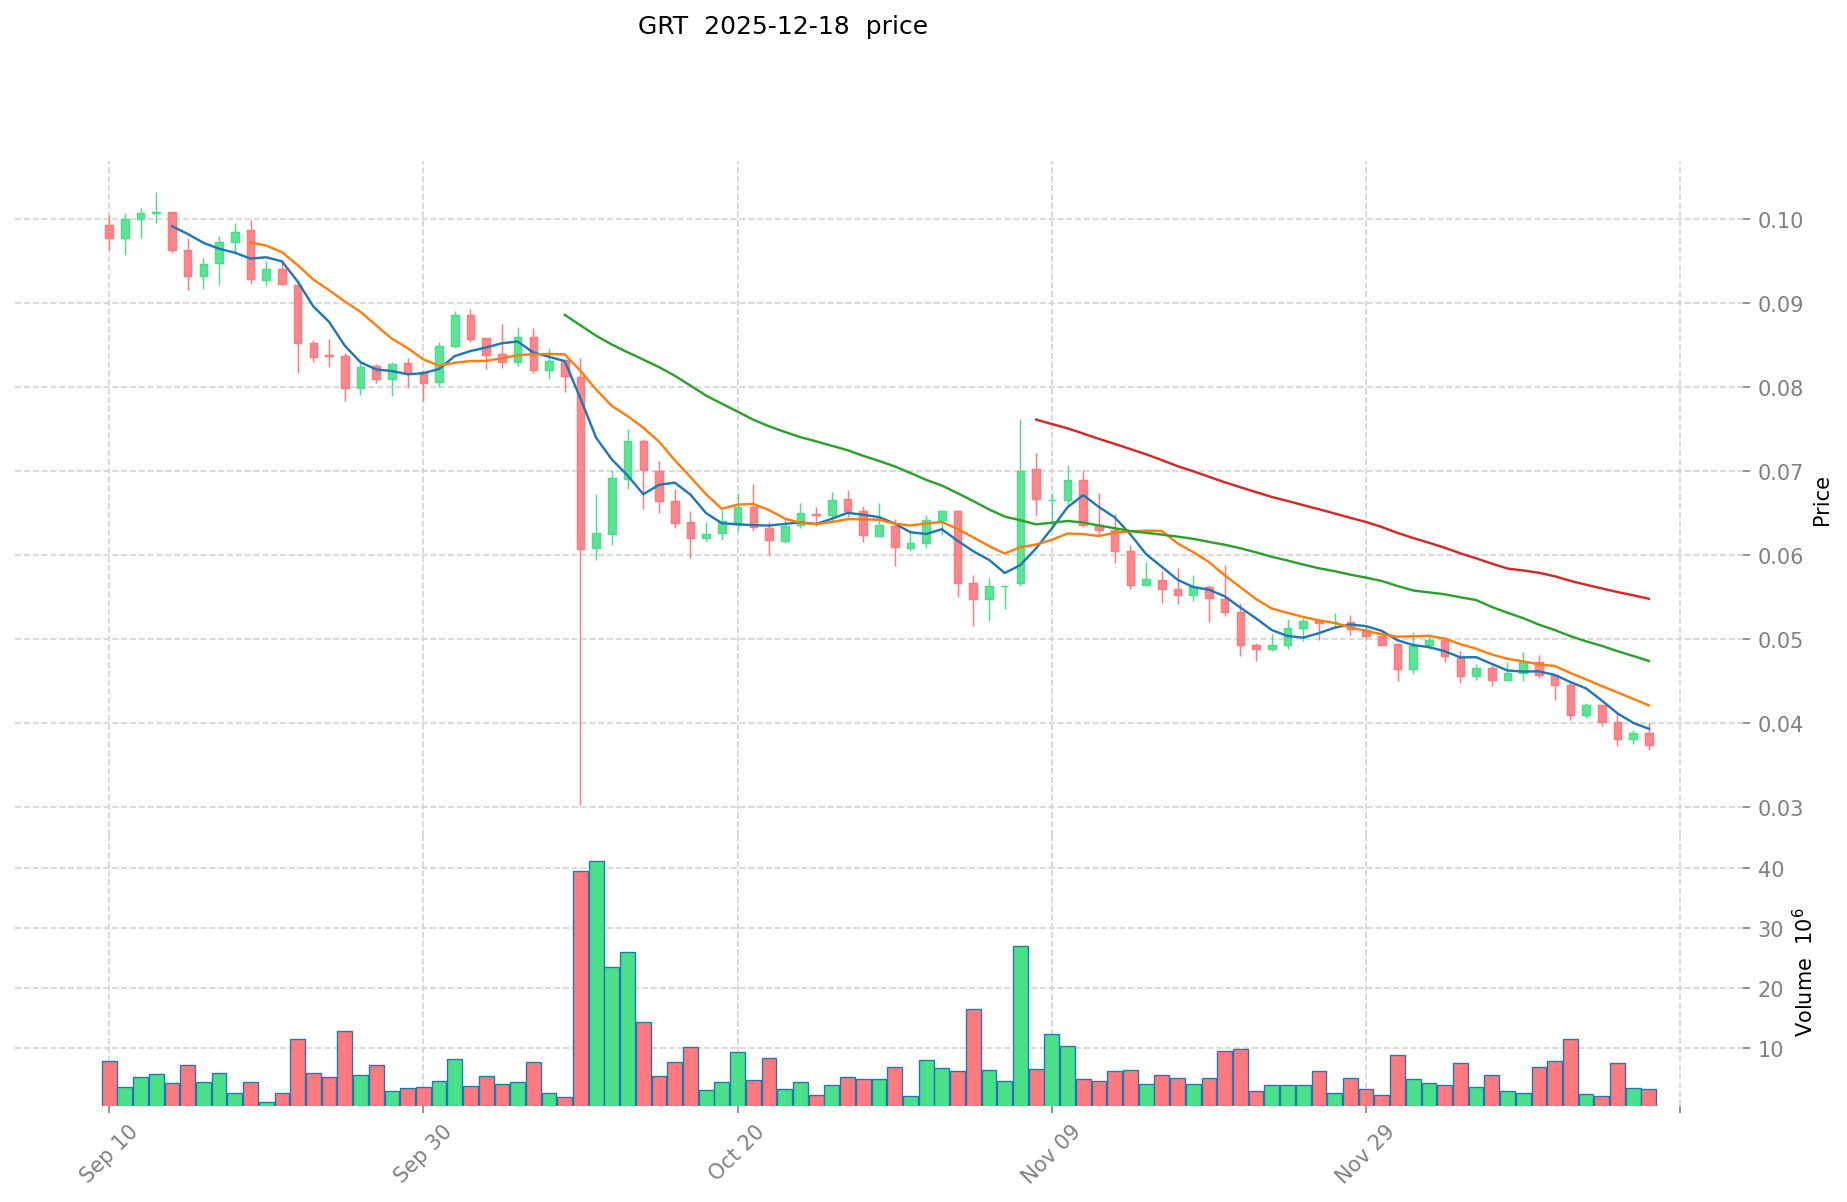
- December 18, 2025: Hit all-time low of $0.03679815
- Price trajectory: Declined from $2.84 to current levels, representing a 87.05% decrease from peak
Comparative Analysis: Both tokens have experienced significant downward pressure since their 2021 peaks. PUNDIX has seen more severe depreciation in absolute percentage terms, while GRT maintains higher trading volumes and broader market adoption across infrastructure applications. Both assets demonstrate the challenging market conditions for altcoins in the post-2021 bull market cycle.
Current Market Status (December 18, 2025)
PUNDIX:
- Current price: $0.2175
- Market capitalization: $56,199,072.69
- 24-hour trading volume: $15,106.75
- Market ranking: #467
- Circulating supply: 258,386,541 PUNDIX
- 1-hour change: -0.5%
- 24-hour change: -2.55%
- 7-day change: -5.48%
- 30-day change: -16.76%
- 1-year change: -56.98%
The Graph (GRT):
- Current price: $0.0367
- Market capitalization: $391,038,732.94
- 24-hour trading volume: $127,782.37
- Market ranking: #142
- Circulating supply: 10,655,006,347.16 GRT
- 1-hour change: -1.13%
- 24-hour change: -4.7%
- 7-day change: -16.66%
- 30-day change: -34.12%
- 1-year change: -85.91%
Market Sentiment Index (Fear & Greed Index):
- Current value: 17
- Status: Extreme Fear
Reference current prices:
II. Project Overview and Fundamentals
PUNDIX - Pundi X Ecosystem
Project Mission: Pundi X aims to democratize cryptocurrency access by enabling users to buy and use digital currencies in daily life. The protocol establishes the world's largest decentralized offline cryptocurrency network through physical point-of-sale integration.
Core Infrastructure:
- XPOS: Physical POS devices installed at retail locations across more than 25 countries
- XWallet: Mobile payment application with over 100,000 registered users
- Cryptocurrency recharge cards: Over 50,000 cards issued
- Token utility: PUNDIX serves the Pundi X ecosystem for transaction fees, member rewards, and consumer incentives
Key Metrics:
- Total holders: 18,417
- Exchange availability: 20 exchanges
- Market share: 0.0018%
The Graph (GRT) - Blockchain Data Infrastructure
Project Mission: The Graph provides a decentralized protocol for indexing and querying blockchain data, specifically supporting Ethereum and IPFS networks. The protocol enables developers to build and publish open APIs (subgraphs) for accessible blockchain data retrieval.
Core Economic Functions:
- Indexer staking: Indexers stake GRT tokens to be discovered by the query market while providing economic security
- Curator Signaling: Curators stake GRT tokens to predict valuable subgraphs for the network and earn rewards for correct predictions
- Query Settlement: Users pay ETH or DAI, with final settlement in GRT to maintain universal accounting units
- Inflation Incentives: Dynamic inflation policy adjustment to encourage specific network behaviors
Key Metrics:
- Total holders: 173,475
- Exchange availability: 61 exchanges
- Market share: 0.012%
- Supported blockchain networks: Ethereum (ETH), Arbitrum (ARBEVM)
III. Market Dynamics and Performance Indicators
Price Volatility Analysis
PUNDIX Recent Performance:
- Short-term momentum: Negative (down 2.55% in 24 hours)
- Medium-term pressure: Moderate (down 5.48% in 7 days)
- Long-term trend: Downtrend (down 56.98% over 1 year)
The Graph Recent Performance:
- Short-term momentum: More negative (down 4.7% in 24 hours)
- Medium-term pressure: Significant (down 16.66% in 7 days)
- Long-term trend: Severe downtrend (down 85.91% over 1 year)
Market Capitalization Comparison
| Metric | PUNDIX | The Graph |
|---|---|---|
| Market Cap | $56.20 M | $391.04 M |
| Fully Diluted Valuation | $56.20 M | $396.37 M |
| Market Cap/FDV Ratio | 99.95% | 98.66% |
| Market Dominance | 0.0018% | 0.012% |
The Graph maintains significantly larger market capitalization and broader market recognition, with GRT representing approximately 7 times the market value of PUNDIX.
Trading Volume and Liquidity
- PUNDIX 24-hour volume: $15,106.75
- The Graph 24-hour volume: $127,782.37
- Volume ratio: GRT shows approximately 8.5 times higher trading activity
The Graph demonstrates substantially higher trading activity, indicating greater market liquidity and institutional interest.
IV. On-Chain Infrastructure and Network Adoption
PUNDIX Ecosystem Development
The project's infrastructure focuses on physical retail integration rather than pure blockchain metrics. The deployment of 25,000+ XPOS terminals across 25 countries and issuance of 50,000+ cryptocurrency recharge cards represent real-world use case expansion attempts. However, the holder count of 18,417 remains relatively modest for a project claiming global retail network ambitions.
The Graph Protocol Network
The Graph's infrastructure operates at the blockchain protocol layer, supporting decentralized application (dApp) development. Notable adoption includes integration with major DeFi platforms such as Aave, Curve, and Uniswap. The holder count of 173,475 reflects broader developer and institutional participation in the protocol. Multi-chain deployment (Ethereum and Arbitrum) enables broader ecosystem support.
Investment Value Analysis: PUNDIX vs GRT
I. Executive Summary
This report analyzes the core investment value factors of PUNDIX and GRT, two distinct cryptocurrency assets serving different sectors within the blockchain ecosystem. PUNDIX focuses on blockchain-based payment solutions, while GRT serves the decentralized finance infrastructure. The analysis examines tokenomics, market adoption, technological development, and macroeconomic influences on both assets.
II. Core Factors Influencing PUNDIX vs GRT Investment Value
Supply Mechanism and Tokenomics
- PUNDIX: Supply scarcity and token circulation mechanisms form the foundation of its value proposition. The asset's supply structure directly influences price volatility and long-term valuation potential.
- GRT: Token supply mechanisms similarly impact market dynamics through institutional and mainstream adoption cycles.
- 📌 Historical Pattern: Supply mechanisms drive cyclical price movements influenced by market sentiment regarding token scarcity and circulation velocity.
Institutional Adoption and Market Applications
- Institutional Holdings: Market preference varies based on use case clarity and regulatory certainty. Payment-focused assets like PUNDIX attract different institutional profiles compared to infrastructure-focused tokens like GRT.
- Enterprise Adoption:
- PUNDIX: Positioned as a blockchain payment solution addressing cryptocurrency adoption barriers in daily transactions. Focus on enabling crypto purchases and payments in real-world scenarios.
- GRT: Serves decentralized finance infrastructure requirements, supporting different market segments and use cases.
- Regulatory Environment: Policy monitoring and regulatory attitudes across different jurisdictions significantly influence adoption rates and investment sentiment for both assets.
Technological Development and Ecosystem
- PUNDIX: Founded by Pundi X Labs in 2018 with the mission to solve practical cryptocurrency adoption obstacles. Technology development focuses on streamlining crypto transaction processes in everyday applications.
- GRT: Serves the decentralized finance sector with infrastructure-level utilities.
- Ecosystem Comparison: Both assets operate within distinct ecosystem segments—PUNDIX in payment solutions and GRT in DeFi infrastructure. Ongoing technical and ecological development remains critical for long-term value creation.
Macroeconomic Factors and Market Cycles
- Inflation Environment: Different macroeconomic trends, policy regulations, and technological innovations influence both assets' price performance. Market sentiment regarding widespread adoption or major technical breakthroughs directly impacts price movement.
- Monetary Policy Influence: Macroeconomic conditions including interest rates and USD index fluctuations affect both assets' valuations.
- Geopolitical Considerations: Cross-border transaction demand and international developments influence adoption patterns and market dynamics.
III. Key Price Drivers
Market sentiment emerges as a critical factor affecting PUNDIX/USD and similar trading pairs. Investor confidence and sentiment directly influence price trajectories, particularly in response to:
- Announcements regarding widespread adoption
- Major technological breakthroughs
- Regulatory developments
- Macroeconomic environment shifts
IV. Risk Factors and Considerations
- Cryptocurrency price volatility remains significant across both assets
- Regulatory uncertainty persists across different jurisdictions
- Market sentiment can shift rapidly based on technical announcements or policy changes
- Macroeconomic conditions create systemic influences on asset valuations
V. Conclusion
PUNDIX and GRT represent distinct investment opportunities within the cryptocurrency ecosystem, serving different market segments. Investment value for both assets depends on supply mechanisms, institutional adoption trajectories, technological development progress, and macroeconomic conditions. Investors should monitor regulatory developments, technology updates, and broader market sentiment shifts to assess relative value propositions over different time horizons.
Disclaimer: This report is intended for informational purposes only and does not constitute investment advice.
III. 2025-2030 Price Forecast: PUNDIX vs GRT
Short-term Forecast (2025)
- PUNDIX: Conservative $0.124-$0.218 | Optimistic $0.218-$0.259
- GRT: Conservative $0.022-$0.037 | Optimistic $0.037-$0.043
Mid-term Forecast (2027-2028)
- PUNDIX may enter accumulation phase with price range $0.281-$0.431, showing 33-65% growth potential
- GRT may enter early discovery phase with price range $0.041-$0.075, demonstrating 27-58% appreciation
- Key drivers: institutional capital inflow, spot ETF approvals, ecosystem expansion and developer adoption
Long-term Forecast (2029-2030)
- PUNDIX: Base case $0.390-$0.428 | Optimistic case $0.553-$0.679
- GRT: Base case $0.066-$0.078 | Optimistic case $0.090-$0.097
Disclaimer: This analysis is based on historical data patterns and mathematical modeling. Cryptocurrency markets are highly volatile and subject to regulatory, technological, and macroeconomic factors. Predictions do not constitute investment advice. Investors should conduct independent research and consult financial advisors before making investment decisions. Past performance does not guarantee future results.
PUNDIX:
| 年份 | 预测最高价 | 预测平均价格 | 预测最低价 | 涨跌幅 |
|---|---|---|---|---|
| 2025 | 0.259182 | 0.2178 | 0.124146 | 0 |
| 2026 | 0.34342704 | 0.238491 | 0.12401532 | 9 |
| 2027 | 0.4306193496 | 0.29095902 | 0.174575412 | 33 |
| 2028 | 0.418515454368 | 0.3607891848 | 0.281415564144 | 65 |
| 2029 | 0.55330629380928 | 0.389652319584 | 0.24937748453376 | 79 |
| 2030 | 0.678930201643161 | 0.47147930669664 | 0.282887584017984 | 116 |
GRT:
| 年份 | 预测最高价 | 预测平均价格 | 预测最低价 | 涨跌幅 |
|---|---|---|---|---|
| 2025 | 0.0429858 | 0.03674 | 0.0216766 | 0 |
| 2026 | 0.053814915 | 0.0398629 | 0.024714998 | 8 |
| 2027 | 0.069789972175 | 0.0468389075 | 0.041686627675 | 27 |
| 2028 | 0.074642482992 | 0.0583144398375 | 0.04082010788625 | 58 |
| 2029 | 0.09041070752406 | 0.06647846141475 | 0.05850104604498 | 81 |
| 2030 | 0.097271284742062 | 0.078444584469405 | 0.049420088215725 | 113 |
Comparative Investment Analysis: PUNDIX vs The Graph (GRT)
IV. Investment Strategy Comparison: PUNDIX vs GRT
Long-term vs Short-term Investment Strategy
PUNDIX:
- Suited for investors focusing on real-world payment adoption scenarios and ecosystem expansion in retail cryptocurrency integration
- Long-term thesis relies on XPOS terminal network expansion and cryptocurrency adoption in daily transactions across emerging markets
- Short-term positioning requires monitoring retail deployment milestones and user adoption metrics
The Graph (GRT):
- Suited for investors seeking infrastructure-level exposure to decentralized finance ecosystem development and protocol-layer value capture
- Long-term thesis dependent on DeFi ecosystem growth, developer adoption of subgraphs, and multi-chain infrastructure expansion
- Short-term positioning sensitive to DeFi market sentiment and smart contract platform activity
Risk Management and Asset Allocation
Conservative Investors:
- PUNDIX: 15-20% portfolio allocation
- GRT: 25-30% portfolio allocation
- Rationale: GRT's larger market capitalization and broader exchange availability provide enhanced liquidity for risk-averse positioning
Aggressive Investors:
- PUNDIX: 30-40% portfolio allocation
- GRT: 20-25% portfolio allocation
- Rationale: PUNDIX's higher volatility and lower market cap present elevated asymmetric upside potential for growth-oriented investors
Hedging Instruments:
- Stablecoin allocation: 20-30% for portfolio stability
- Cross-asset diversification: Combine with Ethereum (ETH) or other layer-1 blockchain tokens
- Options strategies: Consider protective puts during extreme fear periods (current Fear & Greed Index: 17)
V. Comparative Risk Analysis
Market Risk
PUNDIX:
- High volatility with 56.98% annual depreciation; extreme sensitivity to retail adoption announcements and cryptocurrency market sentiment
- Limited trading liquidity ($15,106.75 daily volume) creates price impact vulnerability during significant order flows
- Concentration risk: Only 18,417 token holders indicates potential whale manipulation exposure
The Graph (GRT):
- Severe volatility with 85.91% annual depreciation; greater downside pressure despite larger market capitalization
- Improved liquidity ($127,782.37 daily volume) mitigates immediate price impact concerns
- Enhanced holder diversity (173,475 holders) reduces single-actor manipulation risk
Technology Risk
PUNDIX:
- Real-world infrastructure dependency: XPOS terminal reliability, maintenance requirements, and technical obsolescence present operational vulnerabilities
- Integration complexity: Cross-border POS network coordination across 25+ countries involves regulatory and technical fragmentation
- Payment protocol competition: Emerging fintech solutions and CBDC development may displace proprietary payment solutions
The Graph (GRT):
- Protocol scalability: Indexing performance under high query loads and network congestion scenarios requires continuous optimization
- Smart contract security: Potential vulnerabilities in core protocol contracts affecting validator and curator fund safety
- Ethereum dependency: Protocol performance directly influenced by Ethereum layer-1 network conditions and fee structures
Regulatory Risk
PUNDIX:
- Multi-jurisdictional payment regulation: Operating across 25+ countries exposes project to varying anti-money laundering (AML), know-your-customer (KYC), and payment licensing requirements
- Central bank digital currency (CBDC) competition: Government-issued digital payment solutions may restrict retail cryptocurrency payment adoption
- Device classification ambiguity: Regulatory status of XPOS terminals may shift under evolving financial technology regulations
The Graph (GRT):
- Token classification uncertainty: Regulatory treatment of GRT as security versus utility token varies across jurisdictions
- Query protocol governance: Decentralized indexing protocol governance may face regulatory scrutiny regarding protocol neutrality and content moderation
- DeFi regulatory environment: Restrictions on DeFi protocol participation or query access could limit GRT utility and value capture
VI. Conclusion: Which Is the Better Buy?
Investment Value Summary
PUNDIX Advantages:
- Unique real-world payment infrastructure positioning addresses practical cryptocurrency adoption barriers
- Lower market cap ($56.20M) provides potential for higher percentage appreciation in favorable market cycles
- Discrete XPOS terminal deployment metrics enable tangible project progress tracking
The Graph Advantages:
- Established infrastructure protocol serving multiple DeFi platforms (Aave, Curve, Uniswap) demonstrates concrete ecosystem integration
- 7-fold larger market capitalization ($391.04M) provides enhanced liquidity and institutional accessibility
- Multi-chain support (Ethereum, Arbitrum) offers ecosystem resilience and growth optionality
- 9-fold larger holder base (173,475 vs 18,417) indicates broader market participation and reduced manipulation risk
Investment Recommendations
Beginner Investors:
- Primary recommendation: The Graph (GRT) offers established infrastructure positioning and broader liquidity suitable for entry-level cryptocurrency investors
- Strategy: Dollar-cost averaging approach across 12-24 month timeframe to mitigate entry point volatility
- Risk control: Limit combined PUNDIX/GRT allocation to 5-10% of total cryptocurrency portfolio
Experienced Investors:
- Differentiated approach: Dual allocation combining GRT (60-70%) for portfolio stability with PUNDIX (30-40%) for asymmetric upside exposure
- Strategy: GRT serves infrastructure exposure hedge; PUNDIX provides emerging market payment thesis participation
- Active management: Monitor quarterly ecosystem metrics, adoption data, and regulatory developments; rebalance based on risk/reward shifts
Institutional Investors:
- Primary positioning: The Graph (GRT) provides institutional-grade liquidity, 61-exchange availability, and established protocol governance suitable for fund allocations
- Secondary consideration: PUNDIX requires operational diligence regarding real-world infrastructure deployment, merchant integration metrics, and geographic regulatory compliance
- Portfolio construction: GRT integration into DeFi infrastructure strategy; PUNDIX reserved for specialized payment adoption thematic funds only
Current Market Assessment (December 18, 2025)
Both assets trade in extreme fear conditions (Fear & Greed Index: 17), presenting asymmetric risk/reward dynamics. GRT's superior market structure, liquidity, and ecosystem integration position it as lower-risk infrastructure exposure. PUNDIX's underdeveloped market structure and limited liquidity create both elevated risks and potential rewards for specialized investors targeting payment solutions thesis.
Risk Disclaimer: Cryptocurrency markets demonstrate extreme volatility with both PUNDIX and GRT showing significant year-to-date depreciation. This analysis is provided for informational purposes only and does not constitute investment advice. Investors must conduct independent research, assess individual risk tolerance, and consult professional financial advisors before making investment decisions. Past performance does not guarantee future results. Price forecasts are based on historical patterns and mathematical modeling and remain subject to regulatory, technological, and macroeconomic uncertainties that could significantly alter projected valuations. None
Frequently Asked Questions: PUNDIX vs The Graph (GRT) Investment Comparison
FAQ
Q1: What are the main differences between PUNDIX and GRT in terms of project positioning?
A: PUNDIX focuses on real-world cryptocurrency payment solutions through physical XPOS terminals deployed across 25+ countries, enabling users to buy and use crypto in daily transactions. The Graph (GRT) serves as decentralized infrastructure for indexing and querying blockchain data on Ethereum and other networks, supporting DeFi platforms like Aave, Curve, and Uniswap. PUNDIX targets retail payment adoption while GRT targets protocol-layer infrastructure development.
Q2: How do the current market capitalizations and liquidity compare between these two assets?
A: The Graph maintains significantly larger market capitalization at $391.04M compared to PUNDIX at $56.20M—approximately 7 times larger. GRT demonstrates substantially higher trading liquidity with $127,782.37 in 24-hour volume versus PUNDIX's $15,106.75, roughly 8.5 times greater. GRT is listed on 61 exchanges while PUNDIX trades on only 20 exchanges, providing GRT with superior institutional accessibility and reduced price impact risk.
Q3: Which asset has experienced more severe price depreciation from its all-time high?
A: PUNDIX has declined 99.78% from its all-time high of $10.07 (March 31, 2021) to current levels around $0.2175, while The Graph has declined 87.05% from its all-time high of $2.84 (February 12, 2021) to current levels around $0.0367. However, GRT shows more severe one-year performance with an 85.91% decline compared to PUNDIX's 56.98% one-year depreciation.
Q4: What are the key differences in holder distribution and market concentration risk?
A: The Graph demonstrates significantly broader market participation with 173,475 token holders compared to PUNDIX's 18,417 holders—approximately 9 times larger. PUNDIX's concentrated holder base presents elevated manipulation risk and lower market resilience, while GRT's distributed holder base suggests more decentralized market structure and reduced single-actor influence potential.
Q5: Which asset is more suitable for beginner investors considering current market conditions?
A: The Graph (GRT) is recommended for beginner investors due to established infrastructure positioning, proven ecosystem integration with major DeFi platforms, superior market liquidity, broader exchange availability, and reduced manipulation risk from larger holder distribution. PUNDIX's limited liquidity and concentrated holder base create higher execution risk for entry-level investors. Beginners should implement dollar-cost averaging over 12-24 months and limit combined allocation to 5-10% of total cryptocurrency portfolio.
Q6: How do the long-term price forecasts compare for both assets through 2030?
A: PUNDIX forecasts range from $0.39-$0.43 (base case) to $0.55-$0.68 (optimistic case) by 2030, representing 79-116% growth potential from current levels. The Graph forecasts range from $0.066-$0.078 (base case) to $0.090-$0.097 (optimistic case) by 2030, representing 81-113% growth potential. Both assets project substantial appreciation, though actual results depend on adoption metrics, regulatory developments, and macroeconomic conditions.
Q7: What are the primary risk factors distinguishing PUNDIX and GRT investments?
A: PUNDIX faces real-world infrastructure operational risks including XPOS terminal reliability, cross-border regulatory fragmentation across 25+ countries, and competition from emerging fintech solutions and CBDCs. The Graph faces protocol scalability challenges, Ethereum dependency, and regulatory uncertainty regarding token classification. GRT presents lower concentration risk while PUNDIX presents higher execution risk from limited market infrastructure.
Q8: What portfolio allocation strategy is recommended for experienced cryptocurrency investors?
A: Experienced investors should consider allocating 60-70% to The Graph for portfolio stability and infrastructure exposure hedge, combined with 30-40% to PUNDIX for asymmetric upside exposure targeting emerging market payment adoption thesis. This dual allocation approach leverages GRT's established market position while maintaining PUNDIX exposure to potential payment infrastructure adoption scenarios. Active quarterly rebalancing based on ecosystem metrics, adoption data, and regulatory developments is essential for optimizing risk-adjusted returns.
Disclaimer: This FAQ is provided for informational purposes only and does not constitute investment advice. Cryptocurrency markets demonstrate extreme volatility and are subject to significant regulatory, technological, and macroeconomic uncertainties. Investors must conduct independent research, assess individual risk tolerance, and consult professional financial advisors before making investment decisions. Past performance does not guarantee future results.
Share
Content
Introduction: PUNDIX vs GRT Investment Comparison
I. Historical Price Comparison and Current Market Status
II. Project Overview and Fundamentals
III. Market Dynamics and Performance Indicators
IV. On-Chain Infrastructure and Network Adoption
I. Executive Summary
II. Core Factors Influencing PUNDIX vs GRT Investment Value
III. Key Price Drivers
IV. Risk Factors and Considerations
V. Conclusion
III. 2025-2030 Price Forecast: PUNDIX vs GRT
IV. Investment Strategy Comparison: PUNDIX vs GRT
V. Comparative Risk Analysis
VI. Conclusion: Which Is the Better Buy?
FAQ
How to Buy Cryptocurrency


Trending Cryptocurrencies


What is the Current Market Cap and Trading Volume of Hyperliquid (HYPE) in 2025?

What Is the Current Market Overview of Zebec Network (ZBCN) in 2025?

What Does the Crypto Market Overview Reveal About Top Coins in 2025?

XSWAP vs BAT: A Comparative Analysis of Two Innovative Cryptocurrency Platforms
G vs LINK: A Comprehensive Comparison of Two Leading Blockchain Protocols and Their Impact on Decentralized Finance
BTRST vs AAVE: Comparing Two Leading Governance Tokens in the DeFi Ecosystem

Guide to Participating in Wormhole Airdrop and Claiming Rewards
Trading Popular Memecoins on BNB Chain Safely and Effectively
Claim Your Solana Airdrop Rewards: A Step-by-Step Guide

Exploring WalletConnect: A Step-by-Step Guide to Connecting with Web3
Dự đoán và hướng dẫn mua Bondex Origin (BDXN) - Giá mới nhất